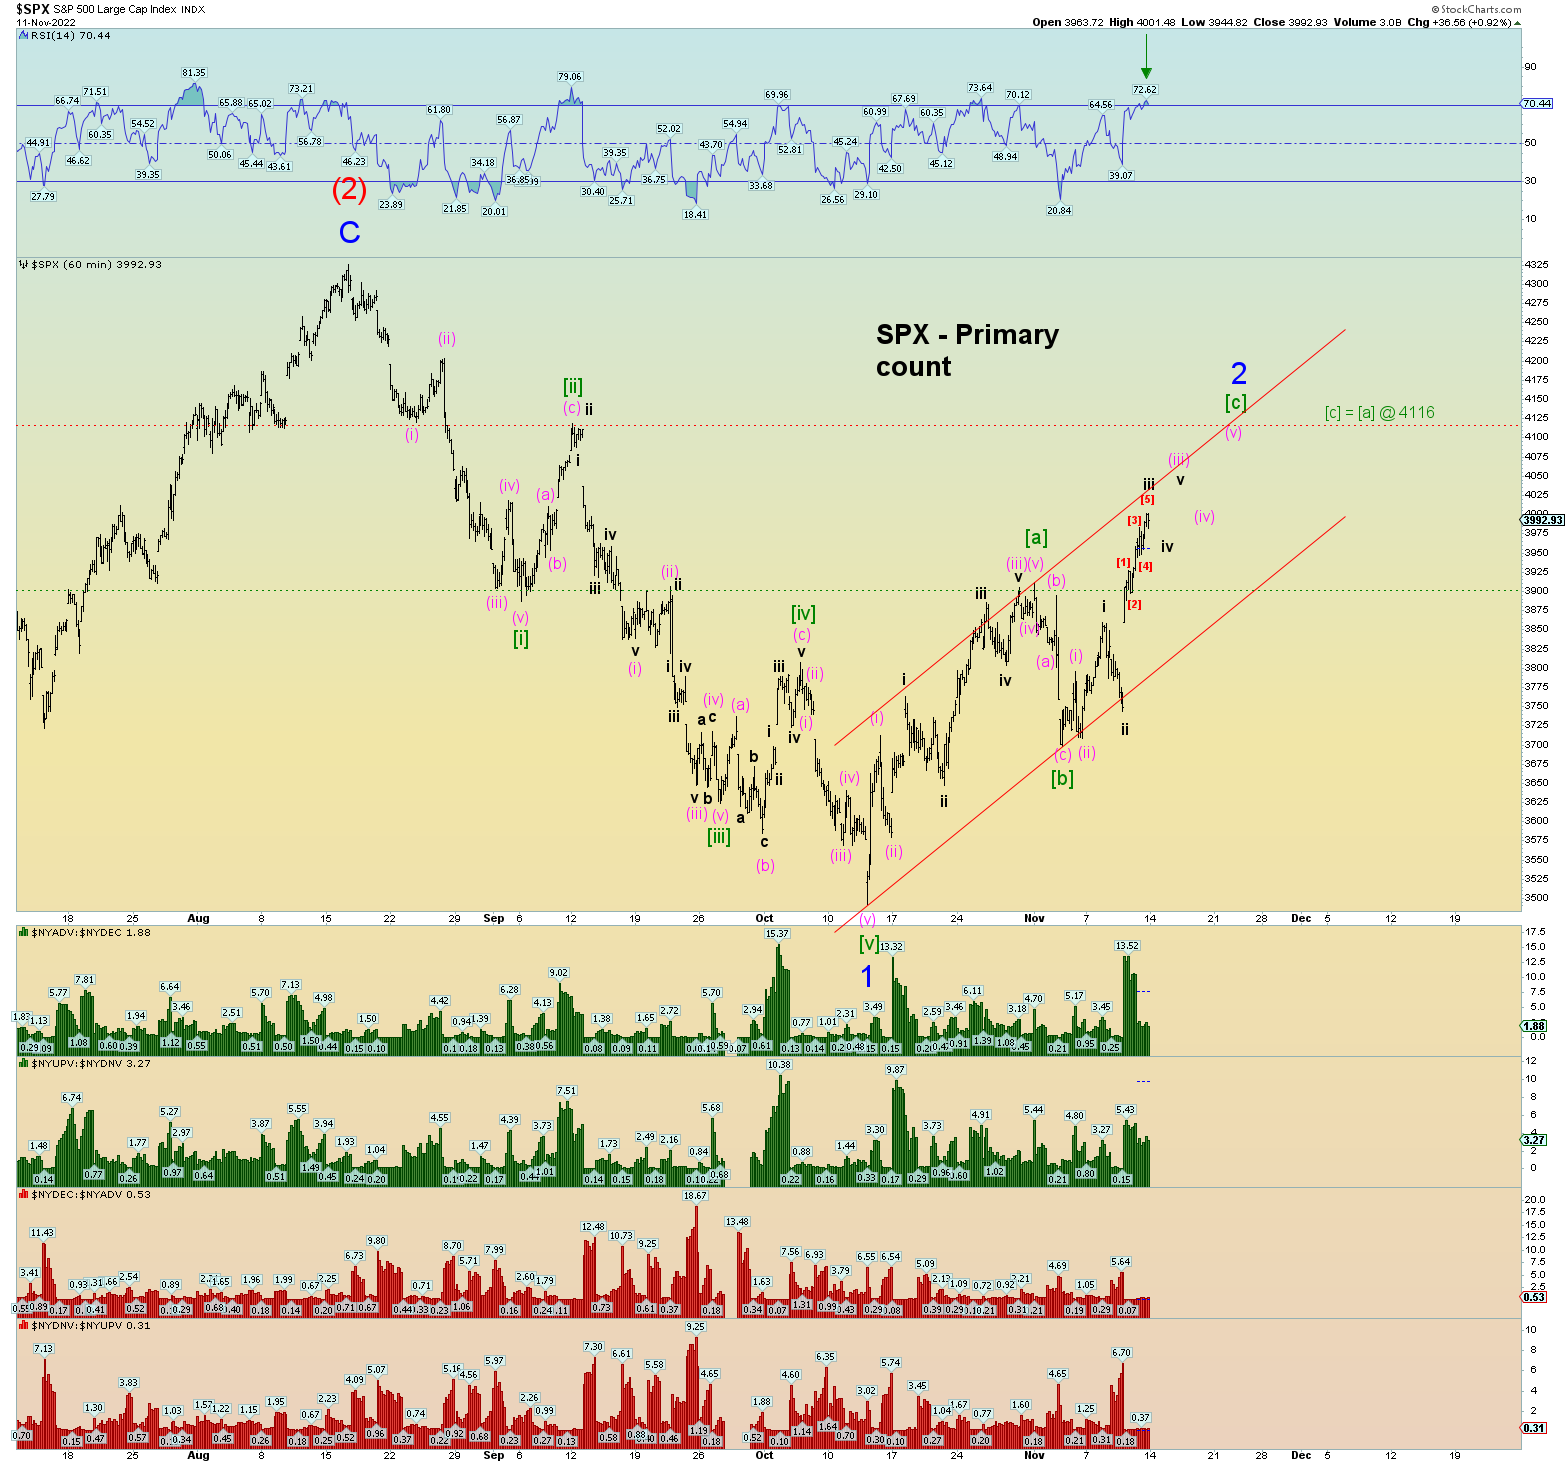
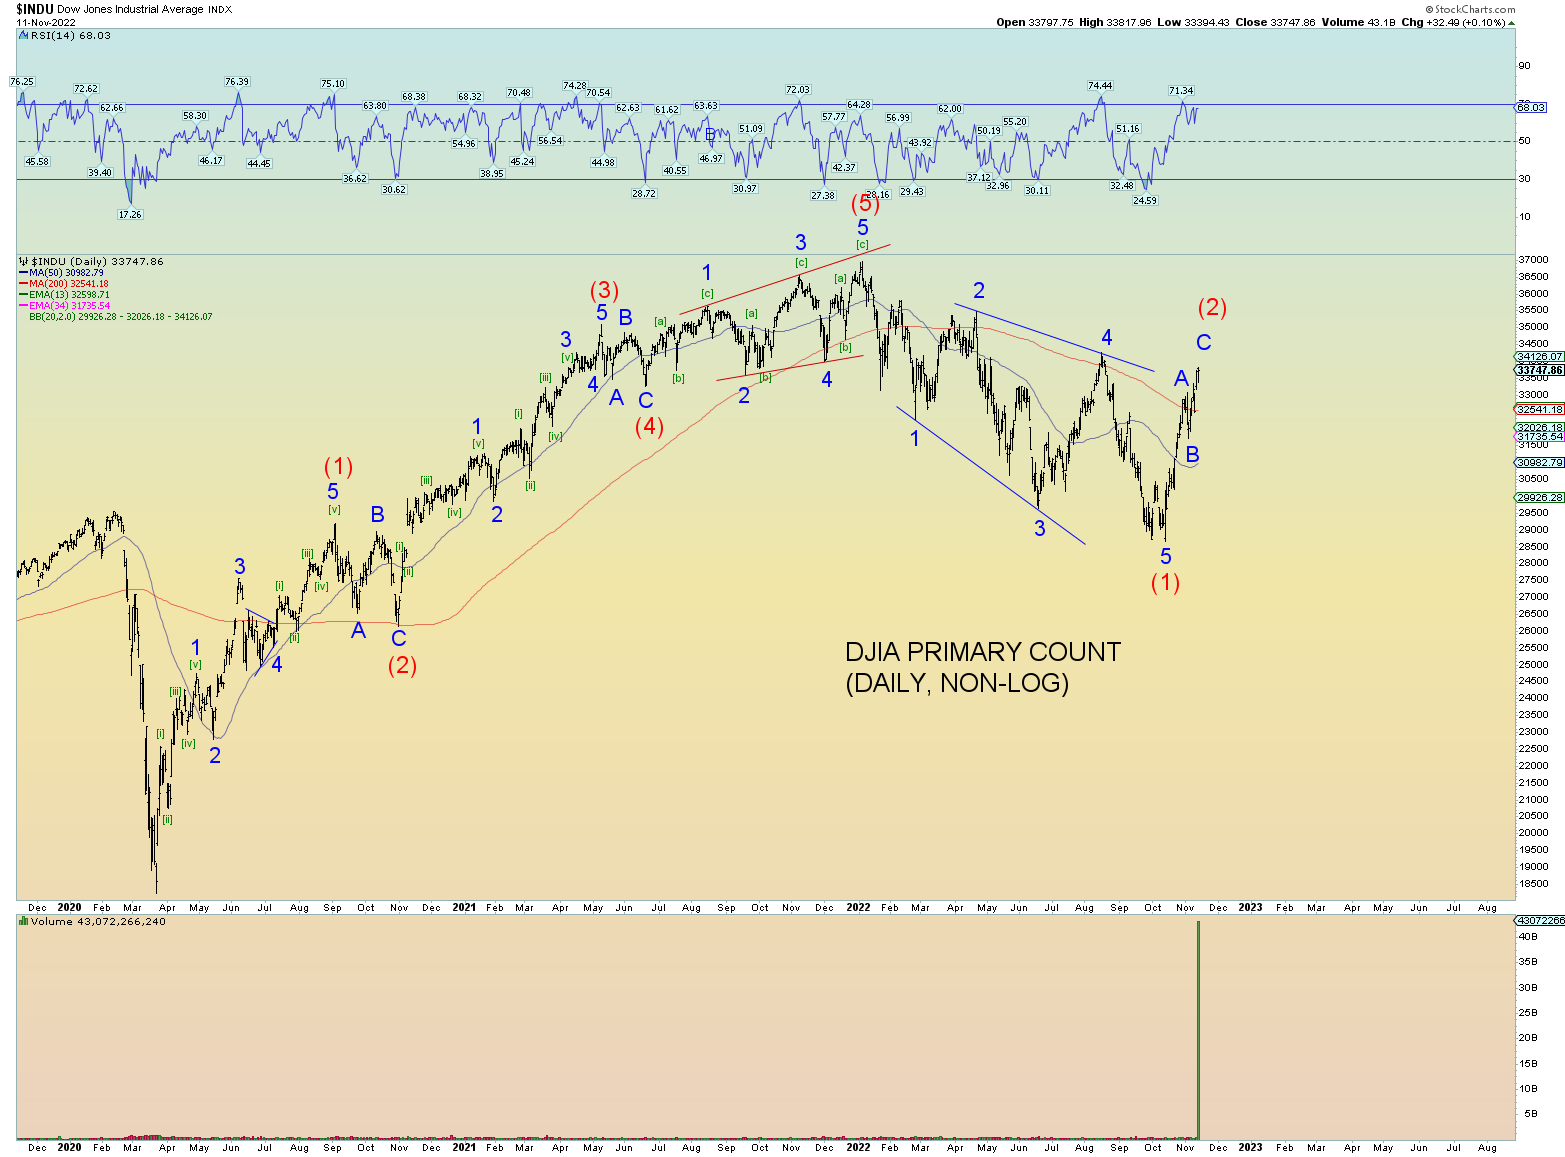
Looking for peak hourly RSI which would suggest the peak of wave iii of (iii) of [c] of 2. Then after peak RSI, the unfolding of the subsequent waves to proper Minor 2 peak. The big open gap seems an obvious target and the 200 DMA.
As EWI likes to say, nine waves down constitute an impulse move.
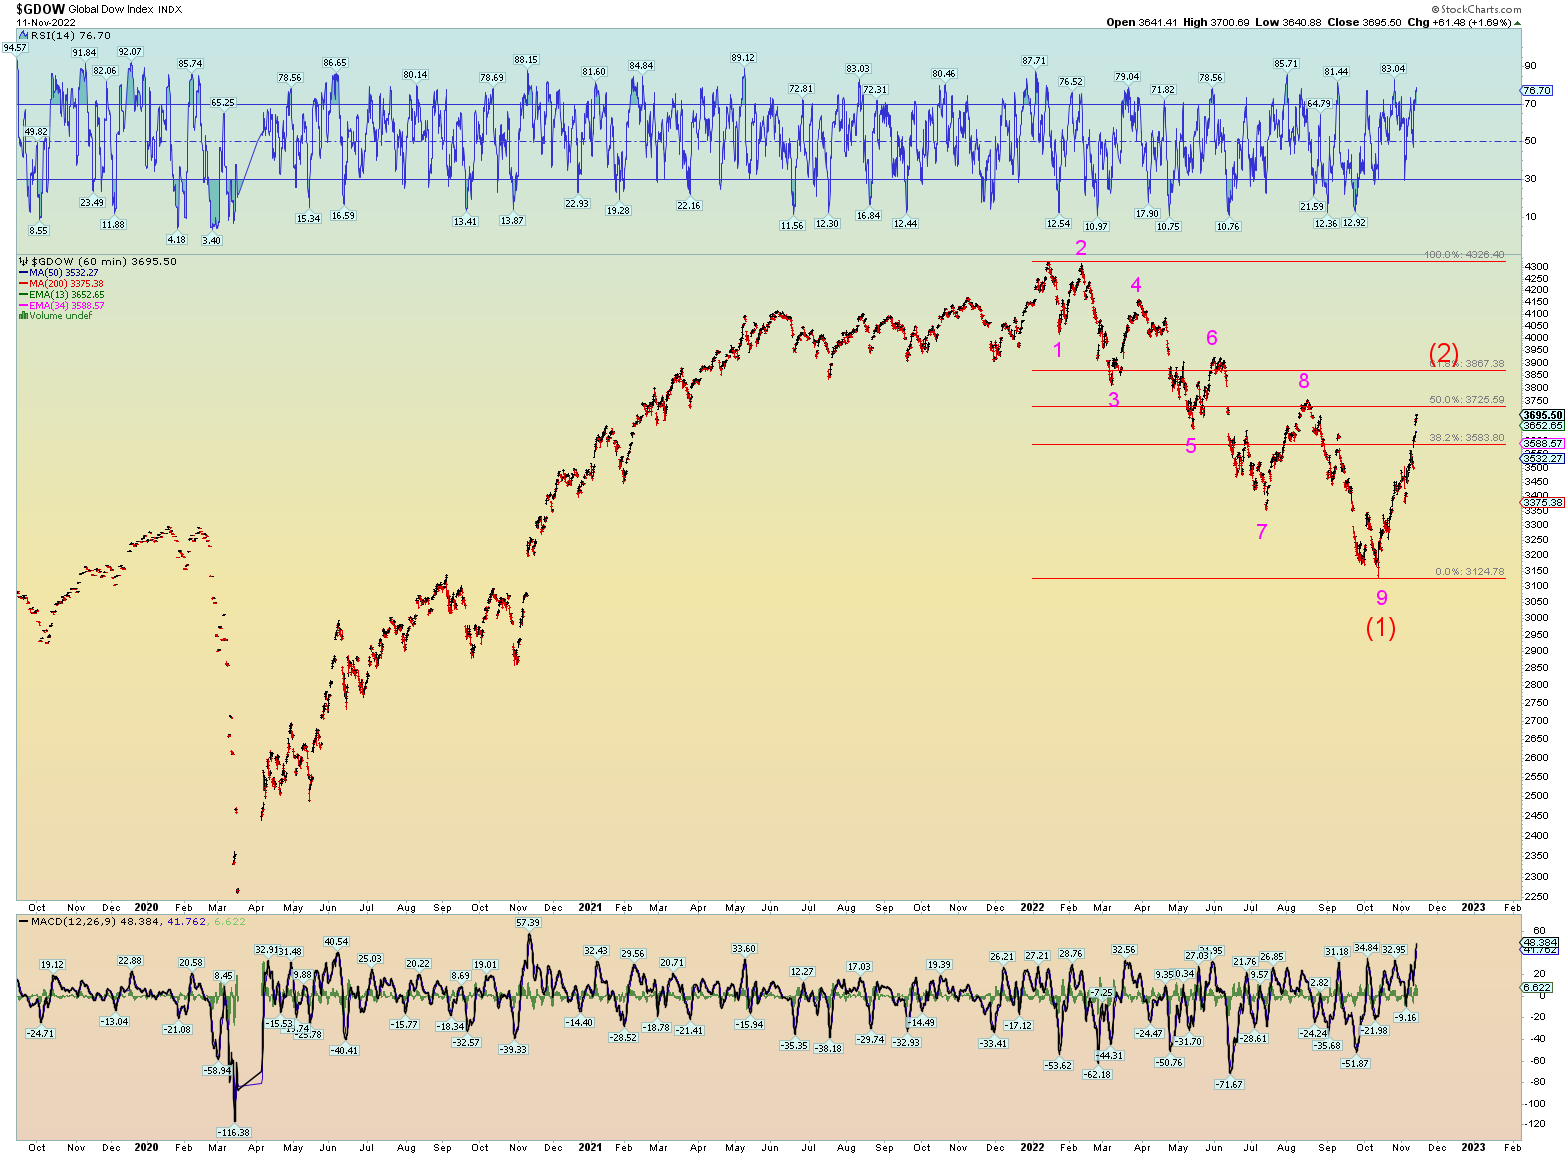
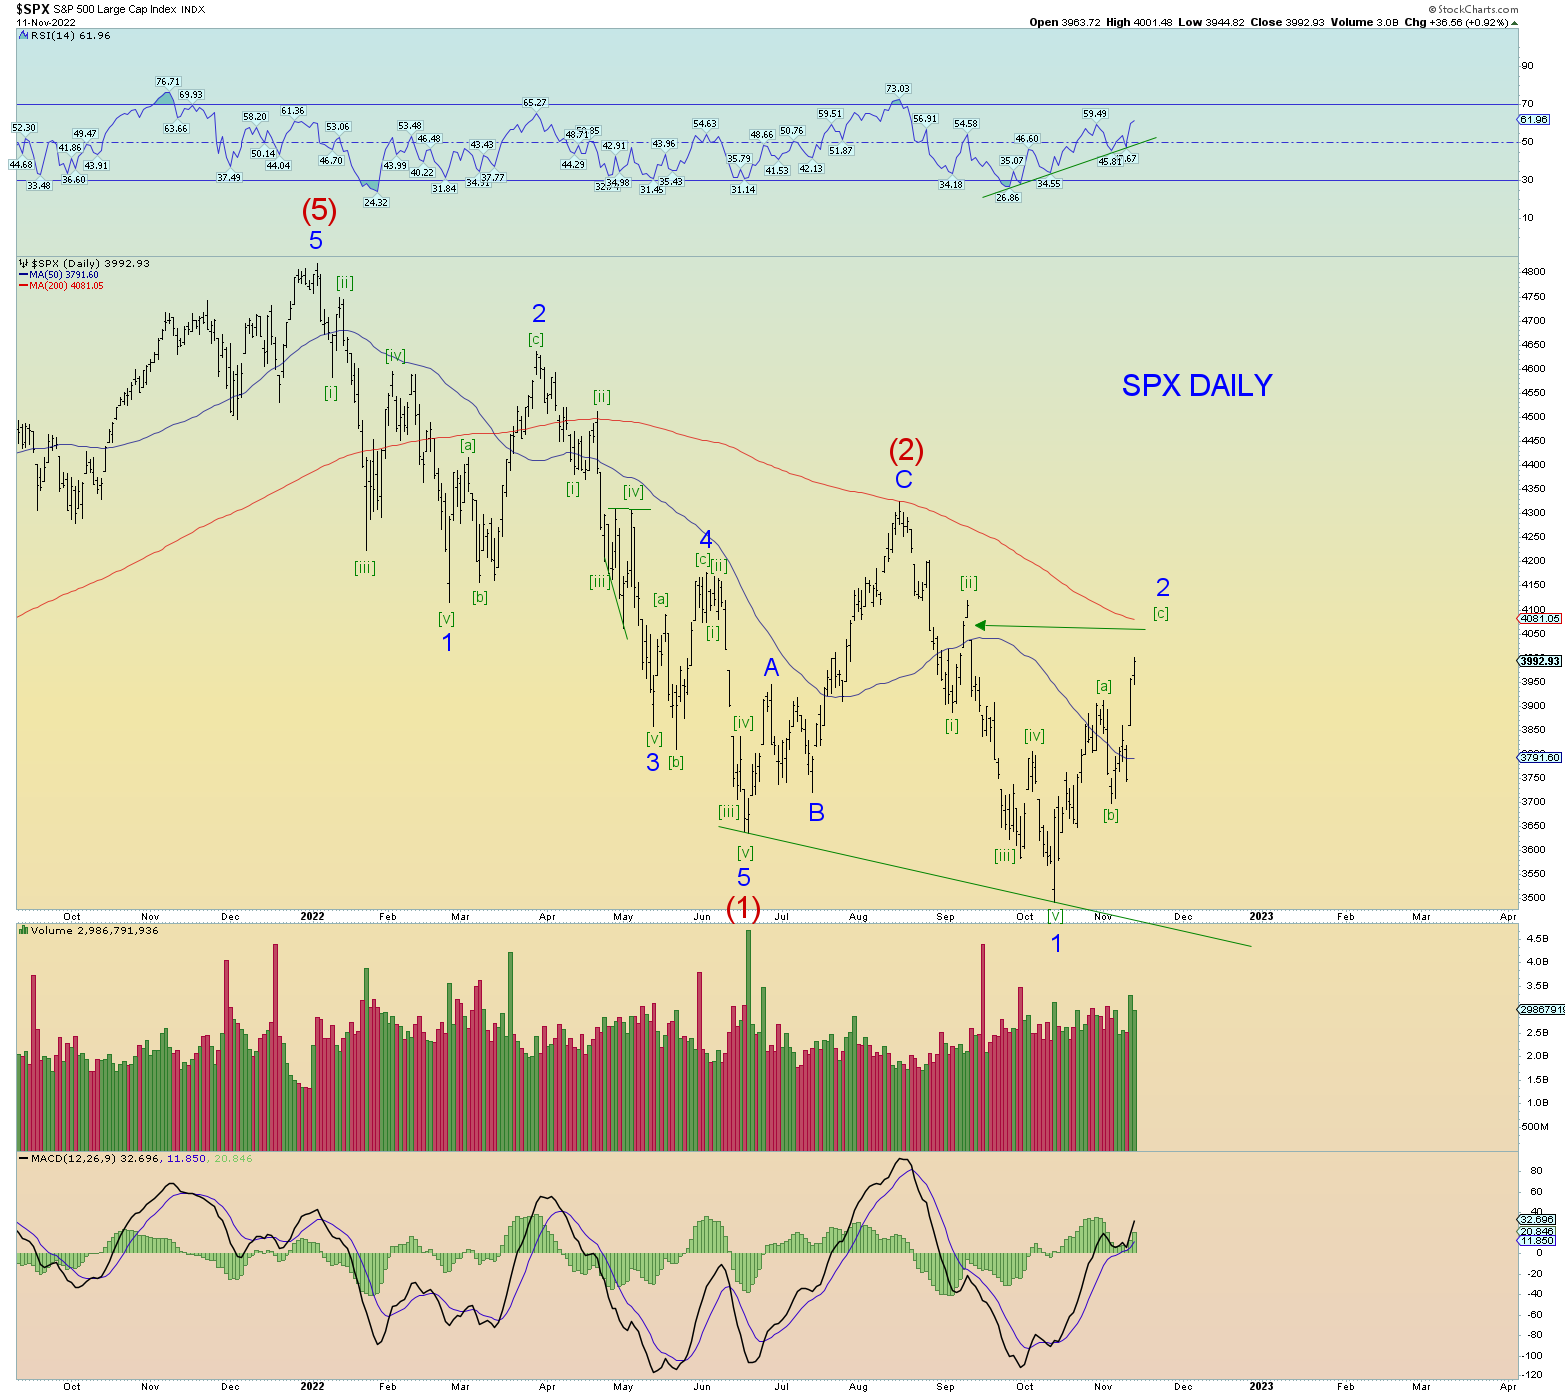
These are HUGE waves since the peak and the market has been rocked. It’s as if the market is fighting itself in a futile effort.
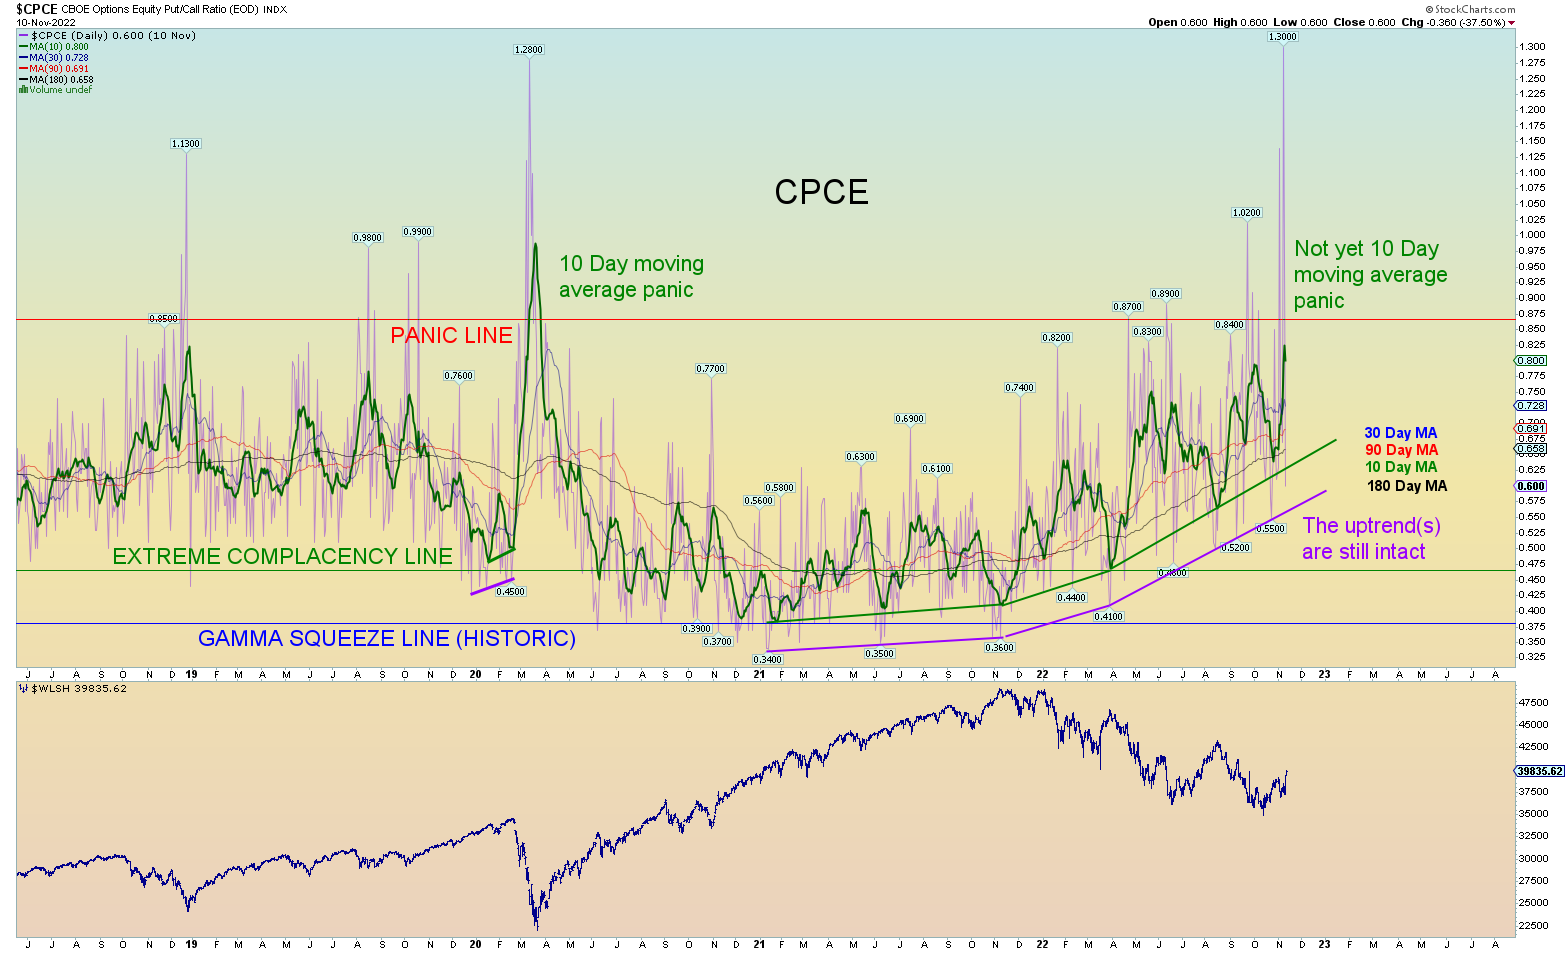
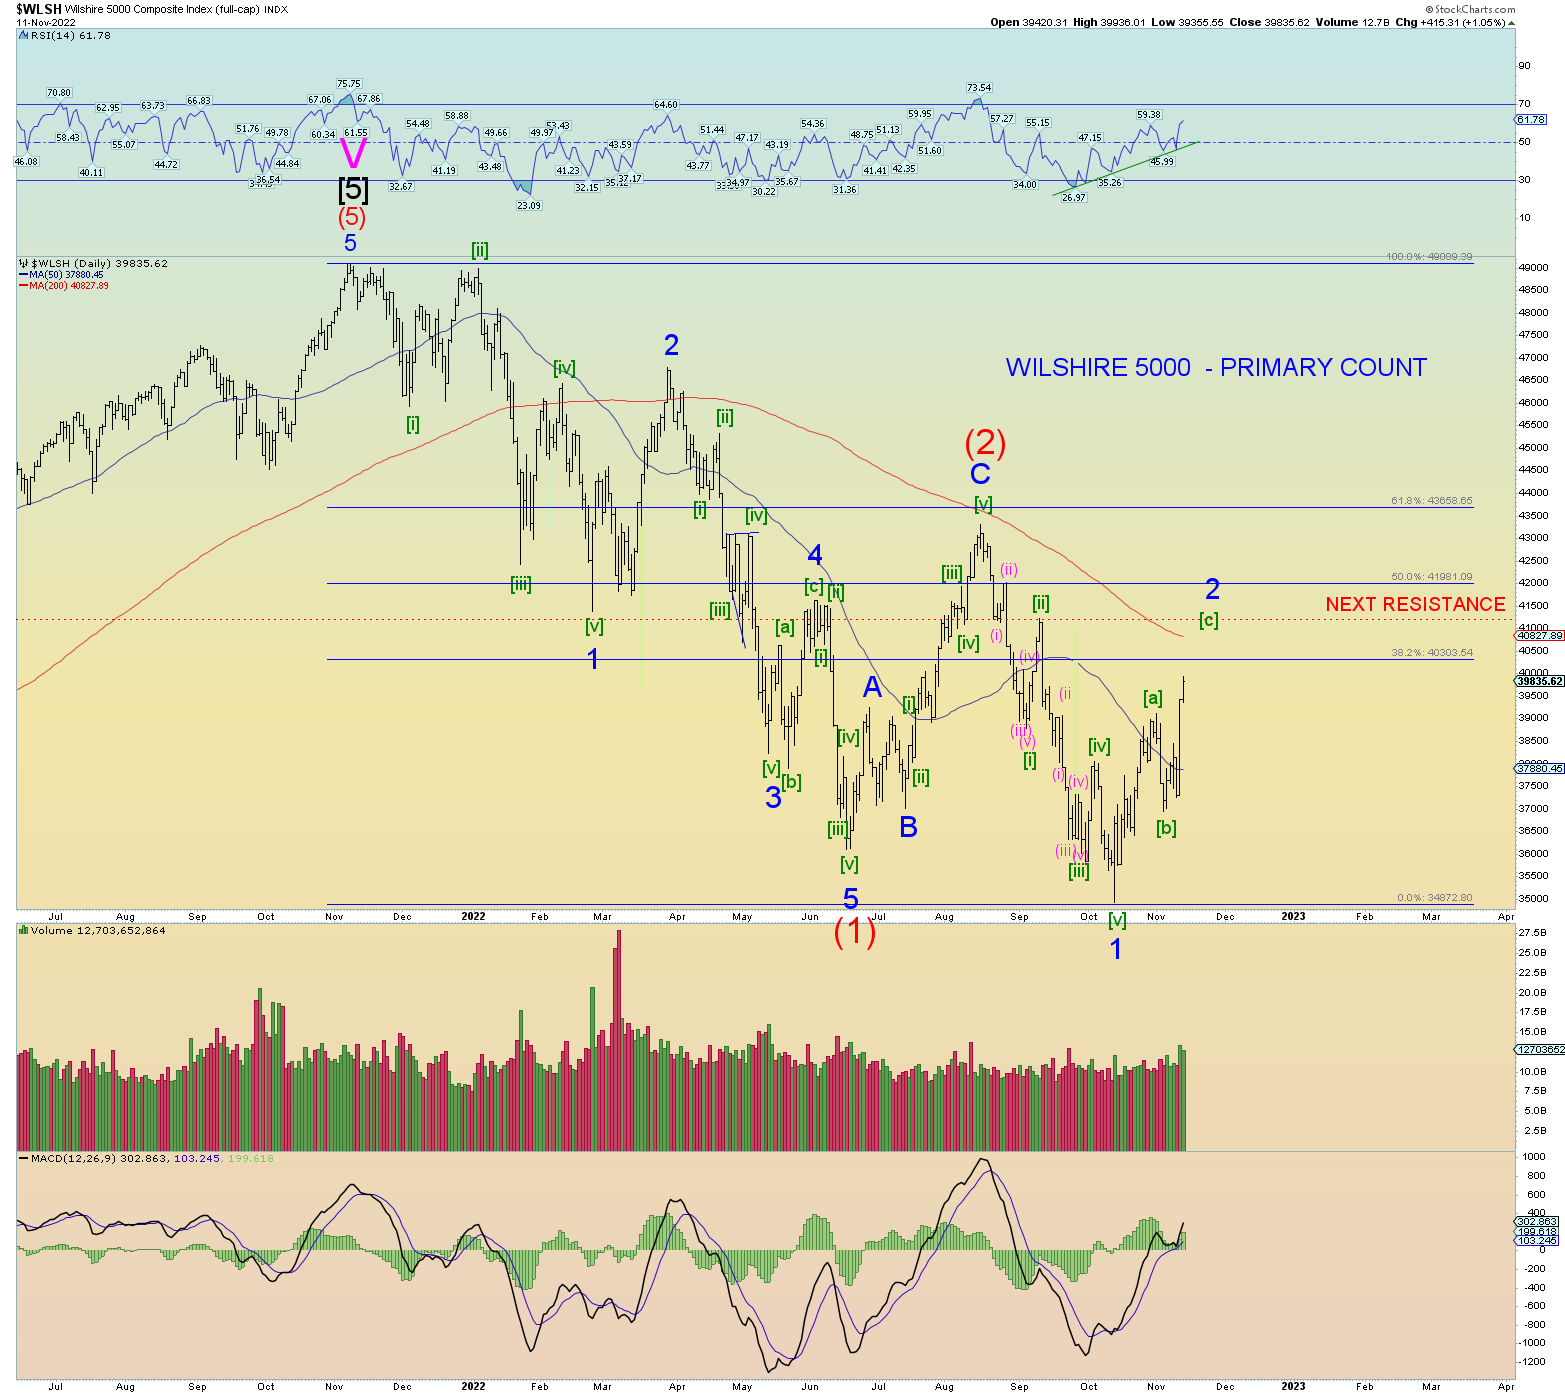
Wilshire not even at the 38.2% Fib retrace yet.
Calling a Primary wave [1] low. Backtest of the up-channel line?