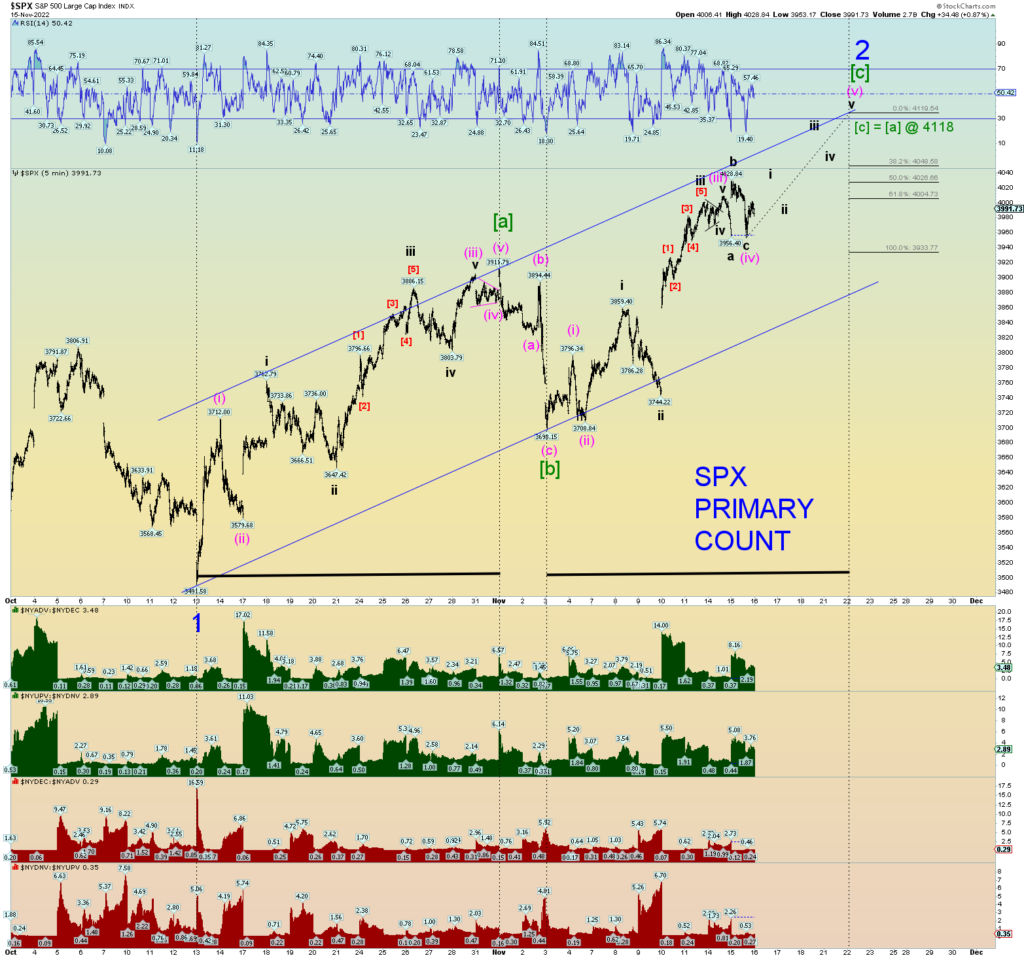
We must still assume the SPX challenges the huge open chart gap just above it. The count seems to be missing a squiggle or two.
I will say there are enough waves to consider Minor 2 over, but again, probably need to be patient a bit more.
Wave [c] would equal wave [a] in both time and price possibly Tuesday’s opening bell on the 22nd Of November. But as you can see, the entire Minor 2 wave structure can only – at least at this time, be counted on the whole as an [a]-[b]-[c] corrective wave upwards. The channeling is that of a classic 5-3-5 zigzag.
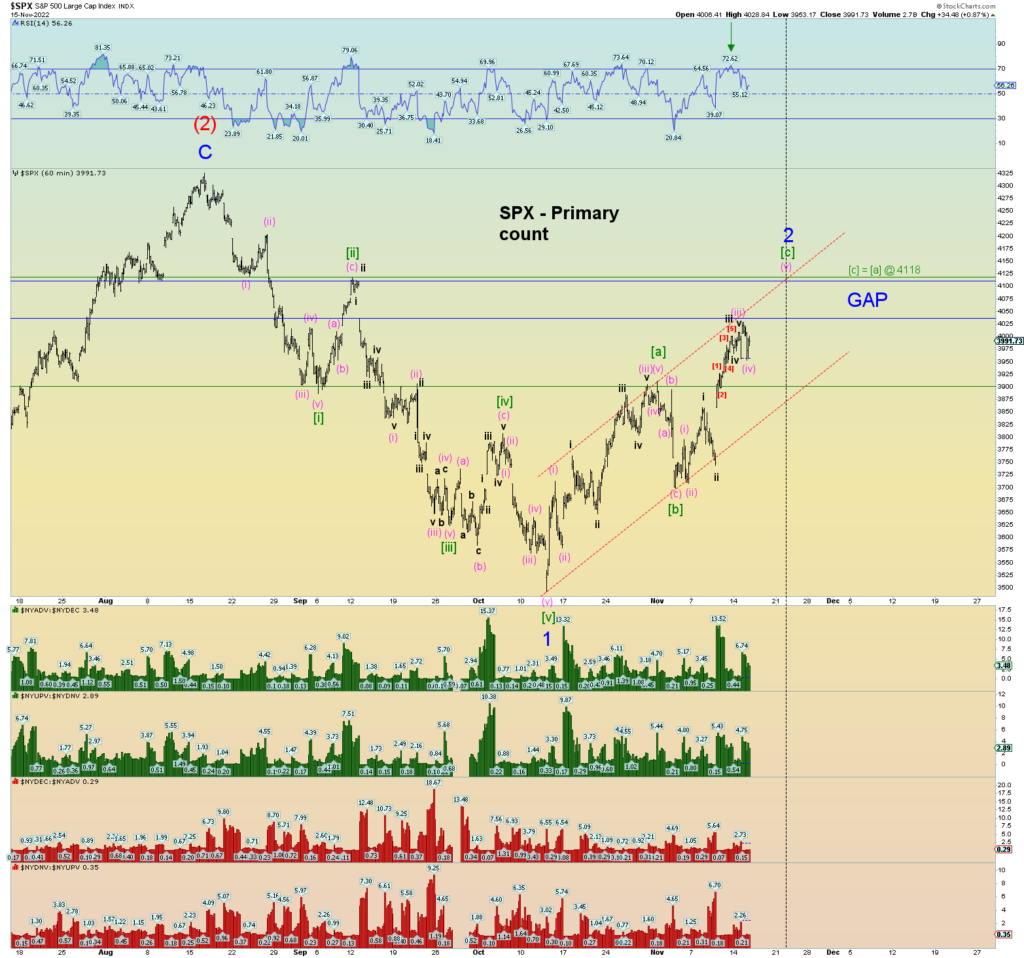
The hourly chart shows the price/time relationship if wave [c] = [a] in both. 4118 would close the open gap fully. I know this is pushing things, but I generally pushed things with the count down to a Minor 1 low back in early October and the patience proved true. A further price rise through the gap will absolutely crush any remaining bears and get retail back fully on board. Just in time of course.
Maybe we need a DOW theory non-confirmation. Keeping an eye on it. Need another wave up on the DJIA to finish [v] of C of (2).
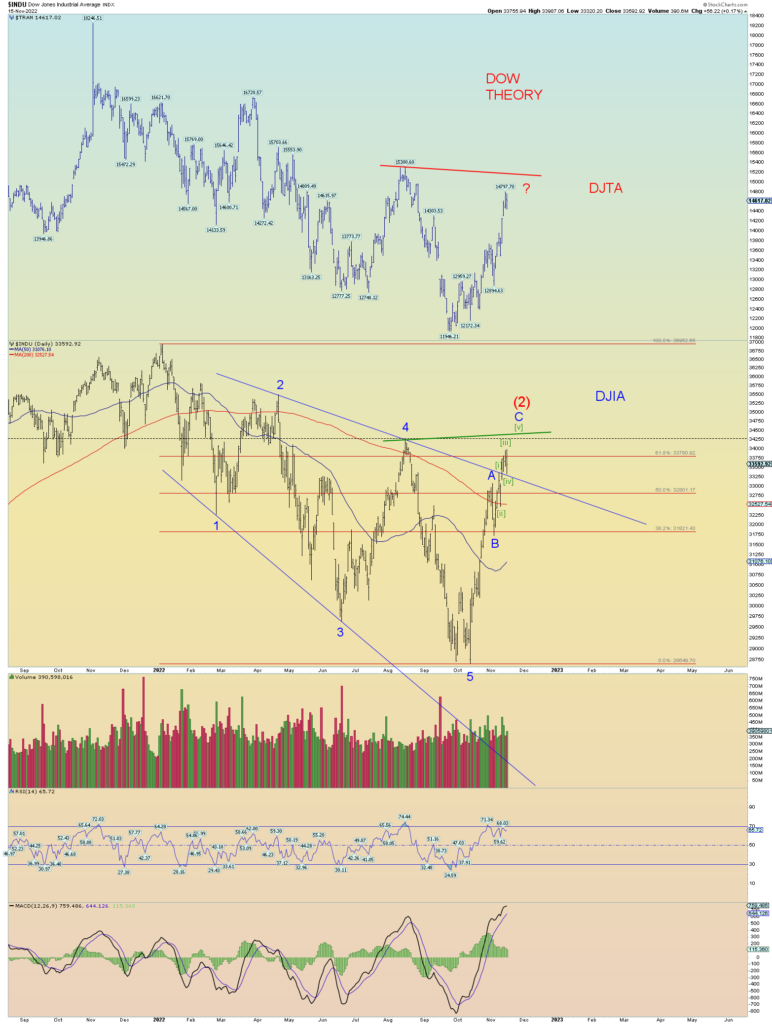
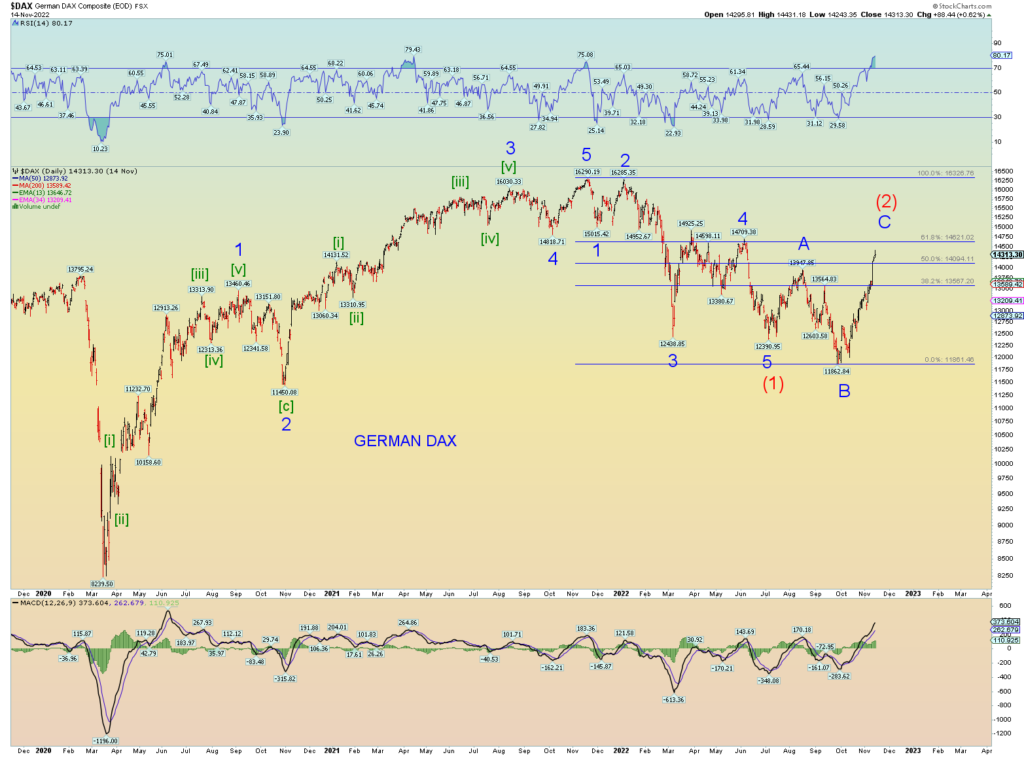
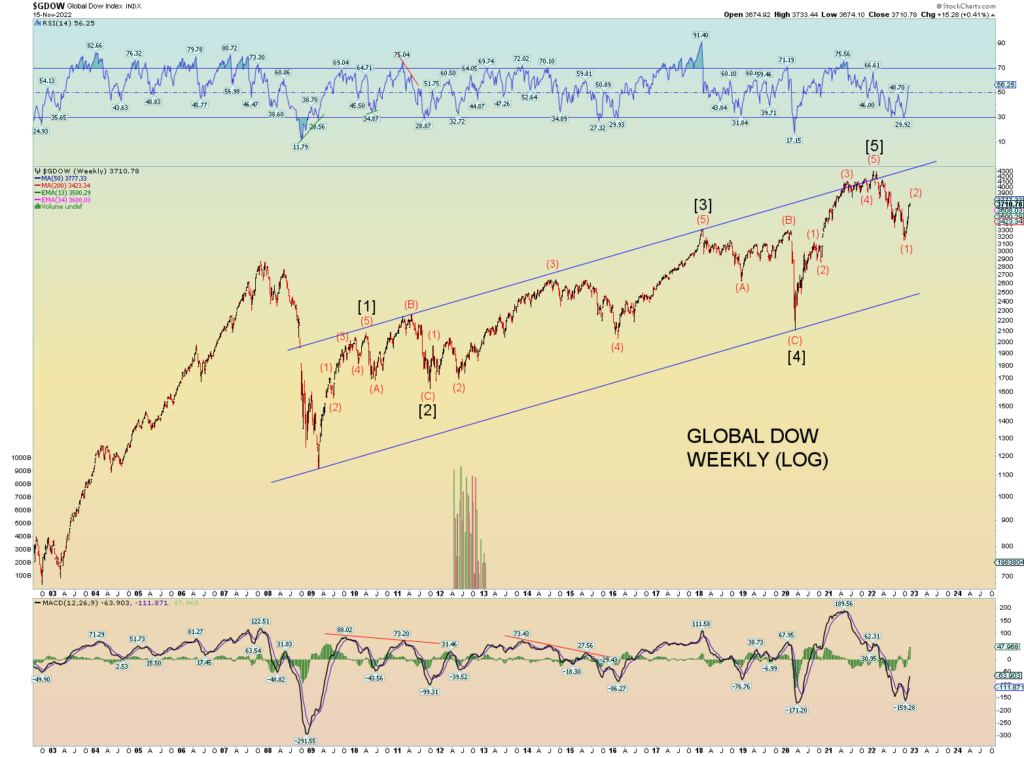
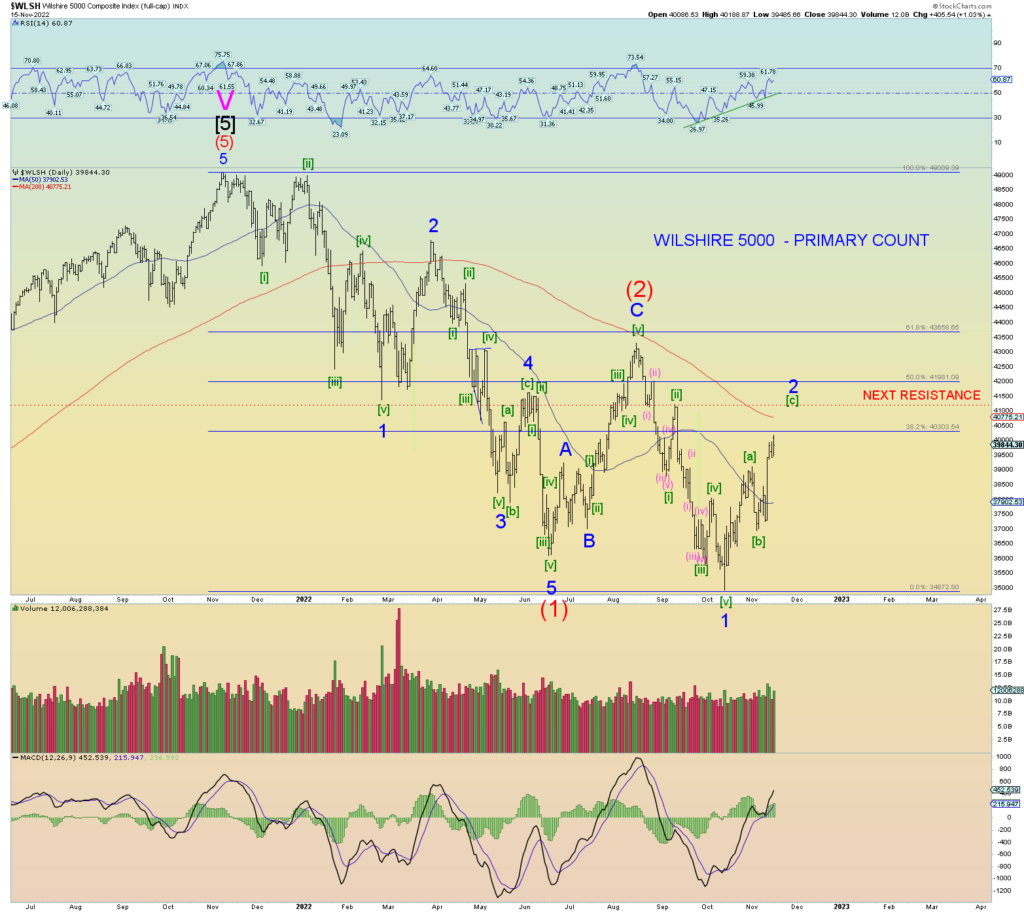
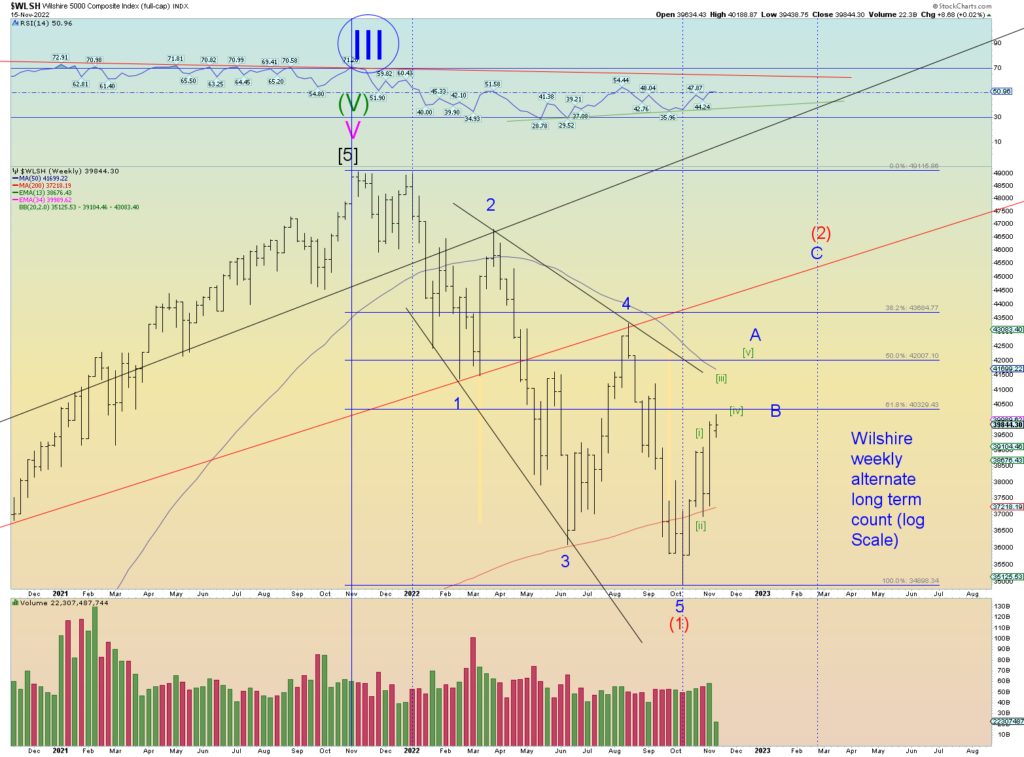
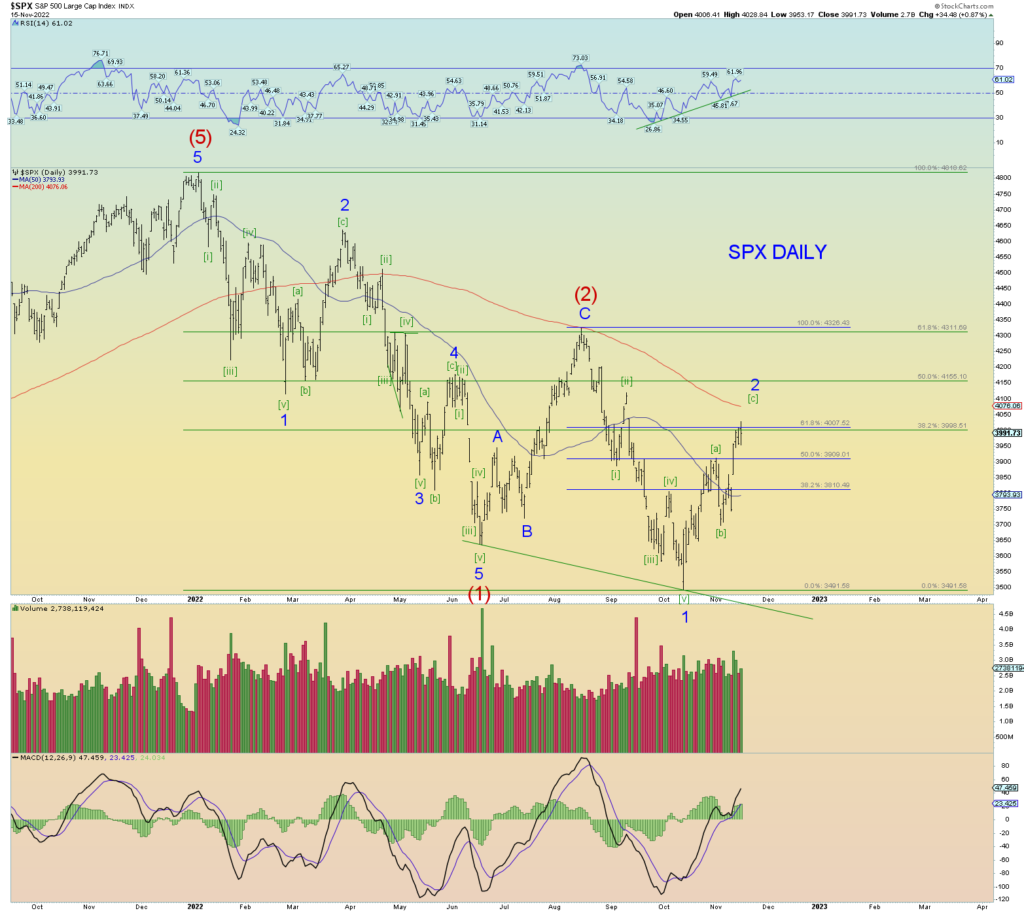
The only blip in the primary counts is that the weekly has a significant positive RSI divergence and for it to “play out” prices would go above where we have Minor 4 marked on this chart and thus making the SPX and Wilshire counts the exact count as we have the DJIA in as shown above. This implies Intermediate wave (2) would likely back test the red trendline (again) and time-wise would probably take until mid-January, minimum, 2023 or possibly longer. We have to be prepared for this possibility.
But first things first. The S&P hasn’t even broken into its open chart gap down yet.
Again, the size of the waves are huge yes?
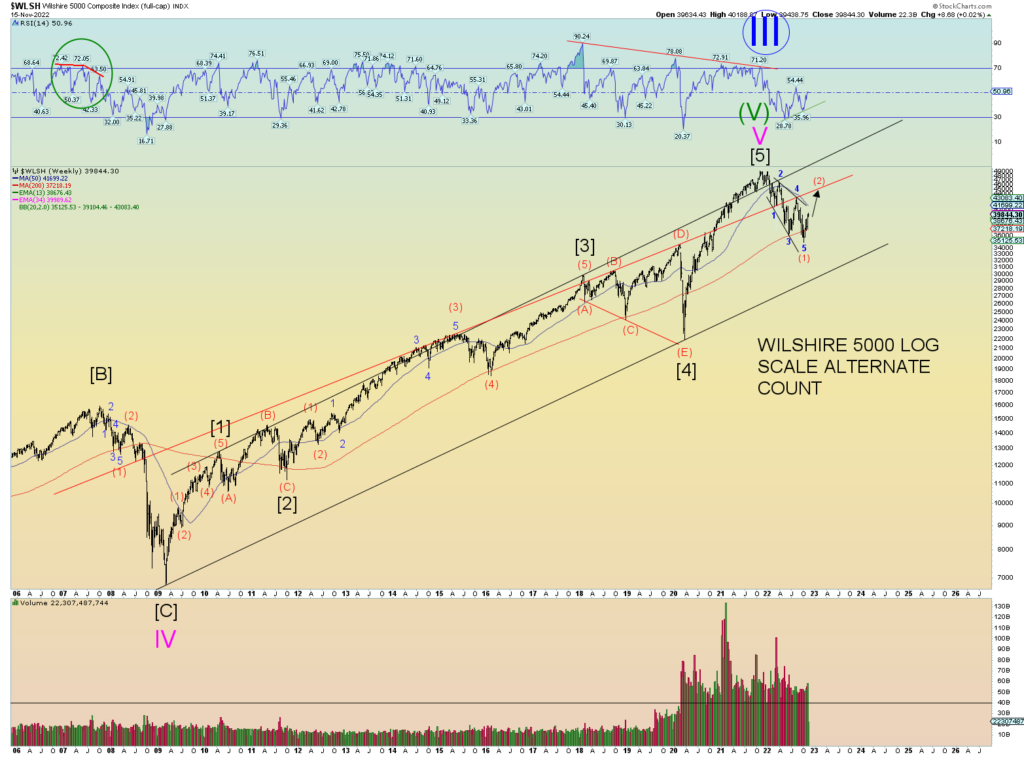
Here is that same chart literally zoomed in. If the weekly positive RSI divergence was to fully develop, that implies prices are going above where Minor 4 is marked just as the DJIA is close to doing breaking above its previous pivot high. And that would take some time I suppose although it sure didn’t take much time for the DOW.
Anyways, this technical aspect of weekly positive divergence has been on my mind, and this would be the likely result if it played out fully.
The entire structure is a “classis” opening move leading expanding diagonal triangle, and it is hard to ignore. The overlapping deep retraced waves along with expanding megaphone shape is a huge structure. And if it pans out to be accurate in that it is a wave (1) – or even just wave (A) of something else down, the wave (3) or wave (C) will be a spectacular downfall.
We would just have to patiently wait for it though.
What would spark this “news-wise”? What would be the market’s excuse? I suppose a temporary cease-fire deal in the Ukraine war where 2 weary armies sit things out for the winter.
