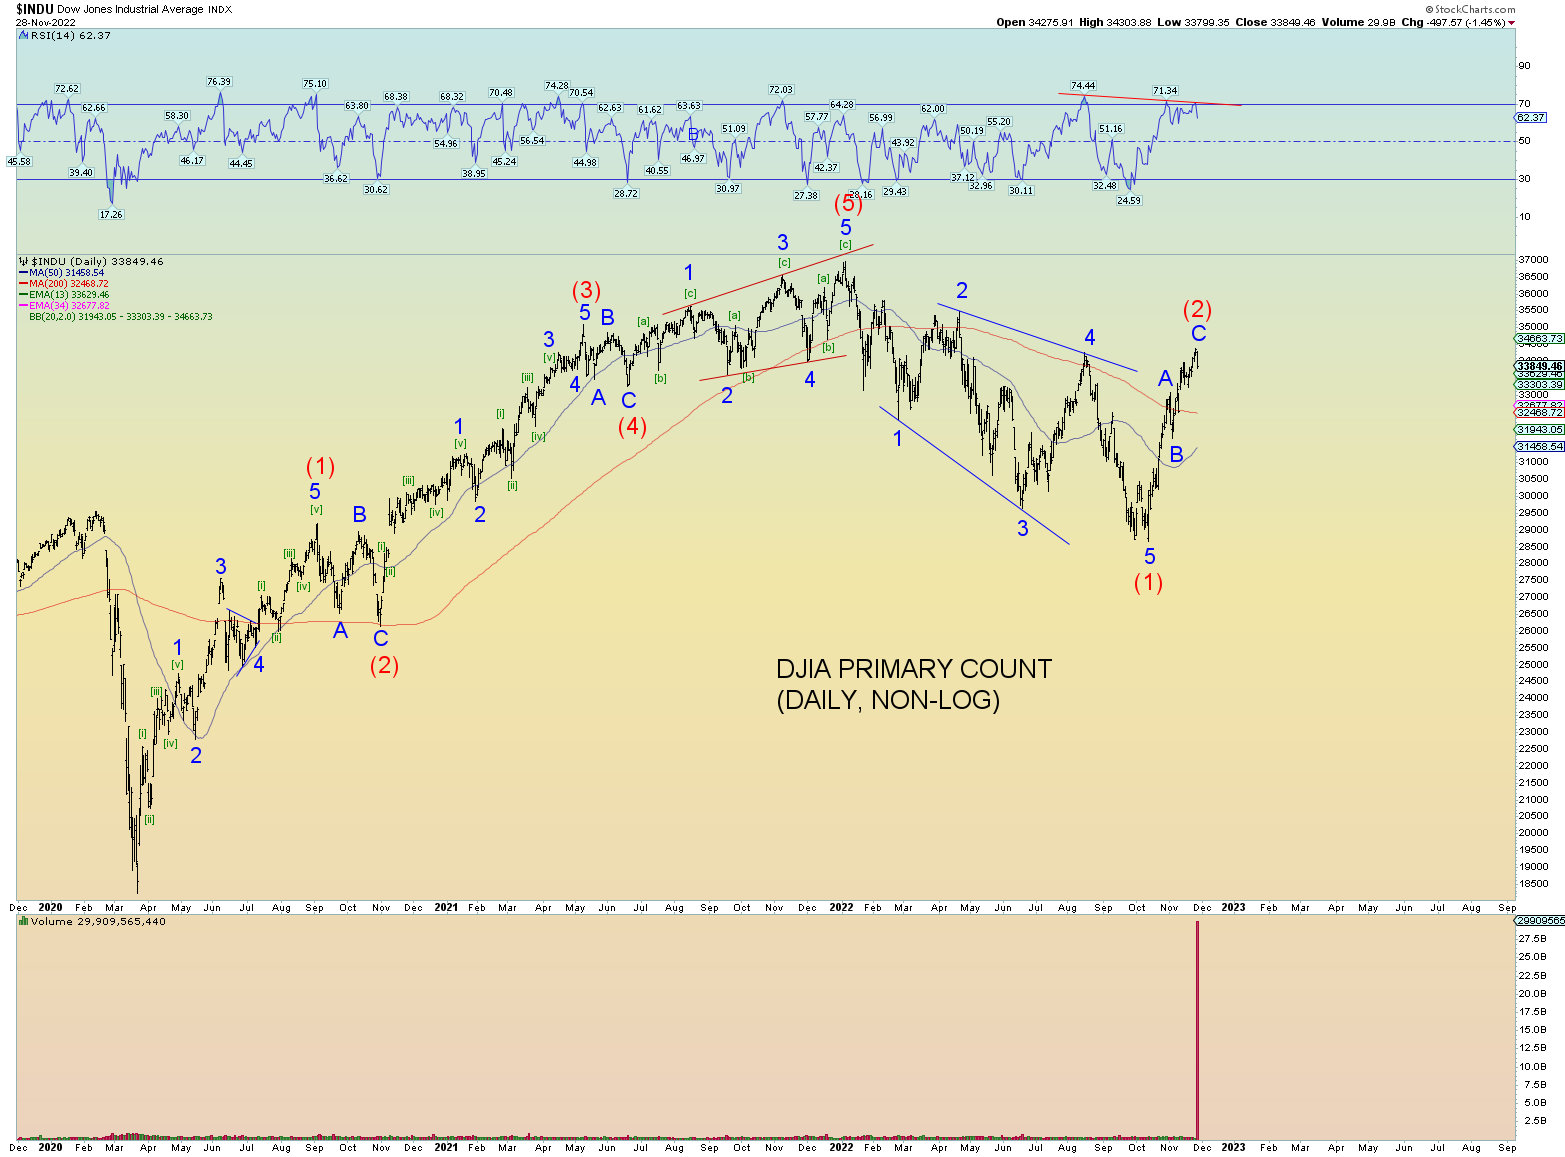
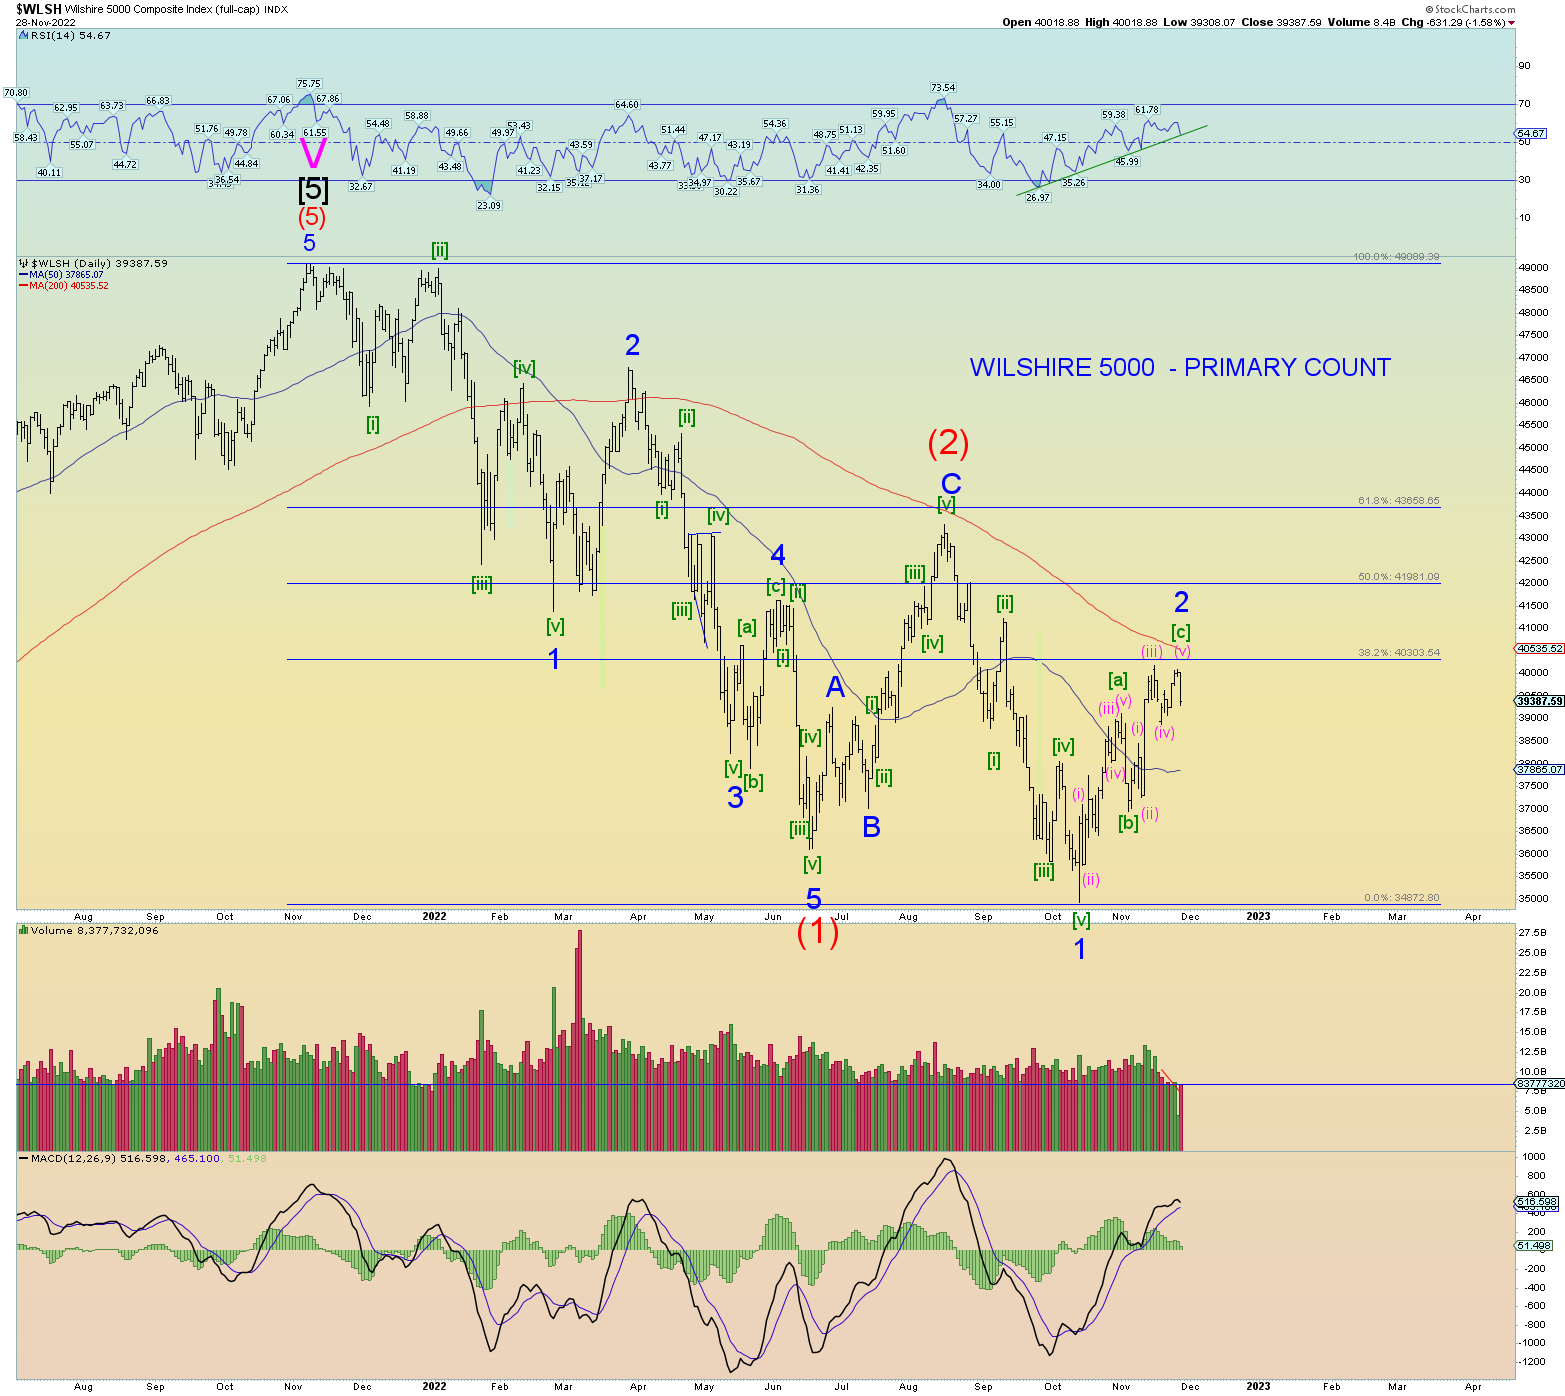
On the Wilshire daily (and SPX) you can see a classic 5-3-5 [a]-[b]-[c] zigzag (or even a double zigzag) for Minor 2 up. Just seems a classic corrective pattern which implies sooner or later, the big wave (3) down will commence.
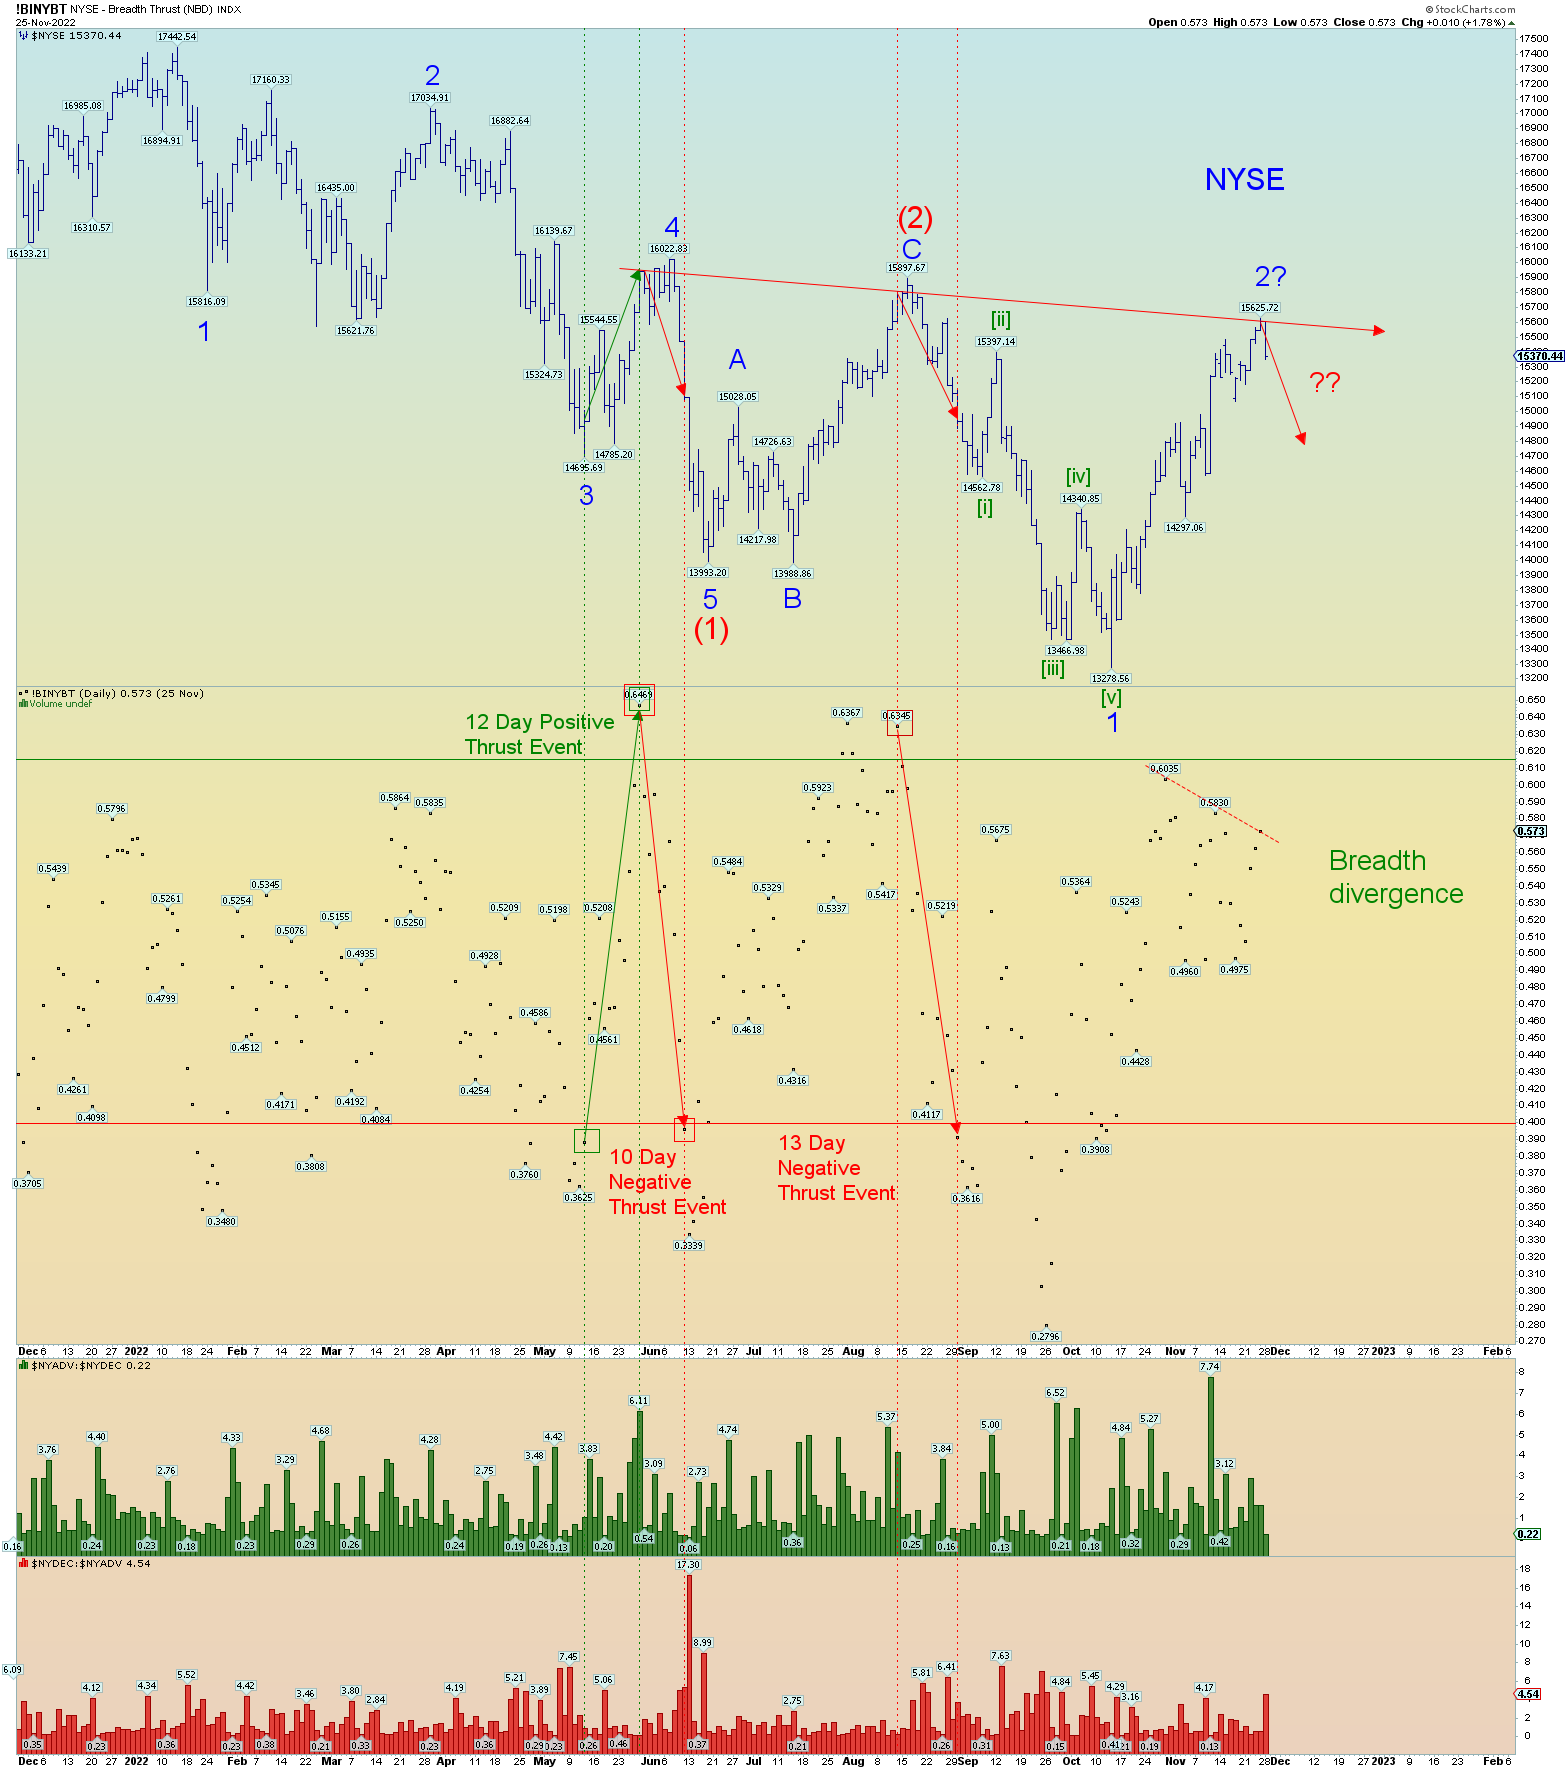
Prices have again reached the point on the NYSE where a bad negative thrust event should occur.