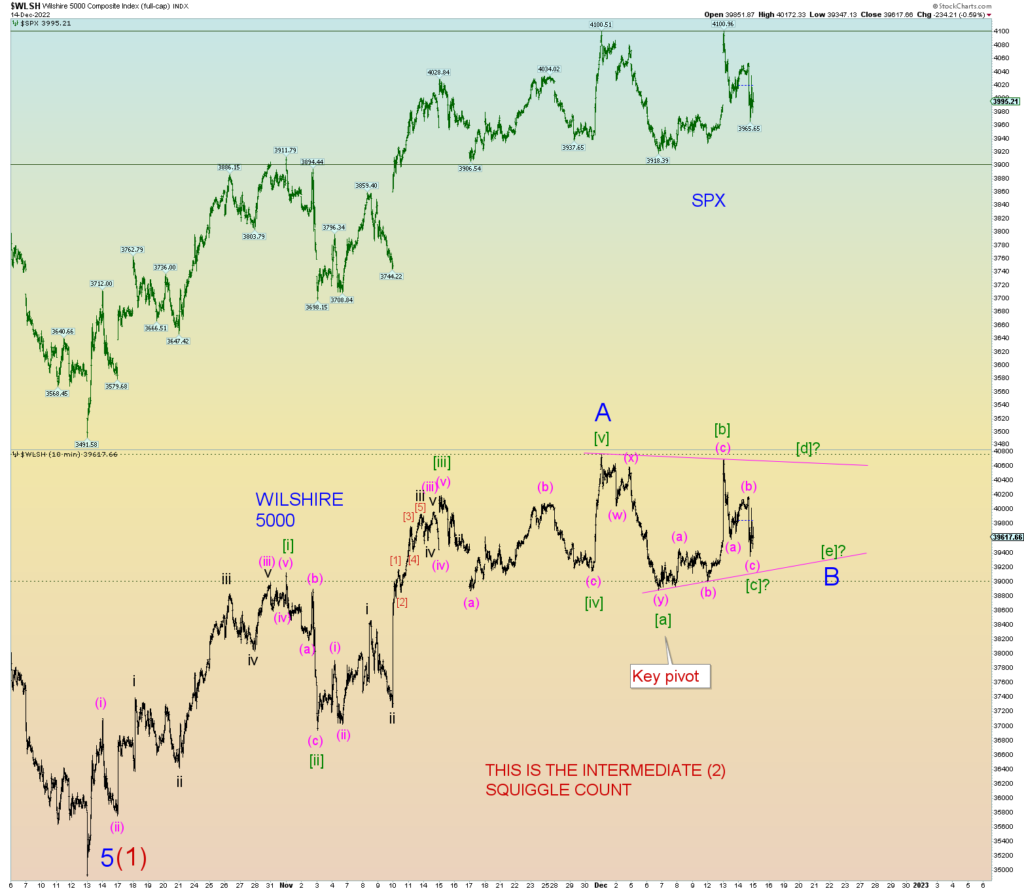
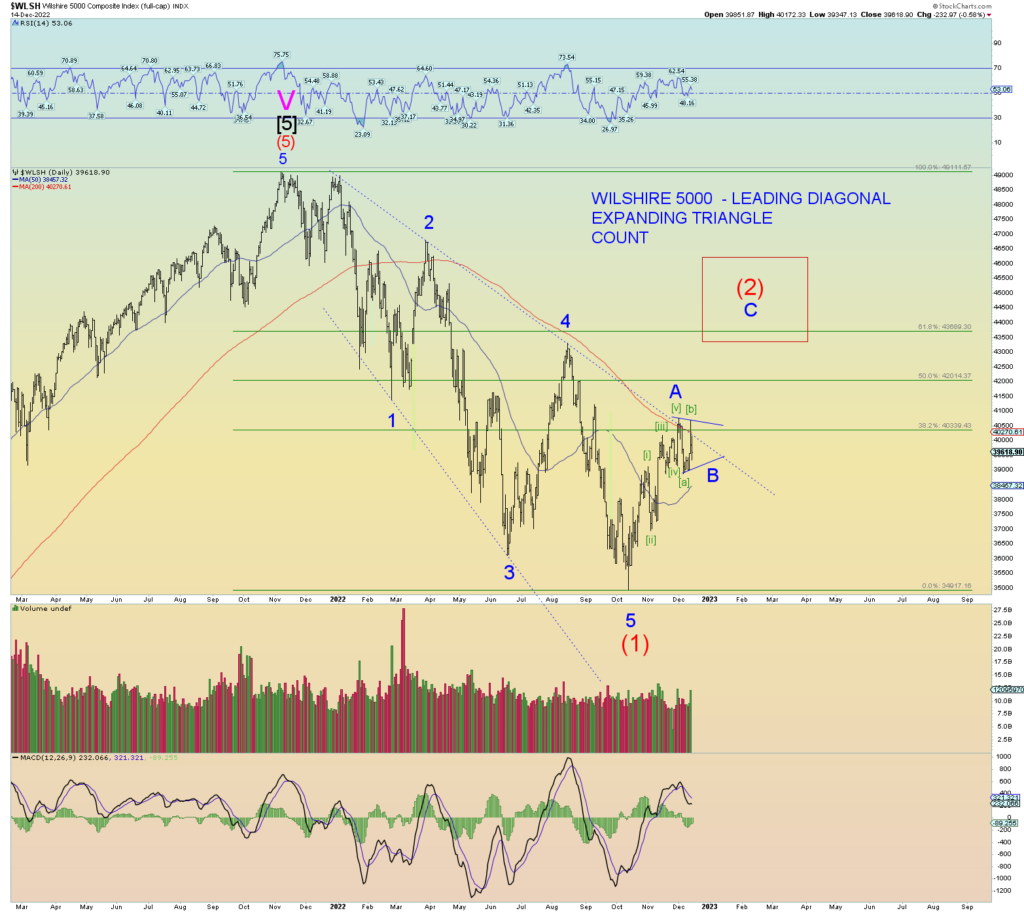
Rather than show all the same Minor 2 of (3) primary count charts again, today let’s take a different approach and work out the bullish count of an Intermediate wave (2) on the SPX and Wilshire. We have already determined that the DOW Industrials is wave (2) just by sheer size and amount of retrace. We can also consider the Global DOW in wave (2). See last night’s charts.
Today’s price action, although seemingly bearish, doesn’t yet count very bearish in actual wave counts. Yesterday’s opening spike to a 4100 SPX peak (and also on the Wilshire) does not count as an impulse up. It actually looks like a “three” wave count. Therefore, we might assume another poke, at the very least above 4100 high is coming.
Ever since prices burst forth higher on the opening of November 10th, thereby creating a 110-point massive open chart gap on the SPX, prices have held between support of 3900 and resistance of 4100. So, in one sense, price action has been constructive and “chewing” through selling in an effort to consolidate in this range and eventually breakout higher.
If that breakout higher were to come, then Intermediate (2) is the count indeed for the SPX and Wilshire. The market is going into a very low volume holiday period which probably favors the bulls more so than the bears.
The market cannot afford to lose much ground here from a bullish case. Any price that falls below SPX 3900 is in quick danger of filling the massive open chart gap. Think of it this way: Where do you think all the “stops” reside in the market? A break under 3900 may in fact create a selling cascade situation and a powerful downdraft would occur trapping any and all remaining bulls and causing an outright selling panic. And this is exactly how a wave 3 of (3) down is supposed to behave.
So, I am not quite ready to throw the towel in on the most bearish count of Minor 2 of (3) high, but prices need to turn down soon for it to be a reality.

