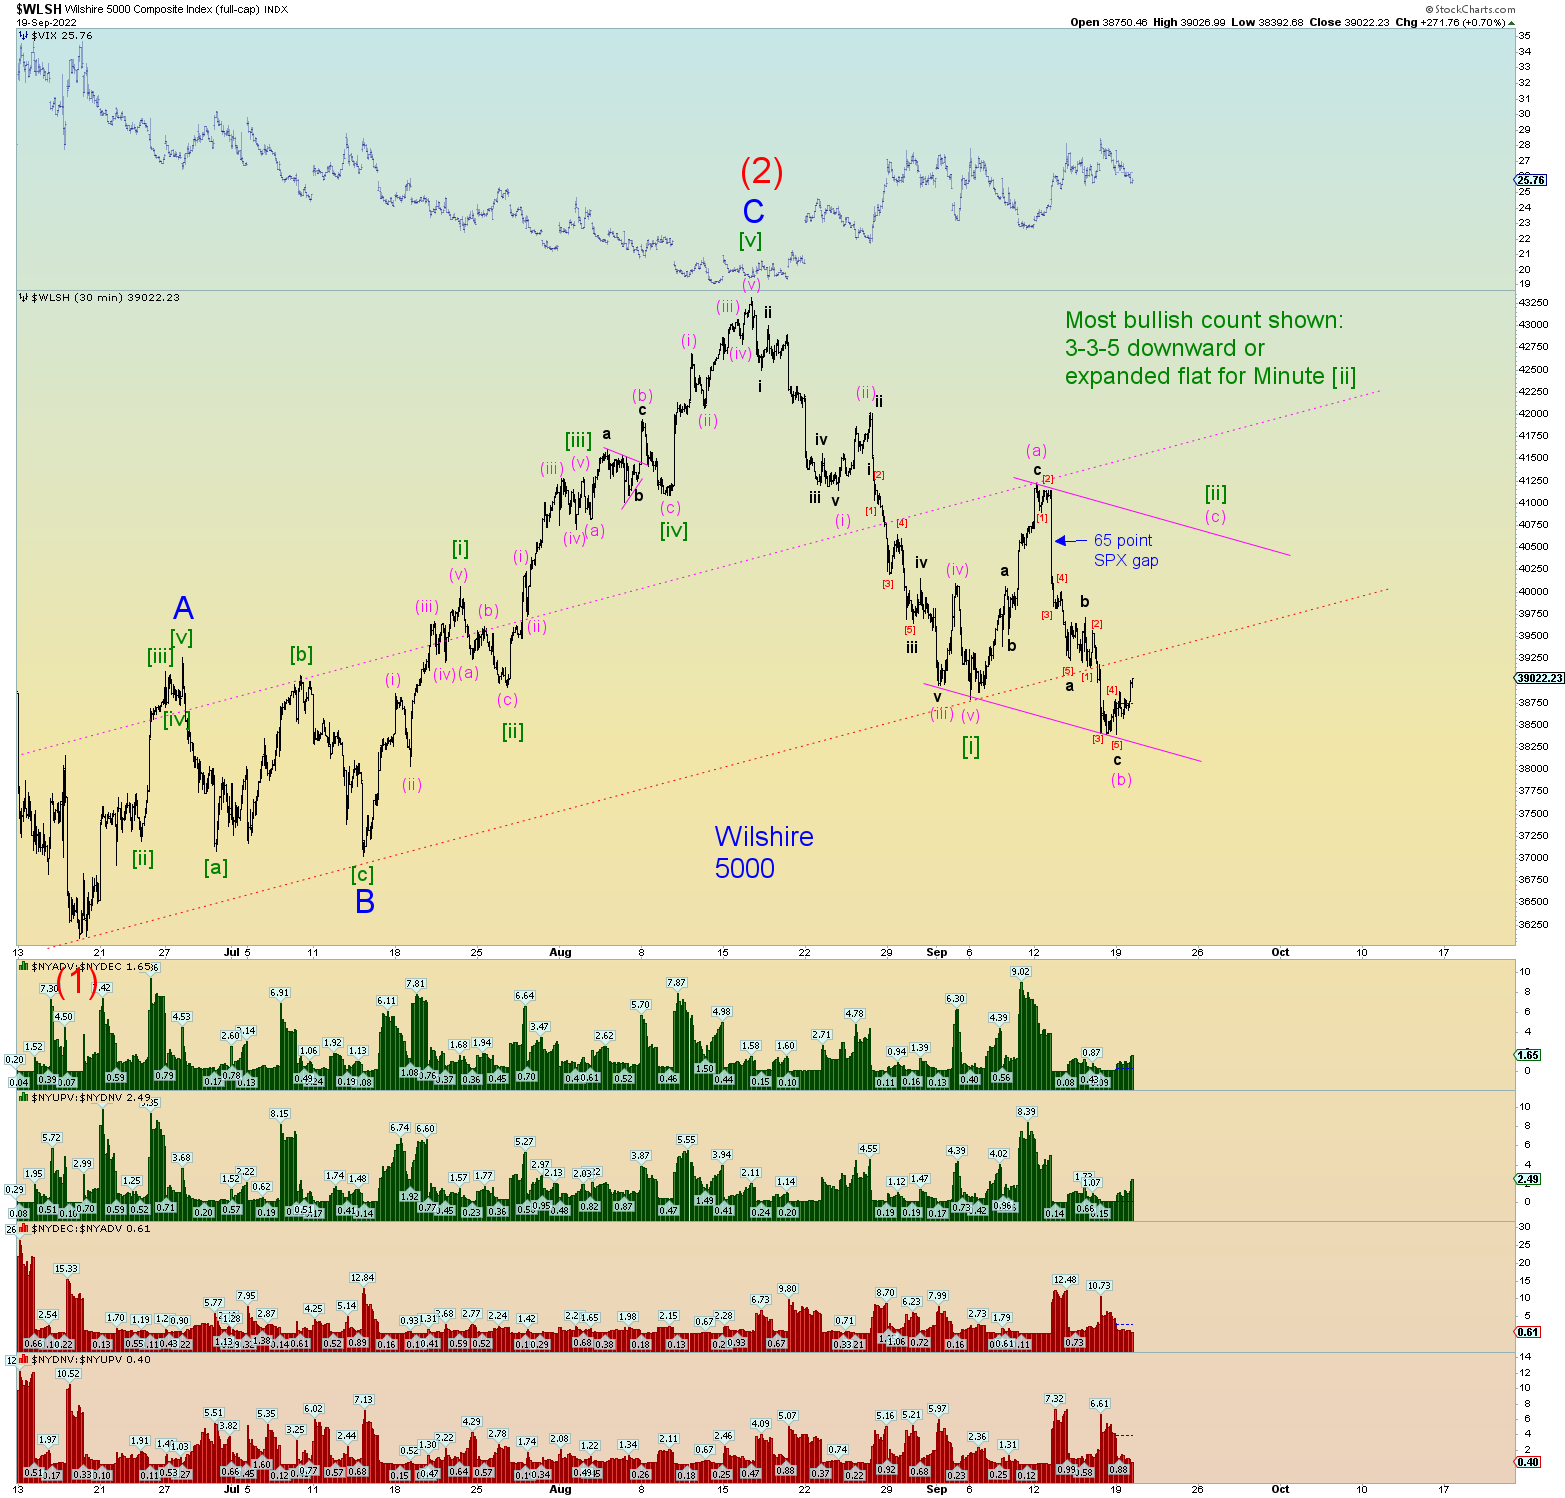
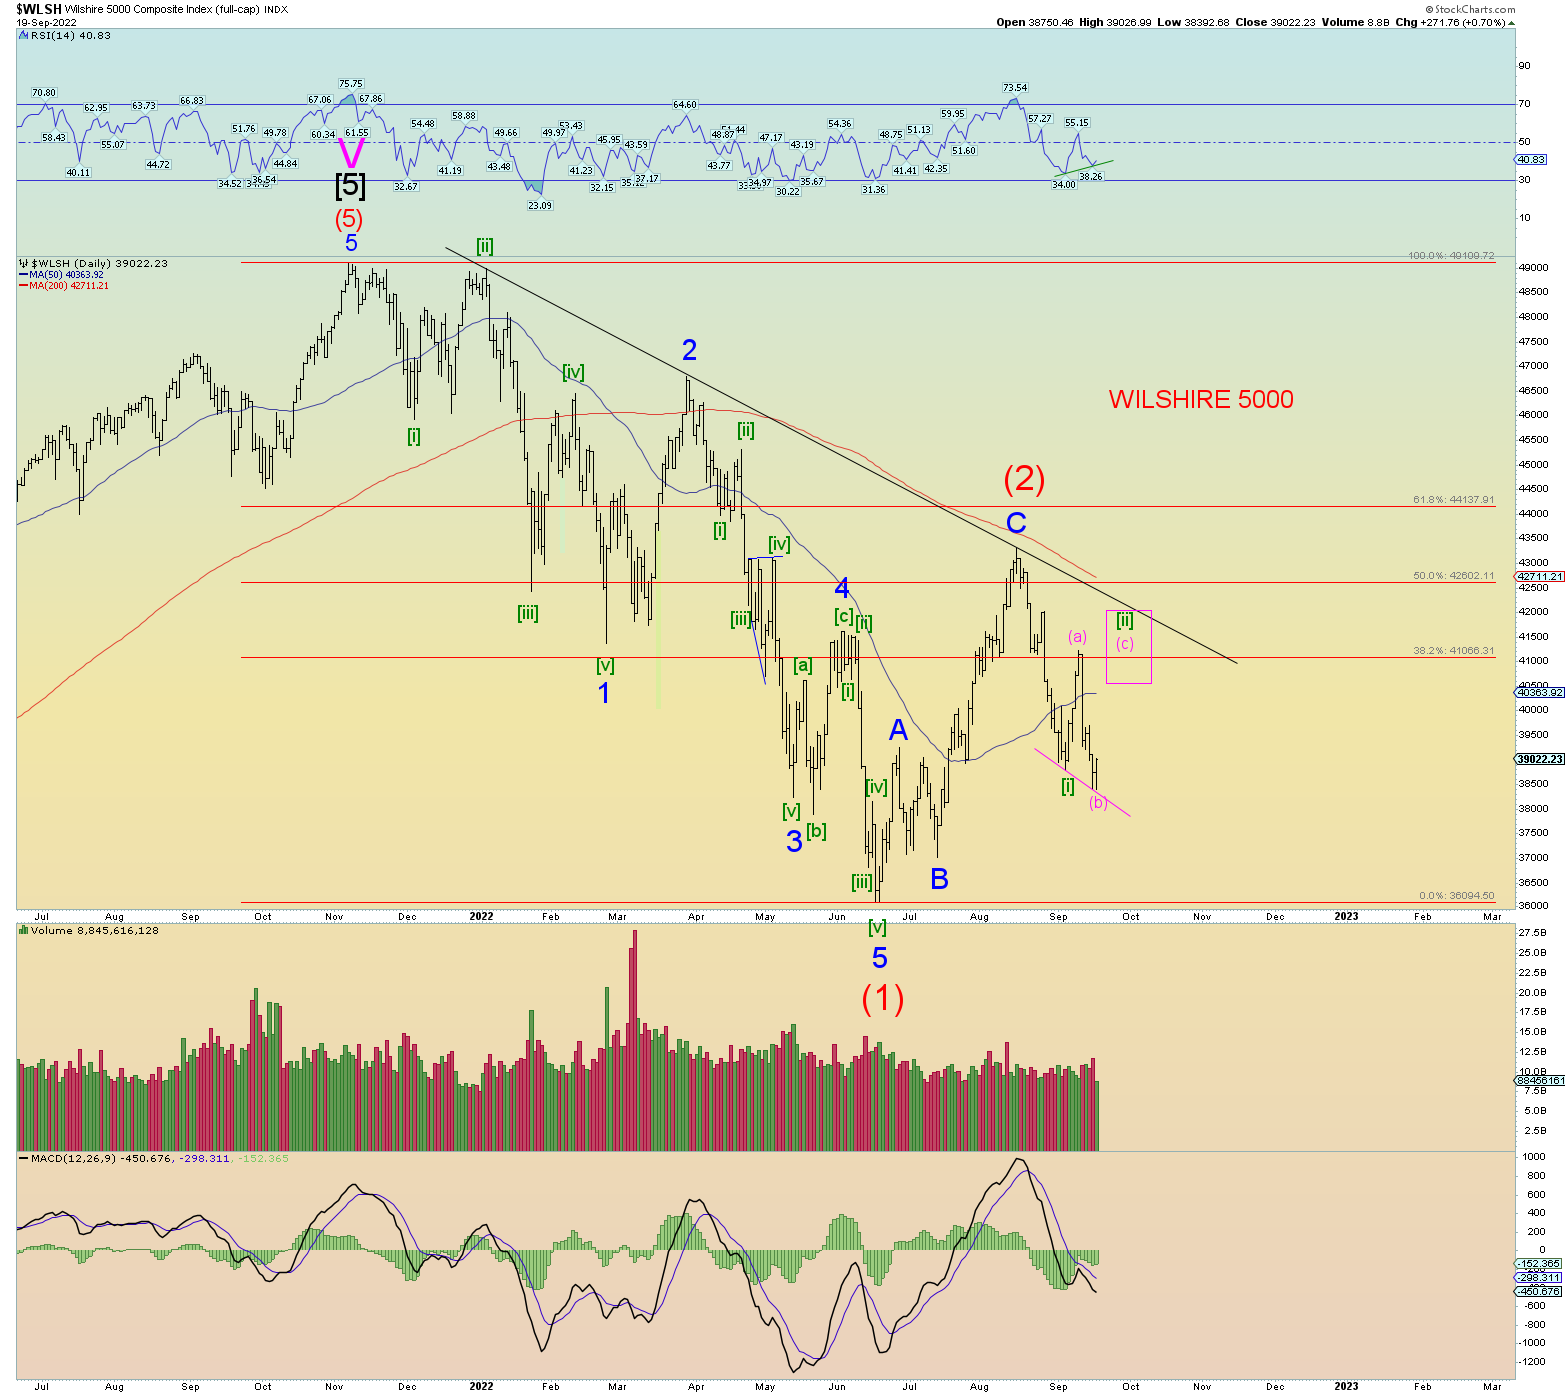
There is wave evidence the market may bounce yet again from here to somewhere in or above the huge 65-point SPX open chart gap down forming either a downward Minute [ii] 3-3-5 flat or expanded flat if prices go above (a) of [ii].
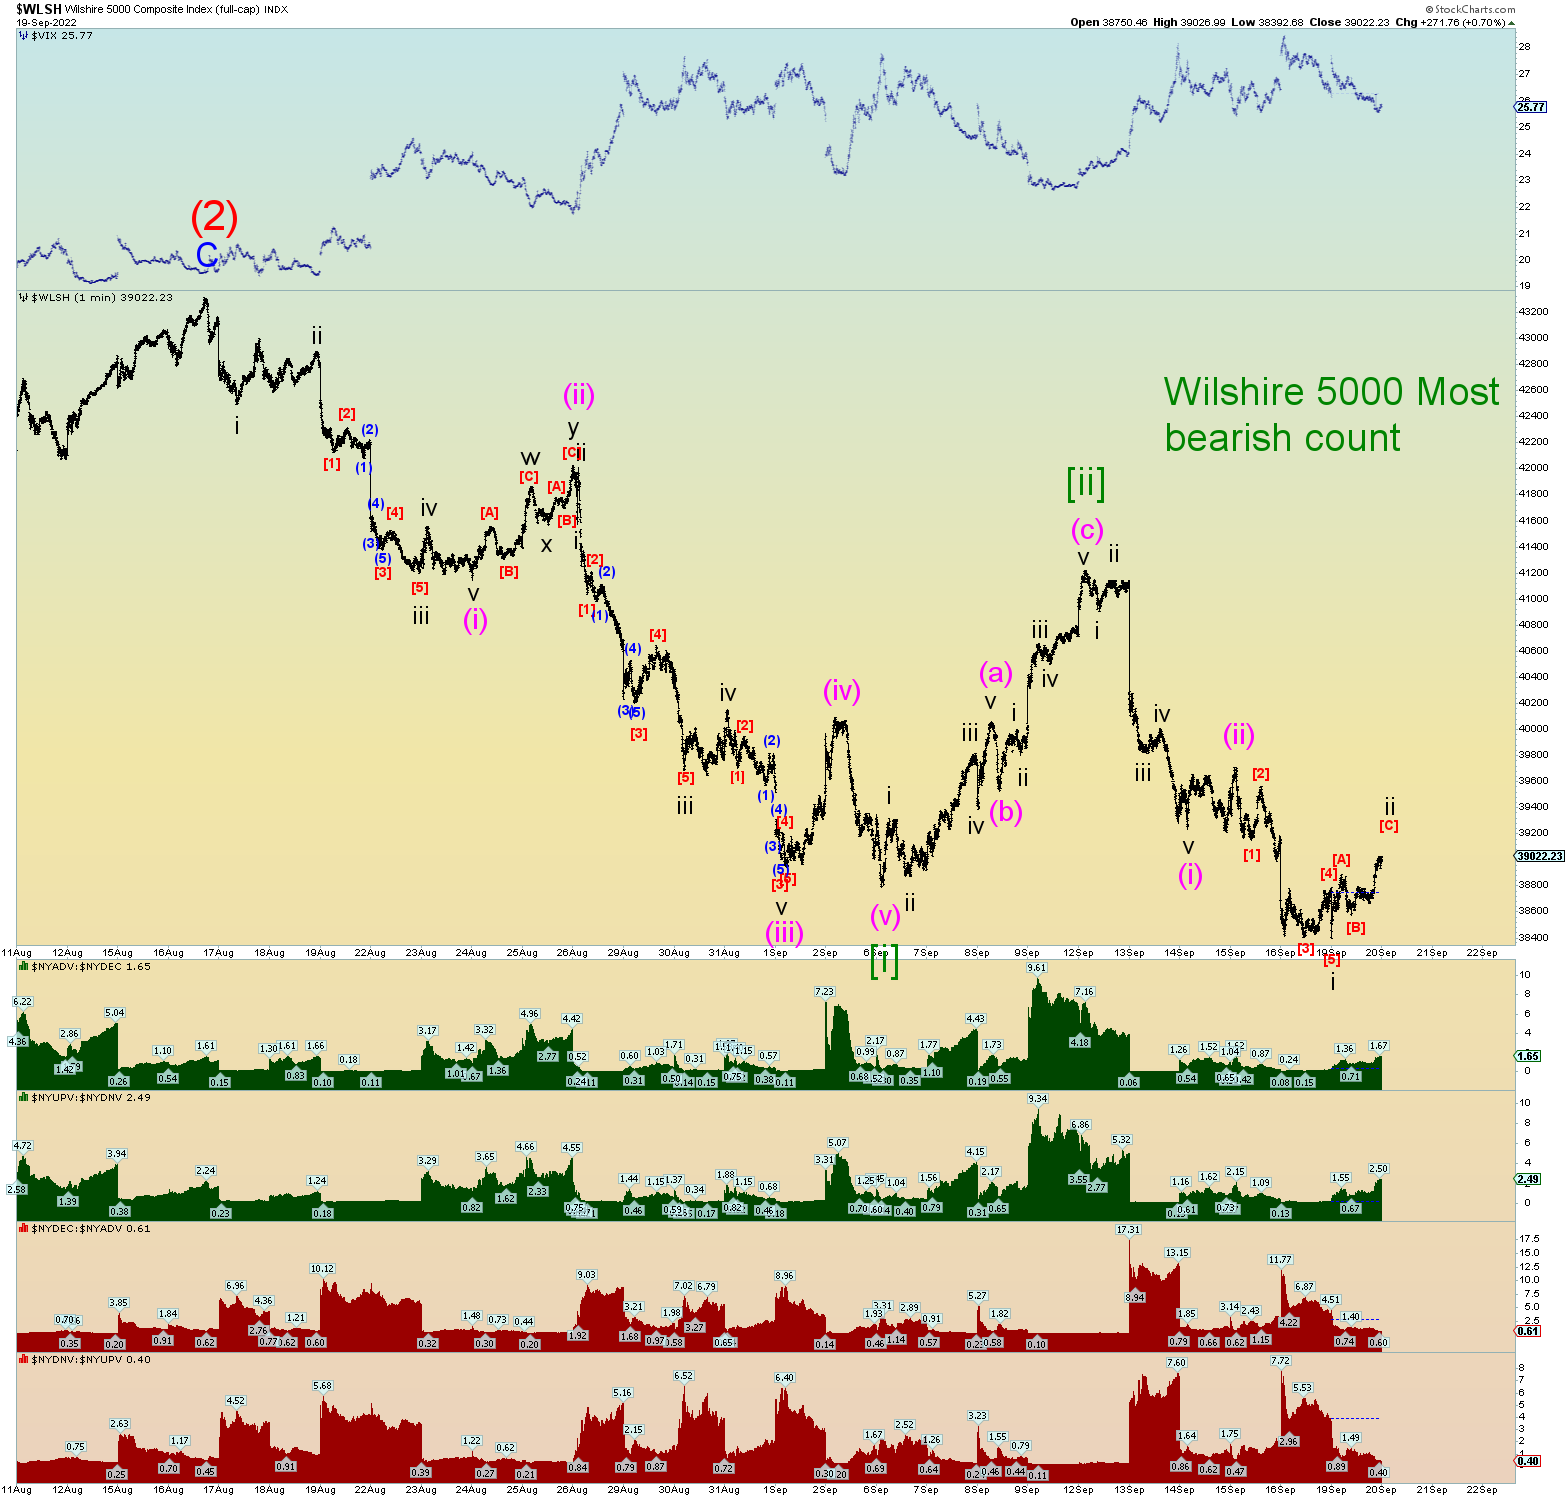
So, the primary count is that Minute [ii] is forming some form of “flat” count.
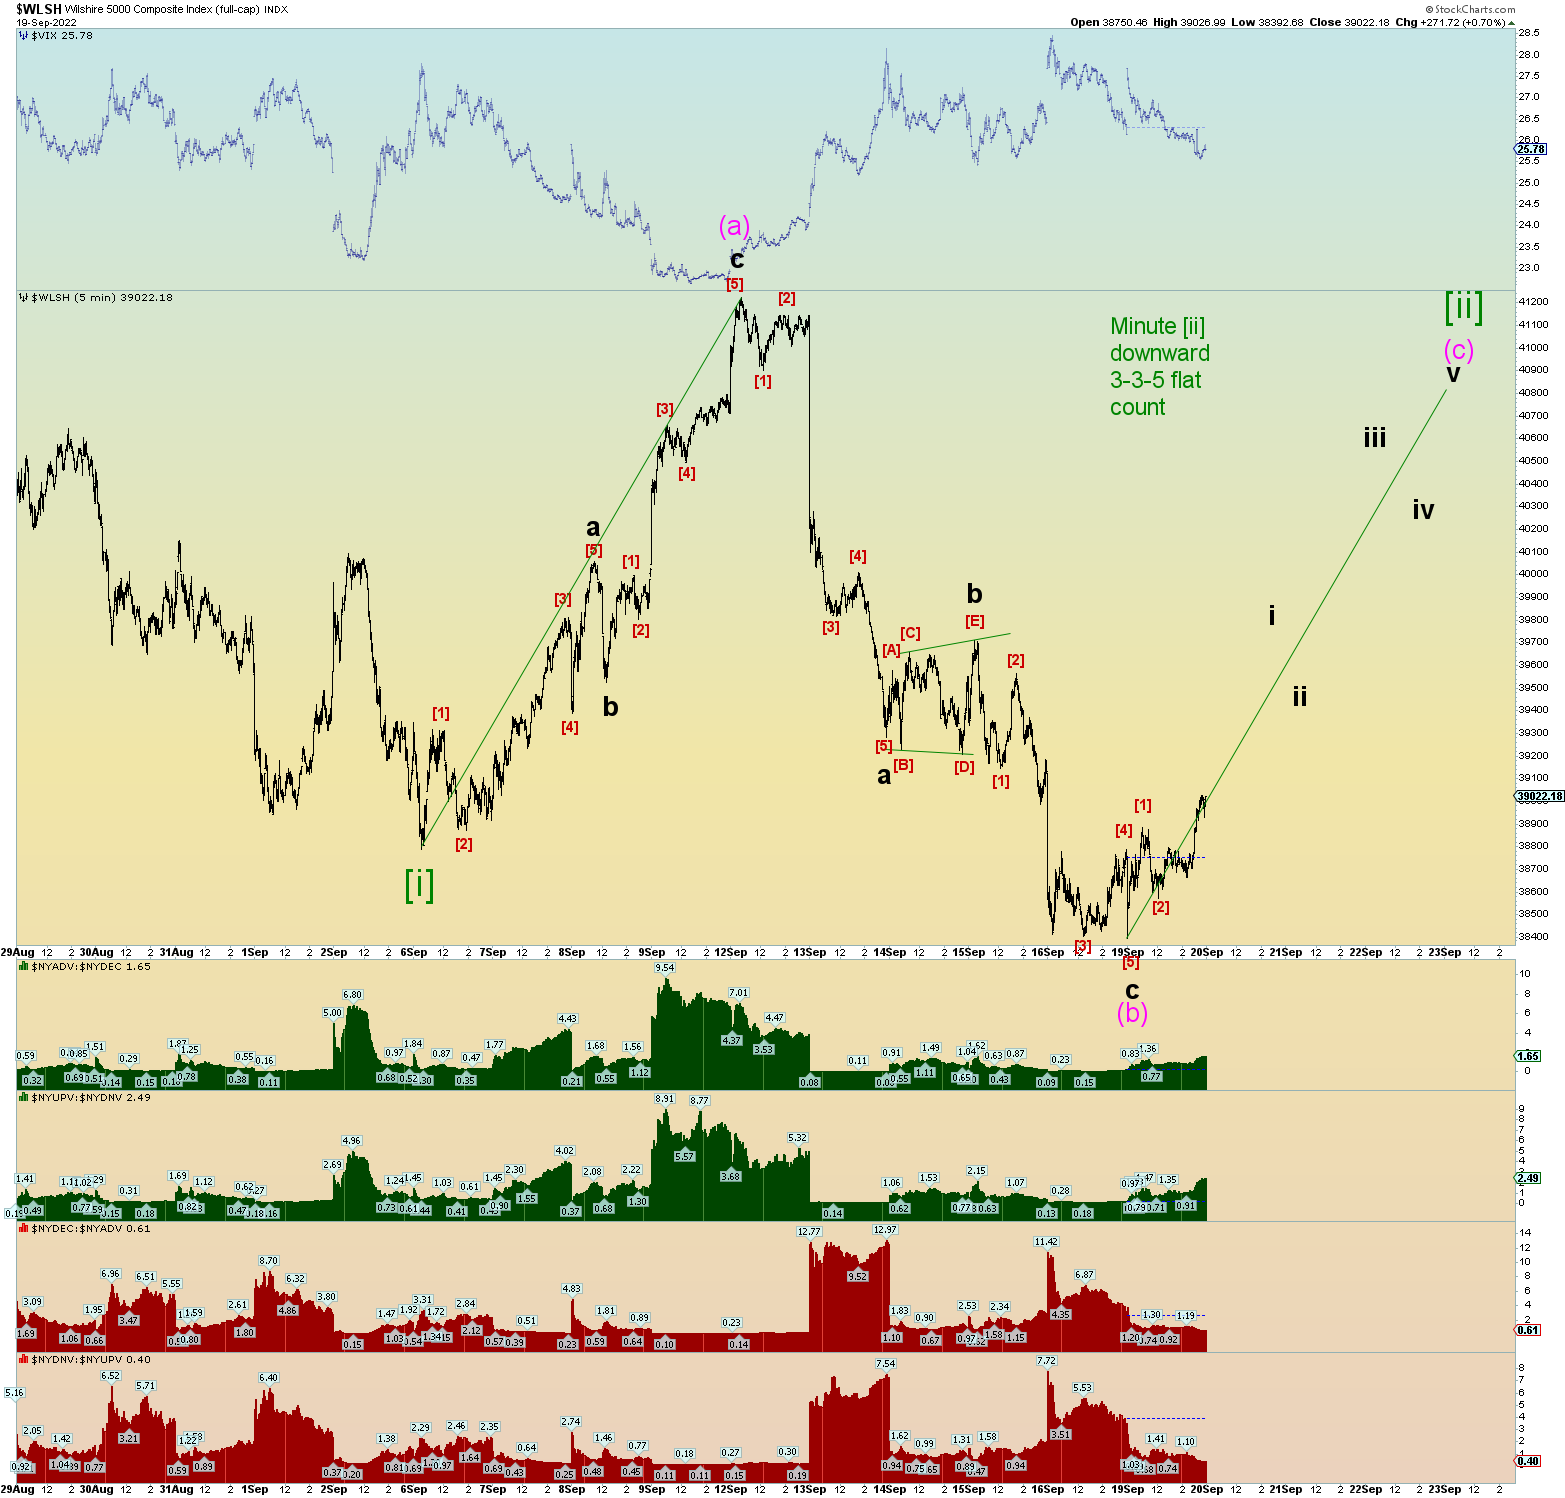
A closer look at the wave structure and we have 3 waves up to (a) and objectively, only 3 waves down to (b). To finish off this count, we should get a 5-wave impulse structure to form wave (c).
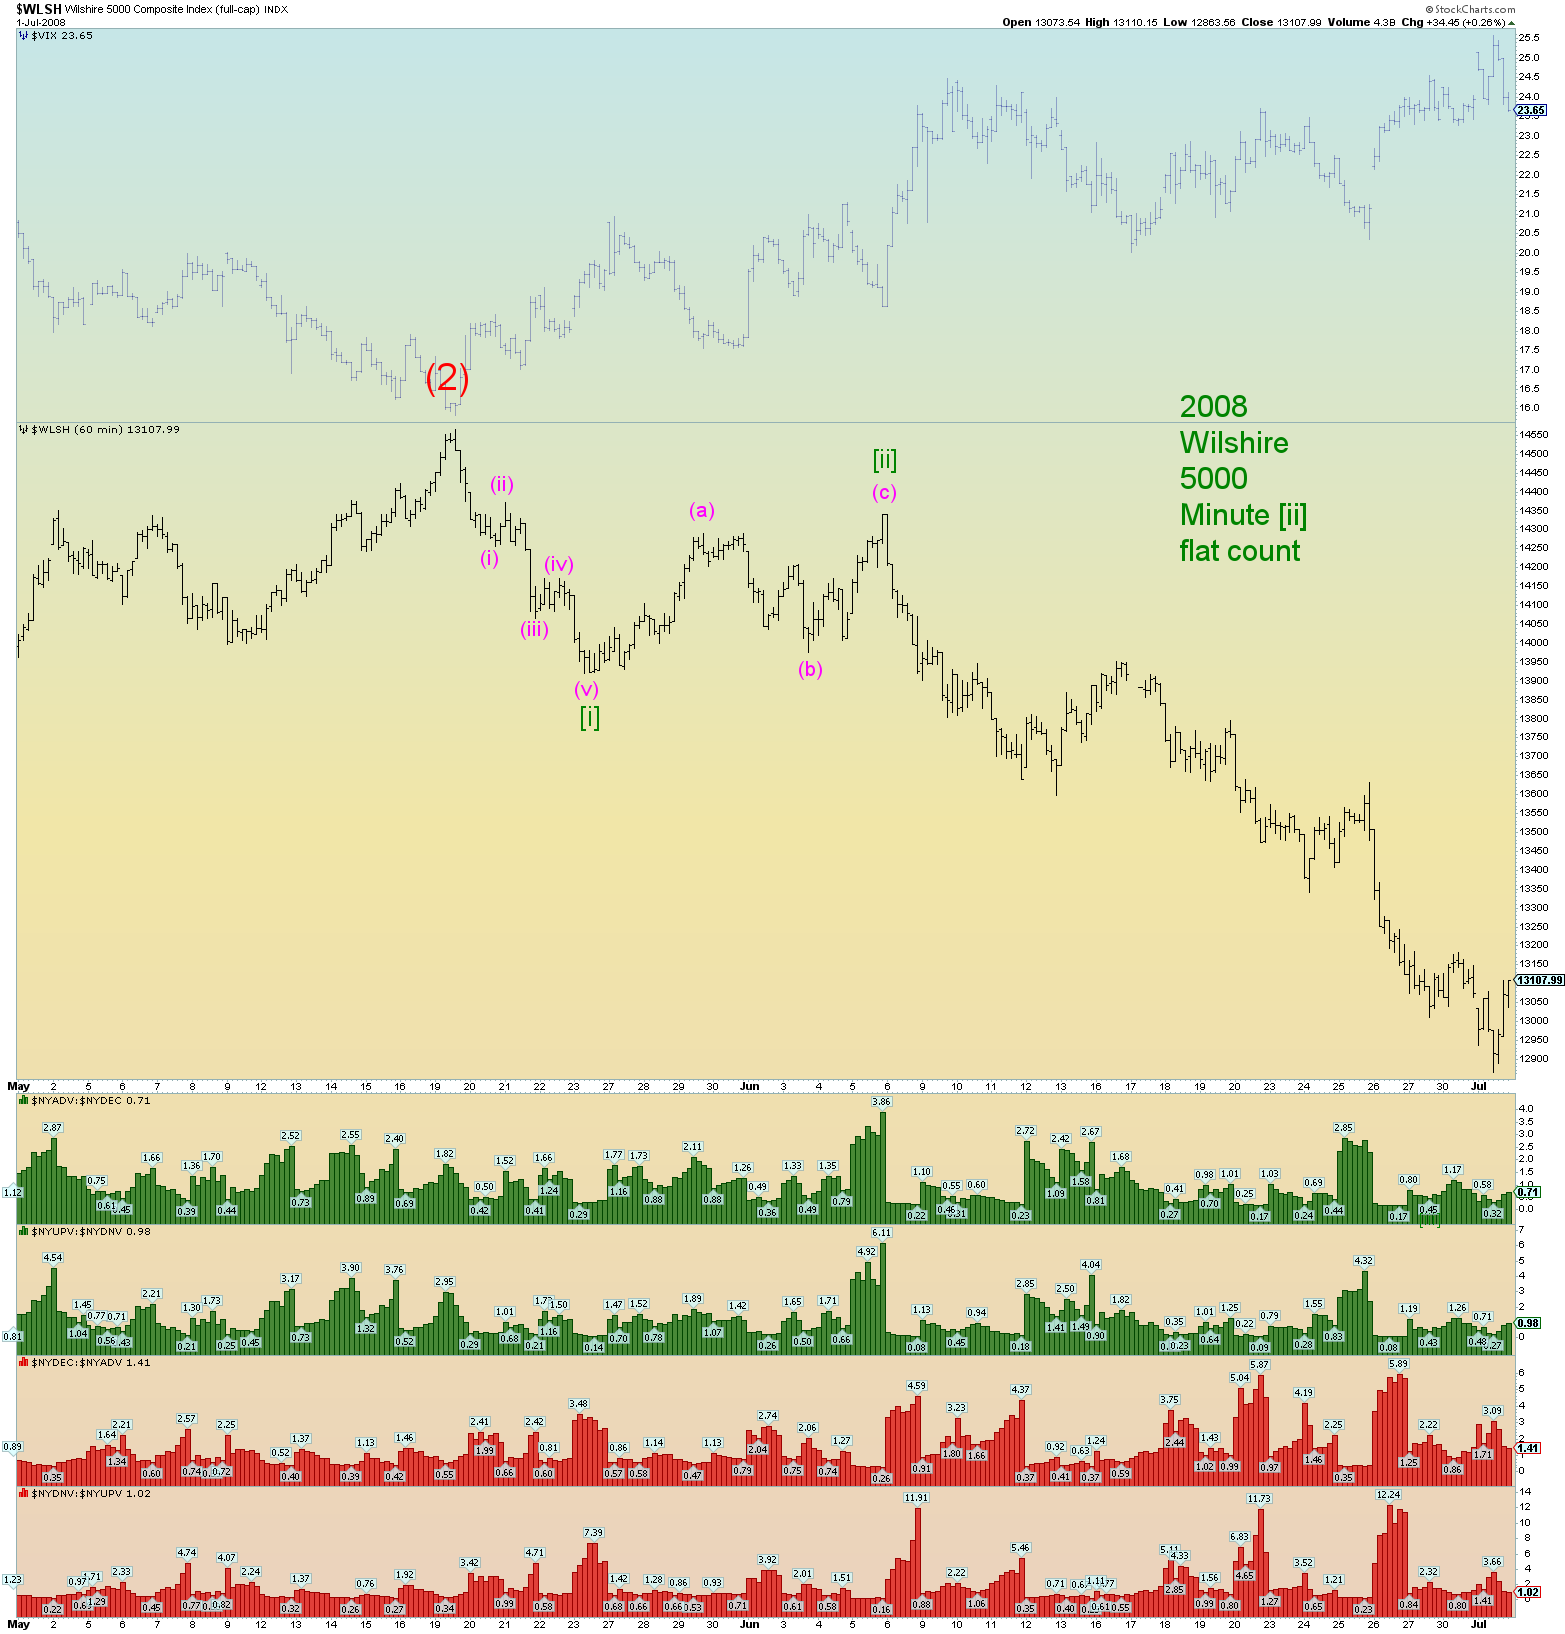
We have wave structure evidence from 2008 in which Minute [ii] of 1 of (3) formed a flat count before falling over and heading to new market lows forming wave 1 of (3) down. The difference between 2008 and 2022 is that 2008 was about one half the percentage price drops (and bounces). 2022 is much more extreme. Minute [i] of 1 of (3) is 10% drop in 2022 vs. about a 4.5% drop in 2008.
The most bearish count is shown below. This implies the market will drop hard probably starting tomorrow. Consider this the alt count. Again, overnight futures will be telling perhaps.
The SPX did fail to close above the lost support of 3900 barely today and that may be viewed as bearish by traders and algorithms. We’ll see. Last 2 days could have been a “head fake” lower prior to taking the market up to close that huge SPX open chart gap down.
Better it be closed now or never.
The daily chart does show positive divergence on the RSI which even suggests prices will go above wave (a) and form a proper expanded flat count versus a downward flat.
Yeah, I know, another 5-7% market move up in the opposite direction? Yet another violent shake out of bears and a chase-the-market retailers and the too-soon overly bearish bets of hedge funds? Probably. A market meant to frustrate all.
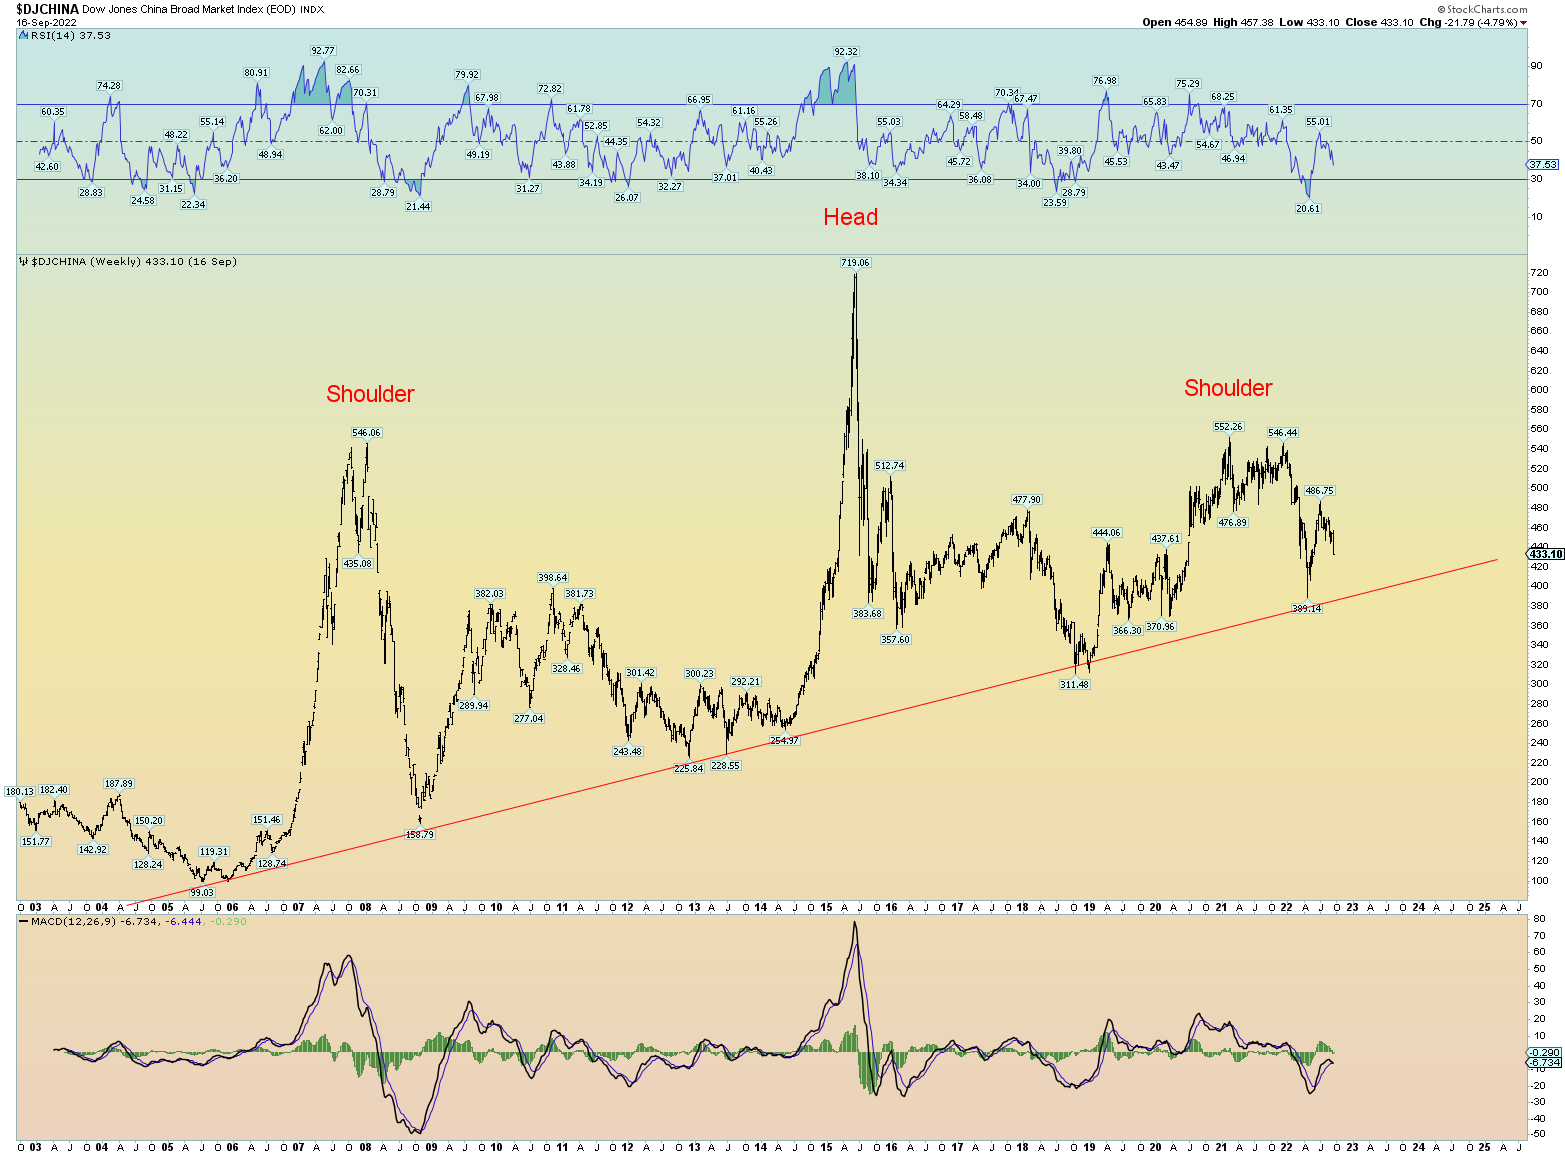
China. Similar count, similar spot. Seems to be cracking bearish.
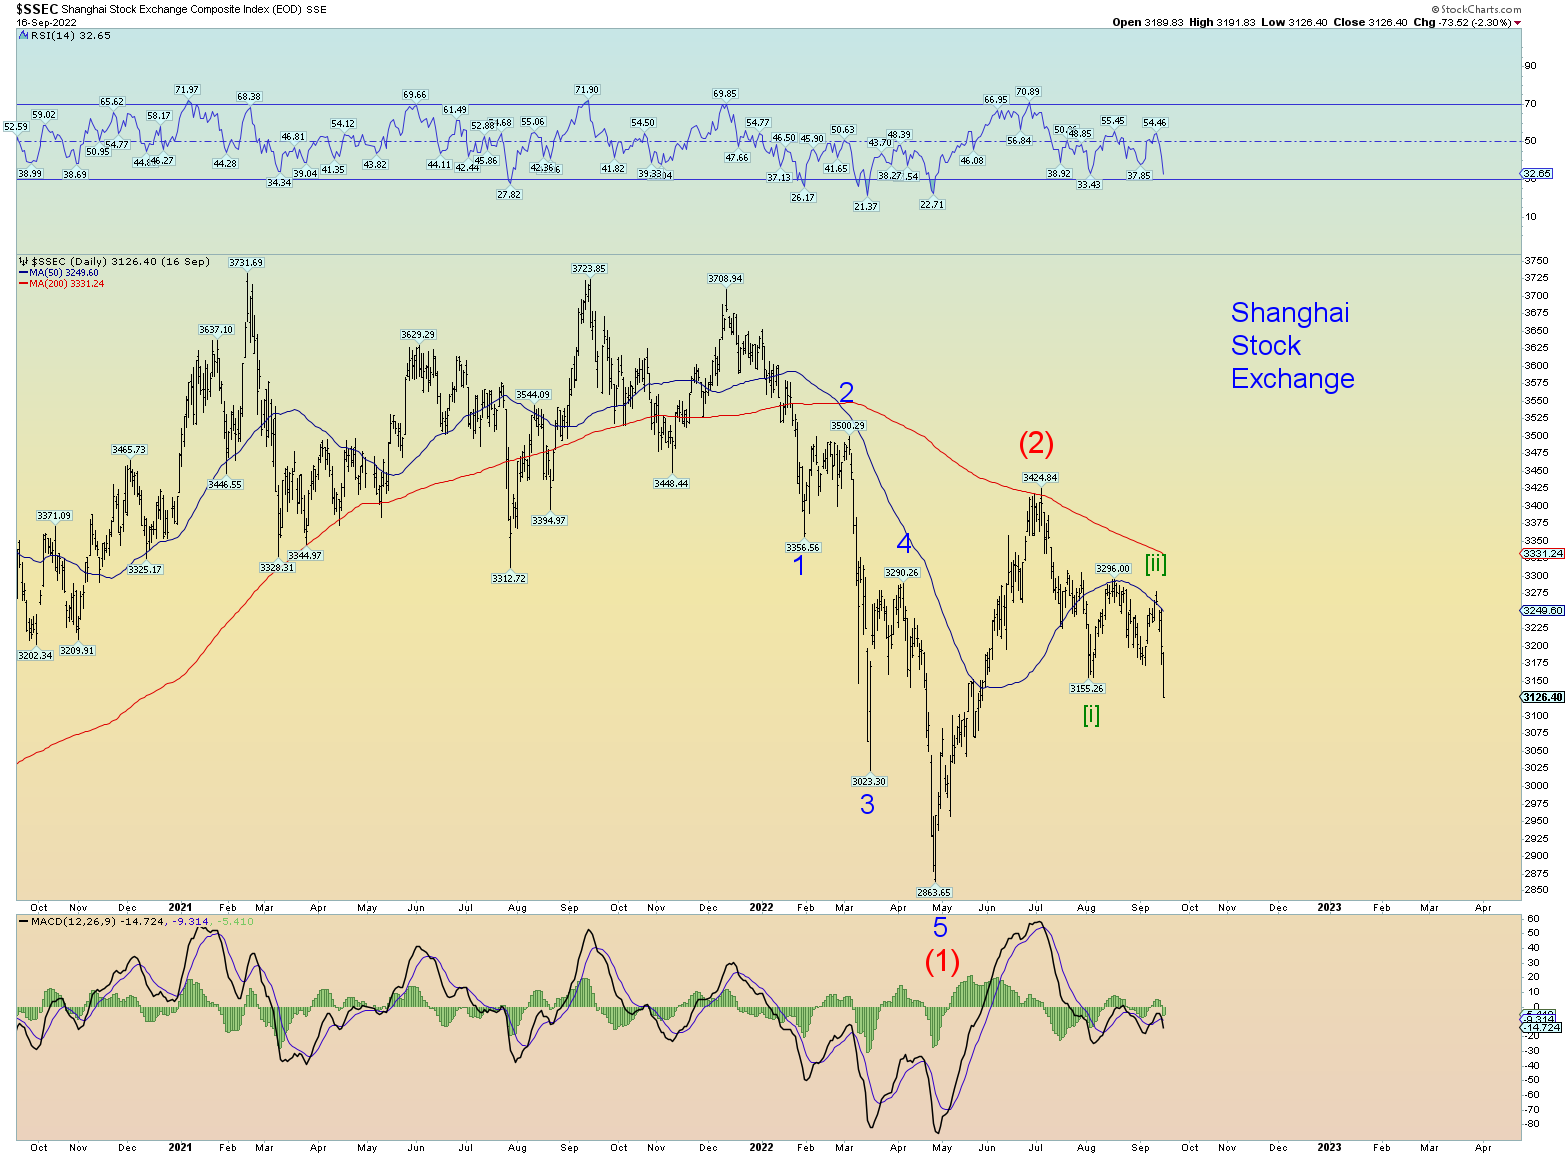
A solid break of the long-running upwards trendline does not portend well for social mood outlook of China. A break of this trendline will likely bring war.