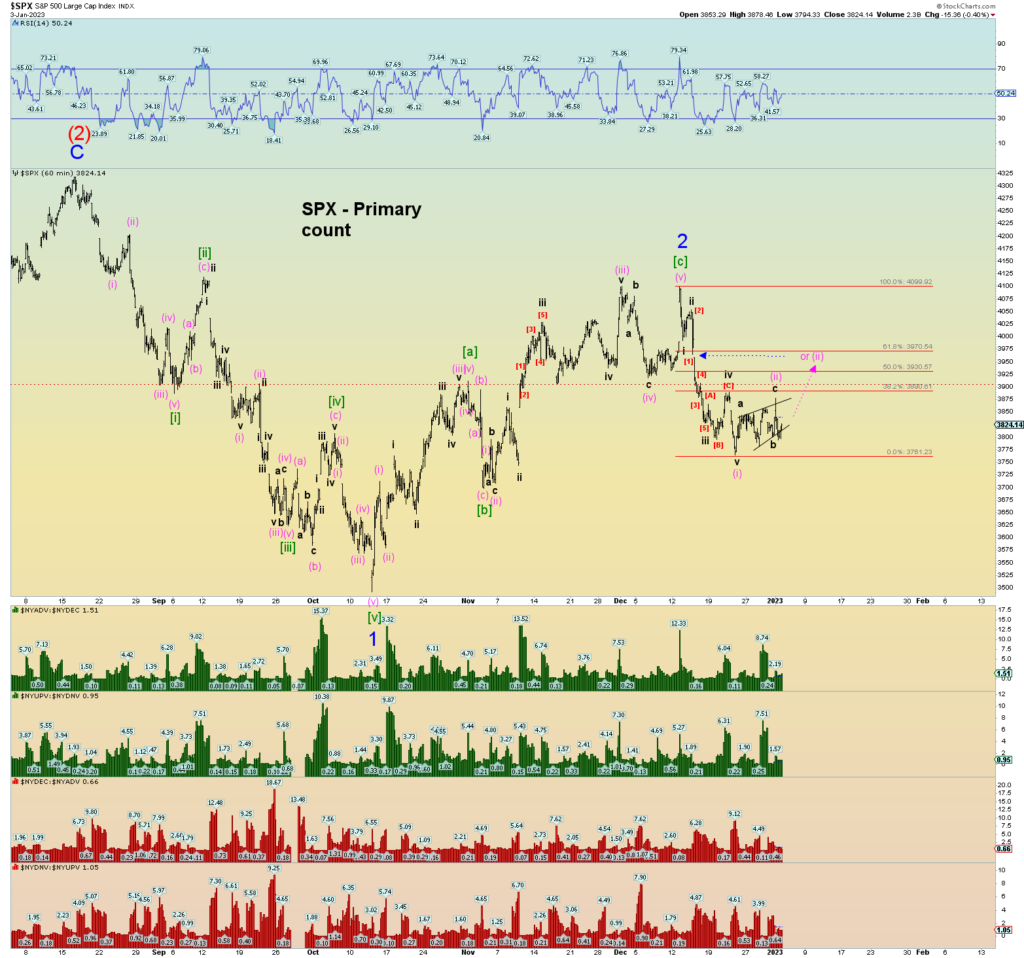
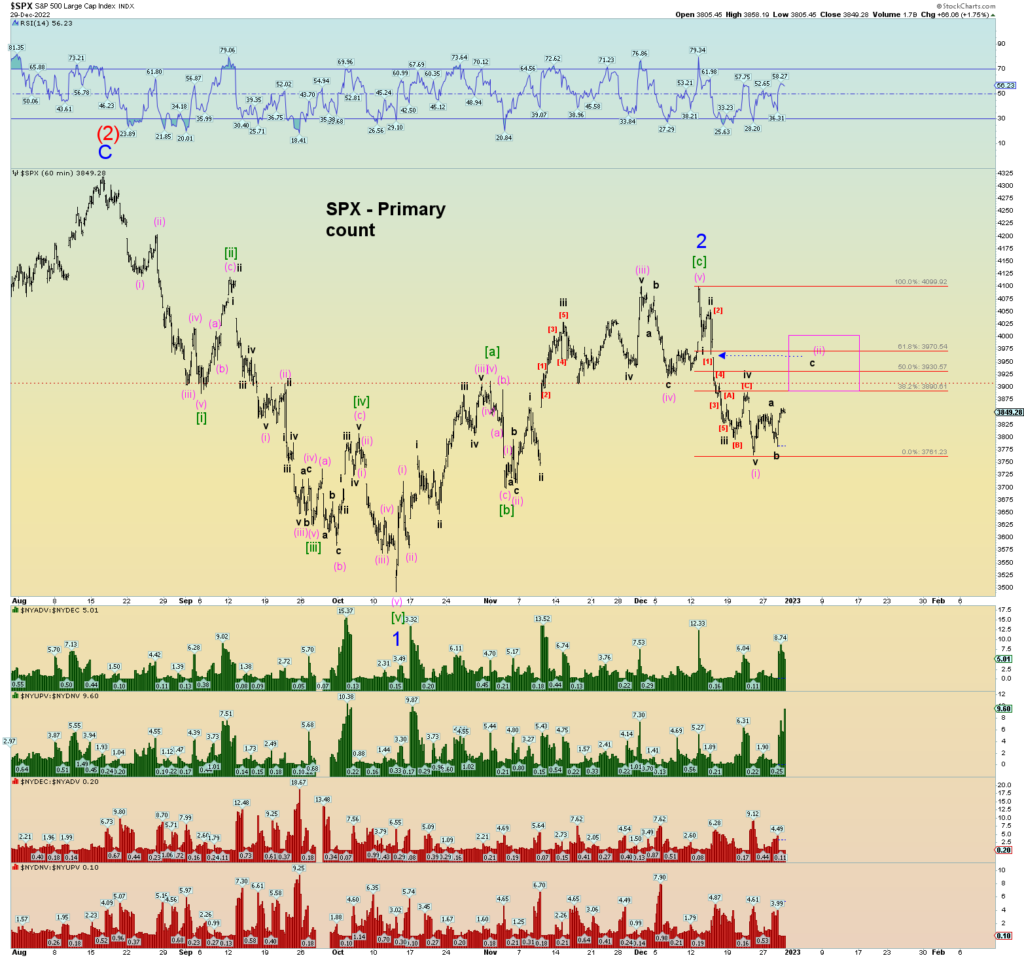
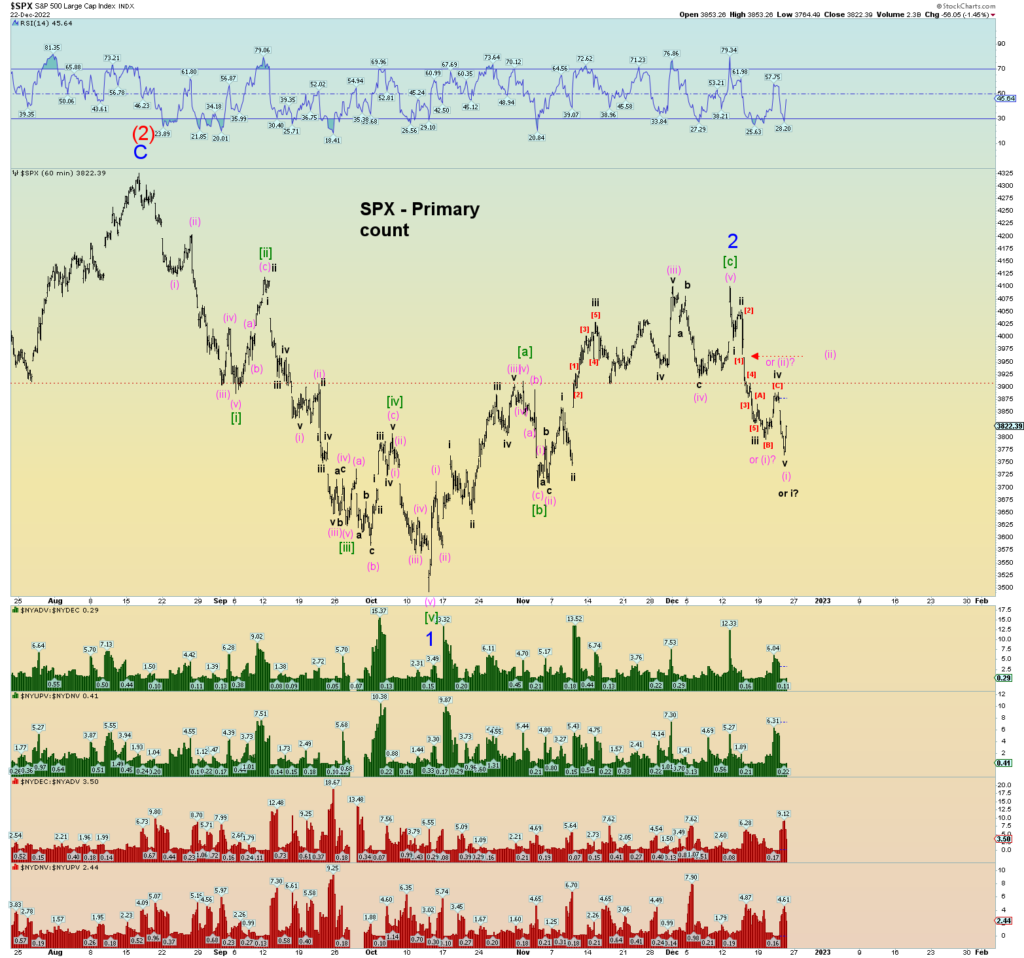
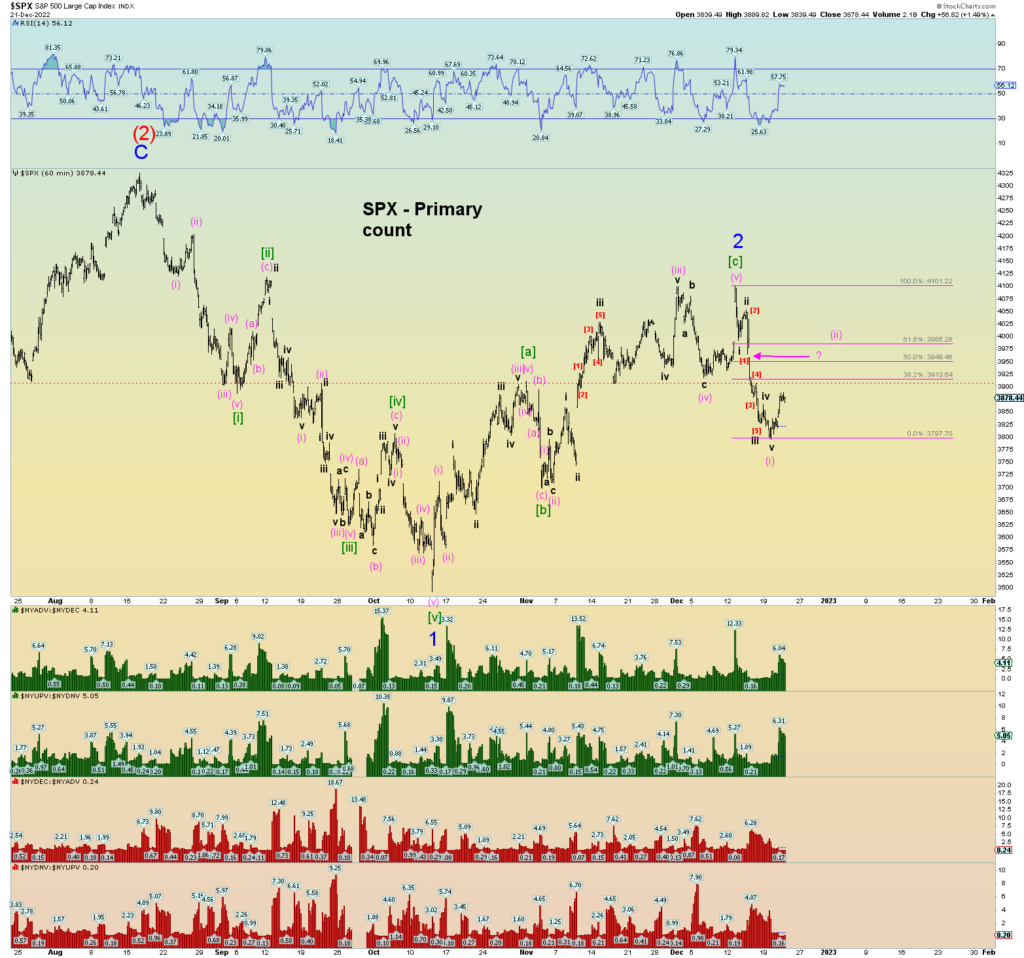
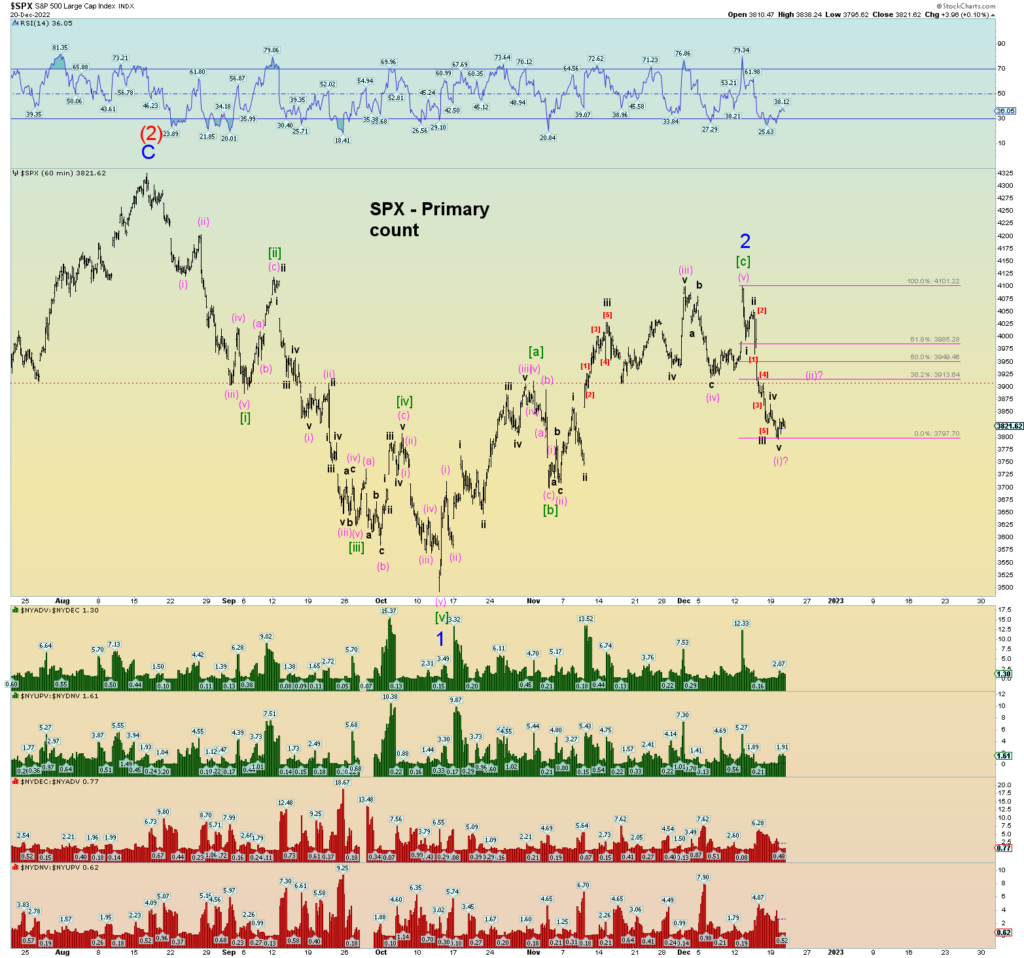
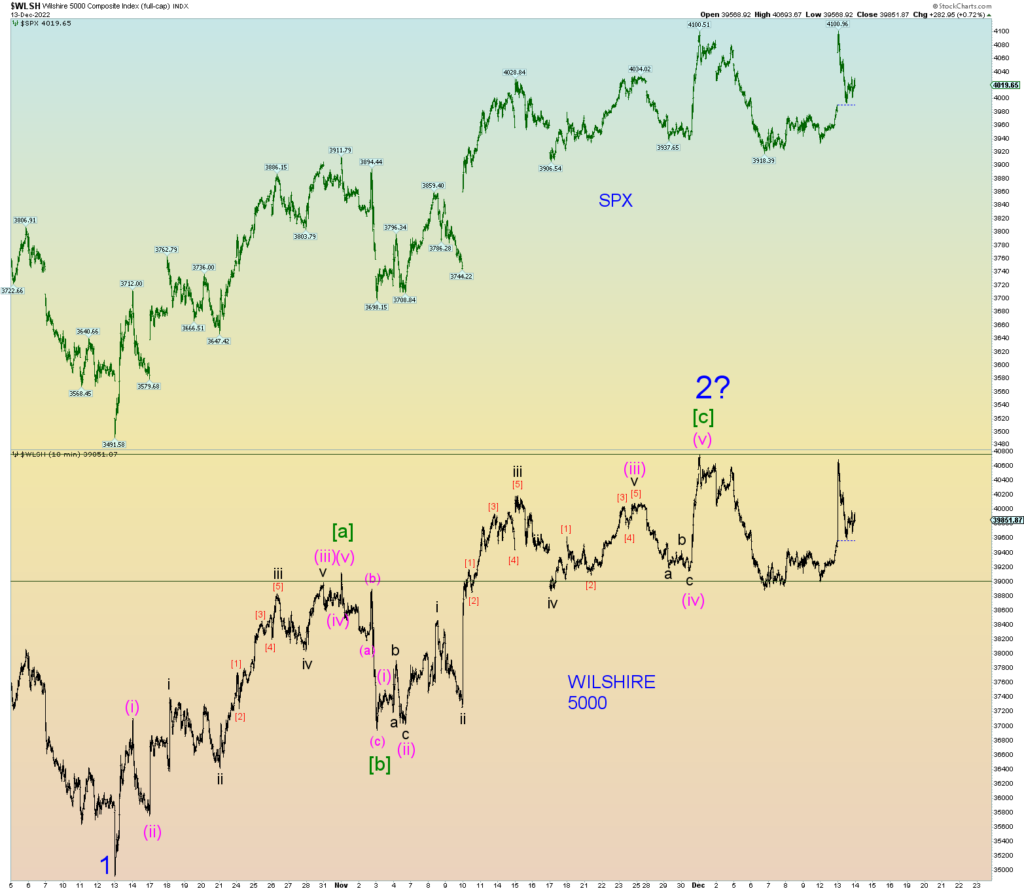
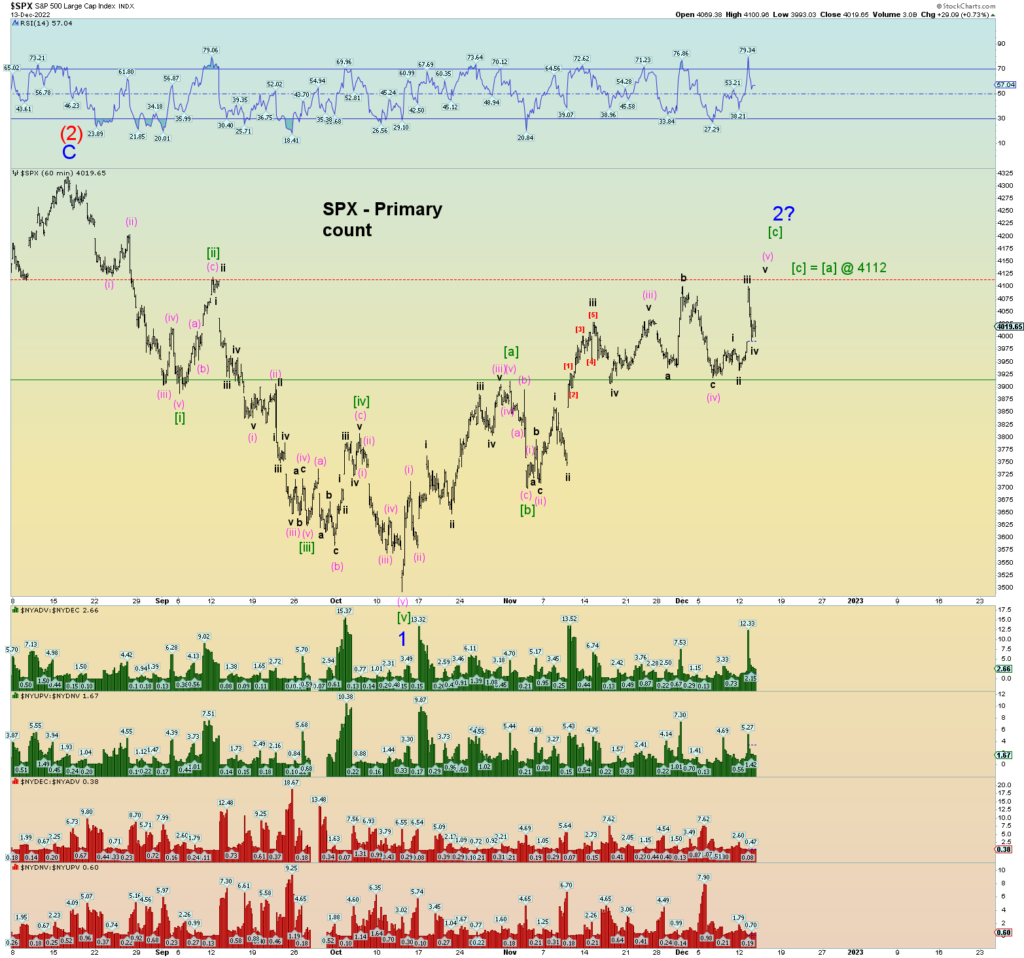
Well, today was a kick in the nuts for bears. The market is likely heading higher, perhaps closing the open gap down in the SPX. Today may have even triggered a NYSE “breadth thrust event” (13 days) as I like to call it. I won’t have that data until Monday though from Stockcharts.
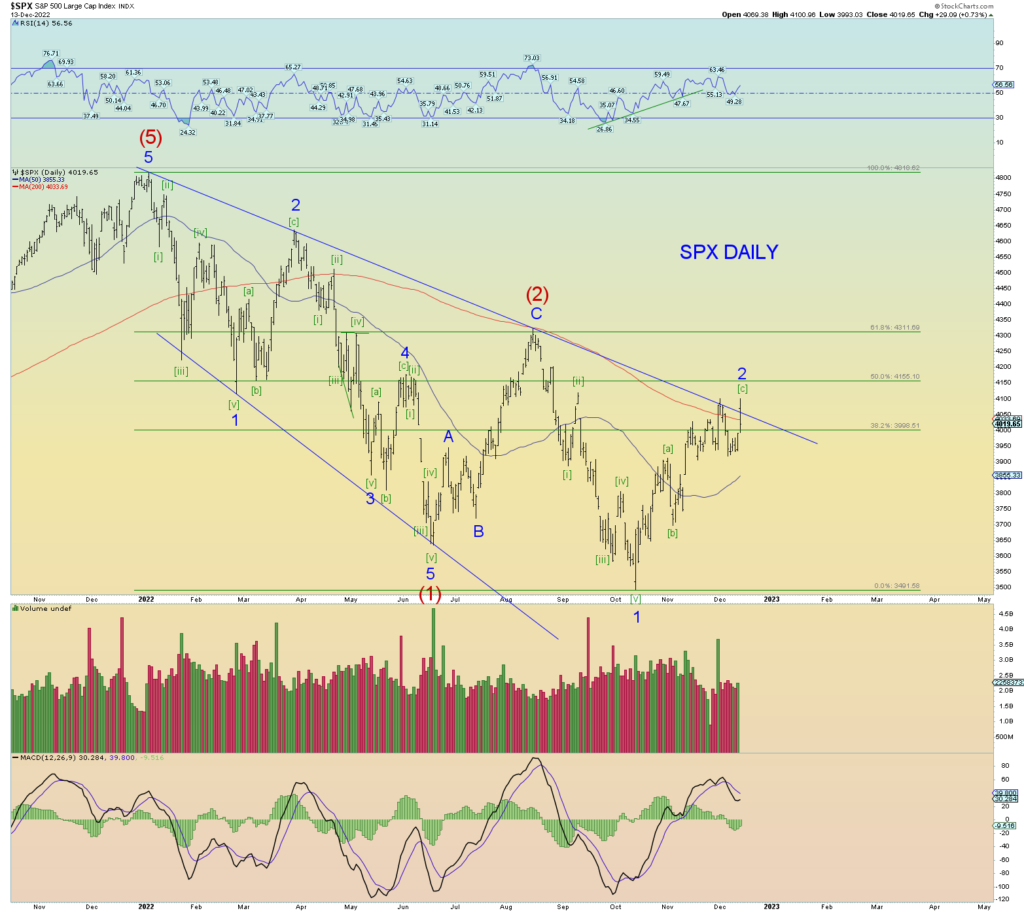
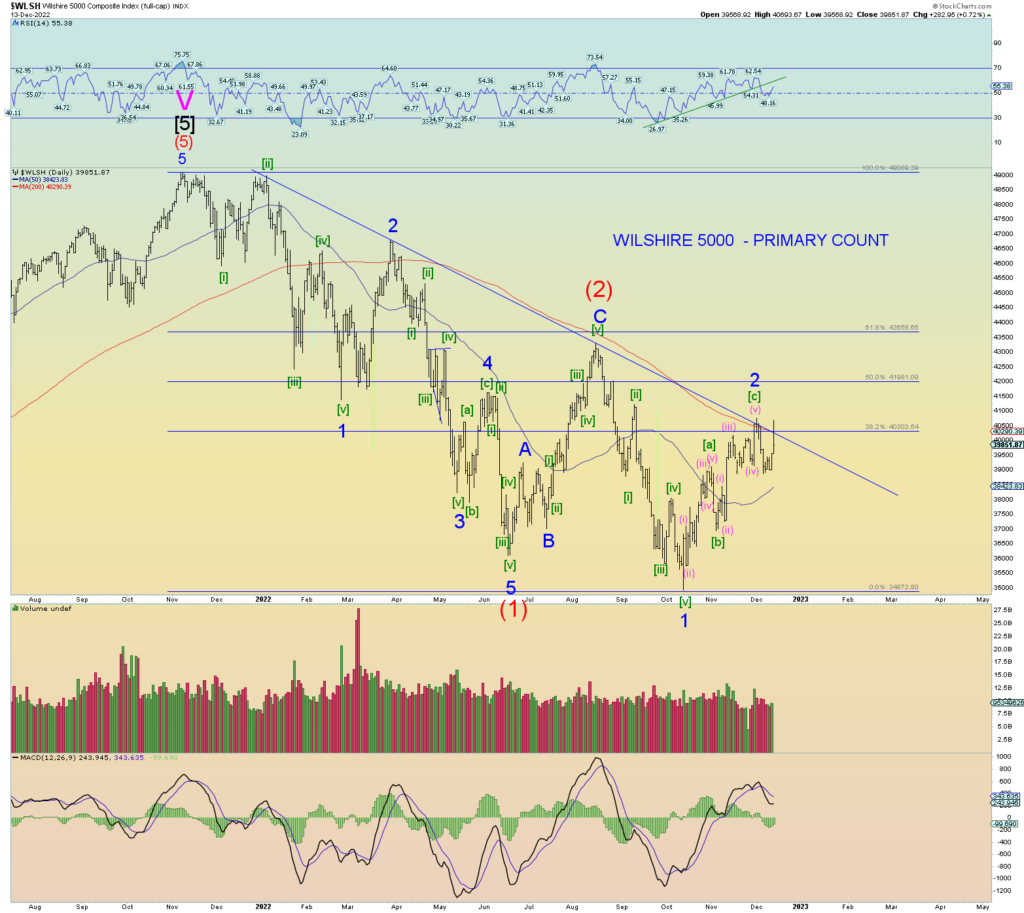
Therefore, the count is much like Intermediate wave (2) in that wave “C” of (2) stretched itself out very bullishly (and then collapsed). It seems Minor 2 of (3) is doing the same. Wave [c] of 2 is stretching itself out to the fullest perhaps.
200 DMA seems “hell or bust”.
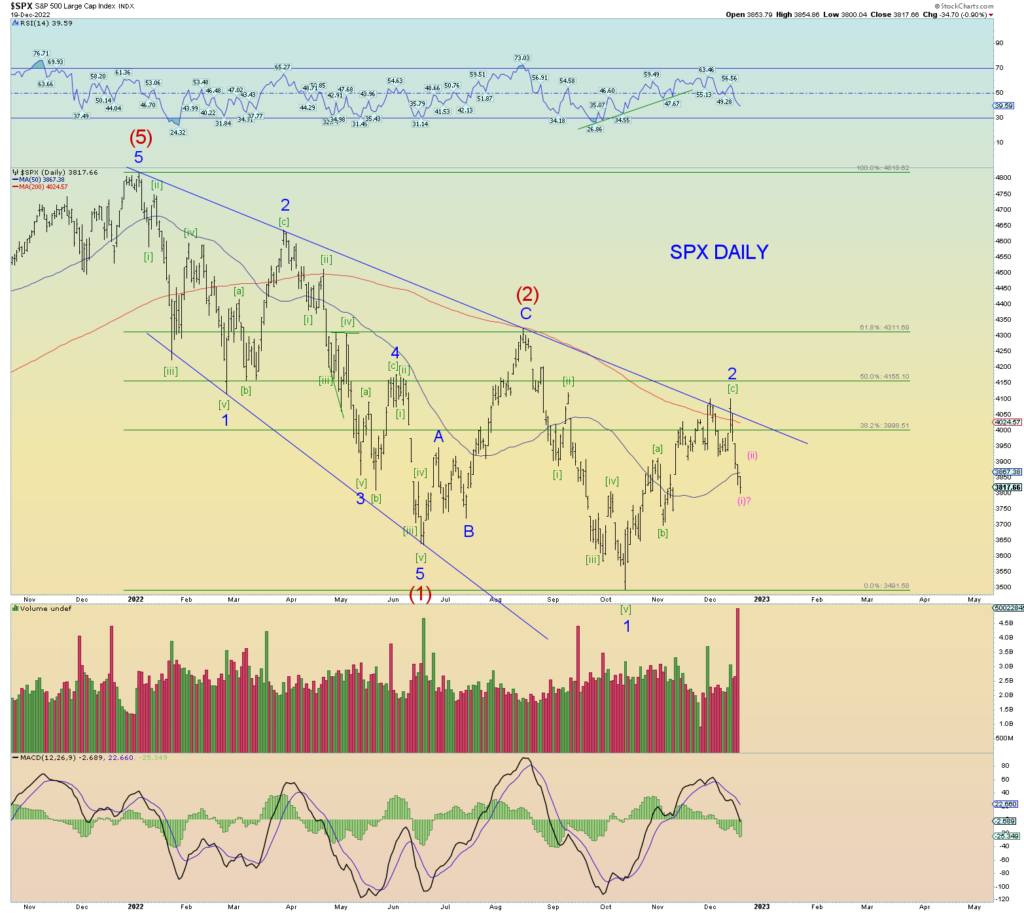
200 DMA seems a likely target.
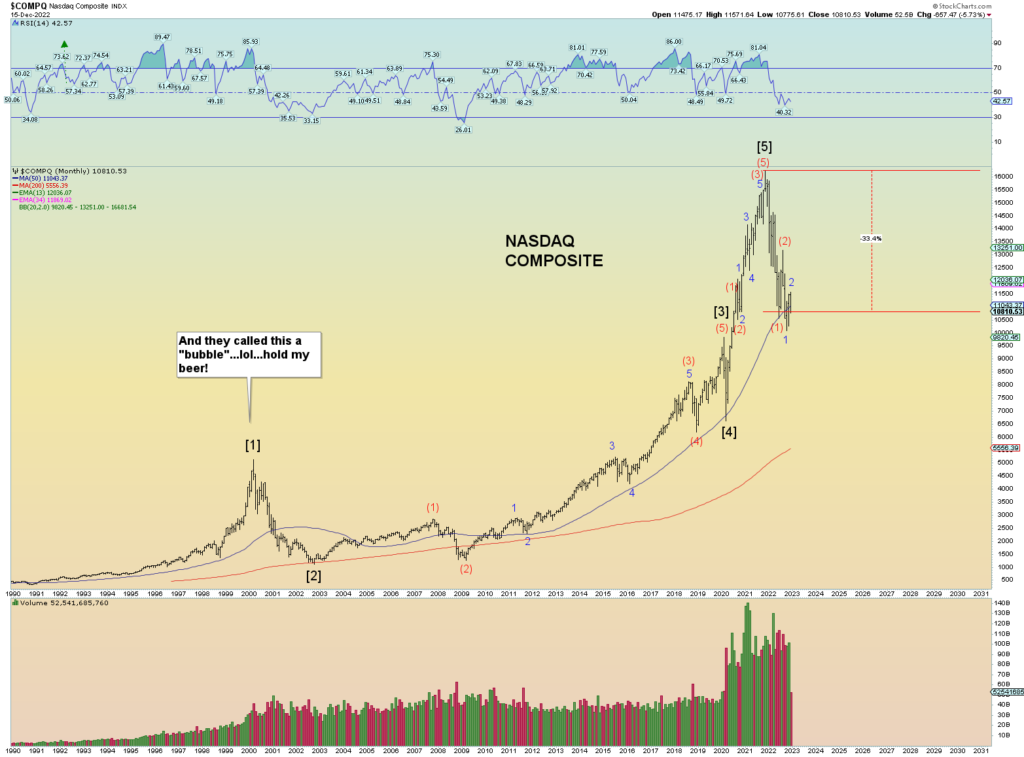
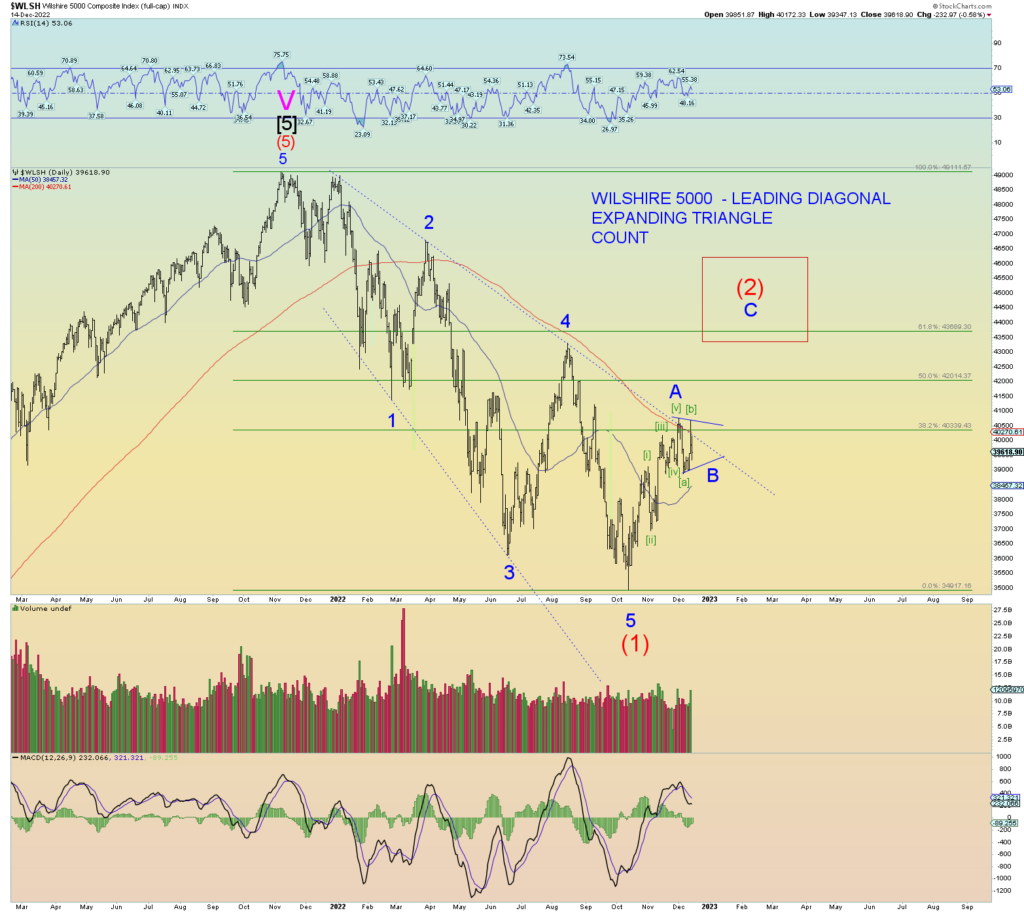
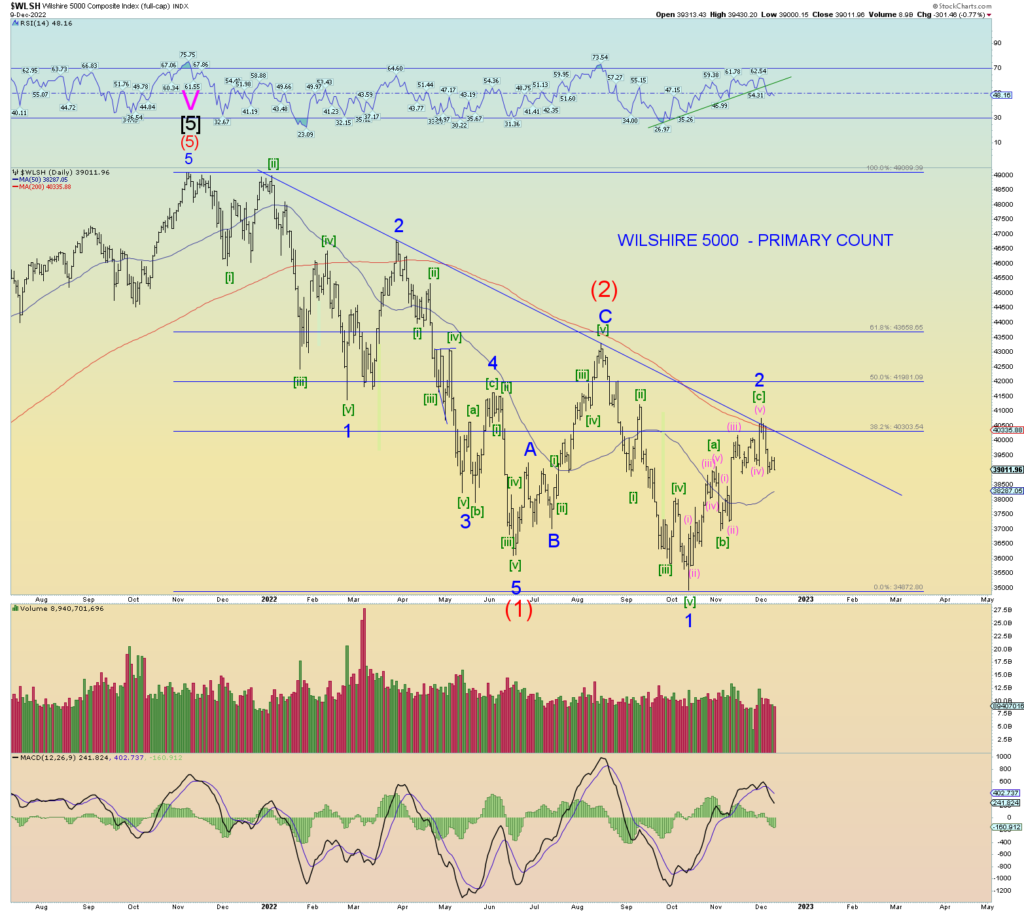
The ultimate long term alternate count is that Intermediate (1) finished at the low and we are in an aggressive Intermediate (2) that will retrace quite some distance at least a Fibonacci 61.8% of the entire drop and perhaps even more.
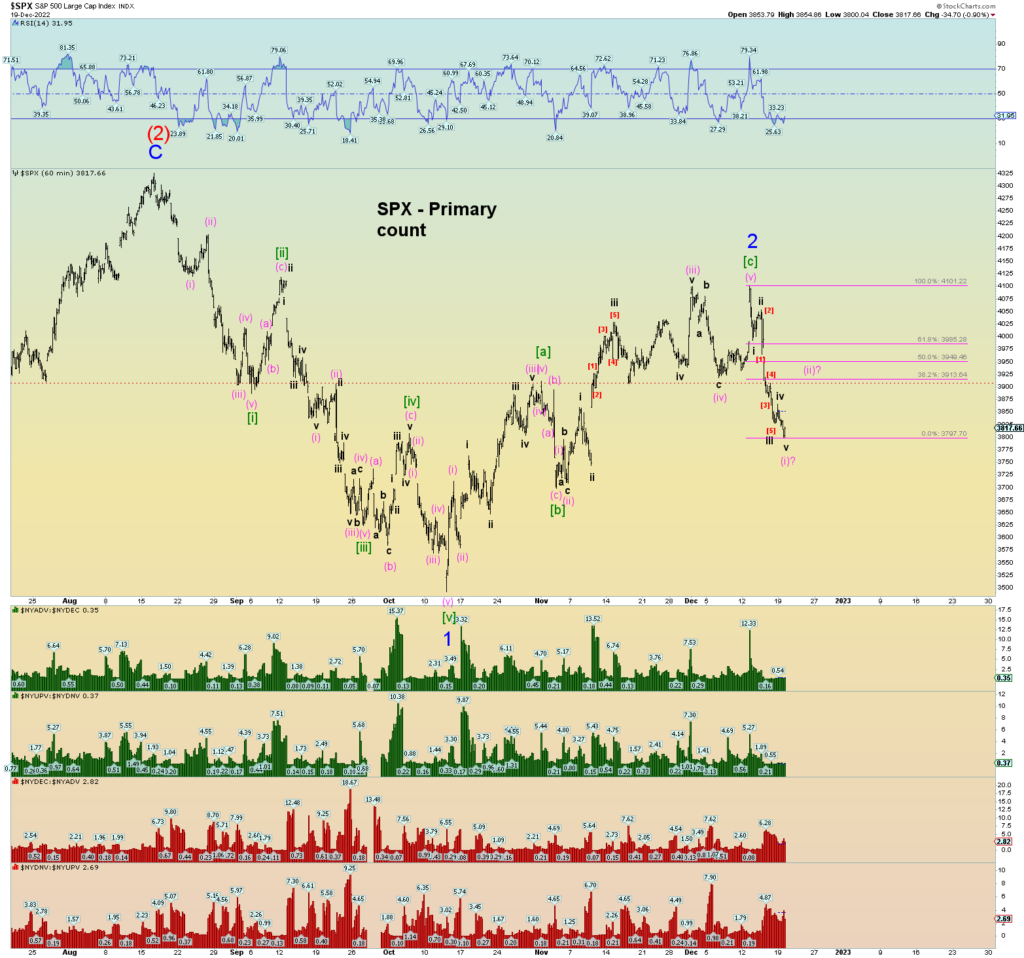
At what point does this count come into play? The hourly squiggle chart (The first SPX chart in this post as shown above) is what we should be looking at. No need to get ahead of things. First things first. Allow the market to stretch its legs all the way to 4100 if need be before we talk about other counts.
Potential squiggle count if Minor 2 has topped. This sets up for a market down-type opening tomorrow and we’ll see how after hours goes. Futures are closed as I write this and have recovered about halfway and stand at ES 3791. So, whatever. We’ll see how they choose to push the overnight tape.
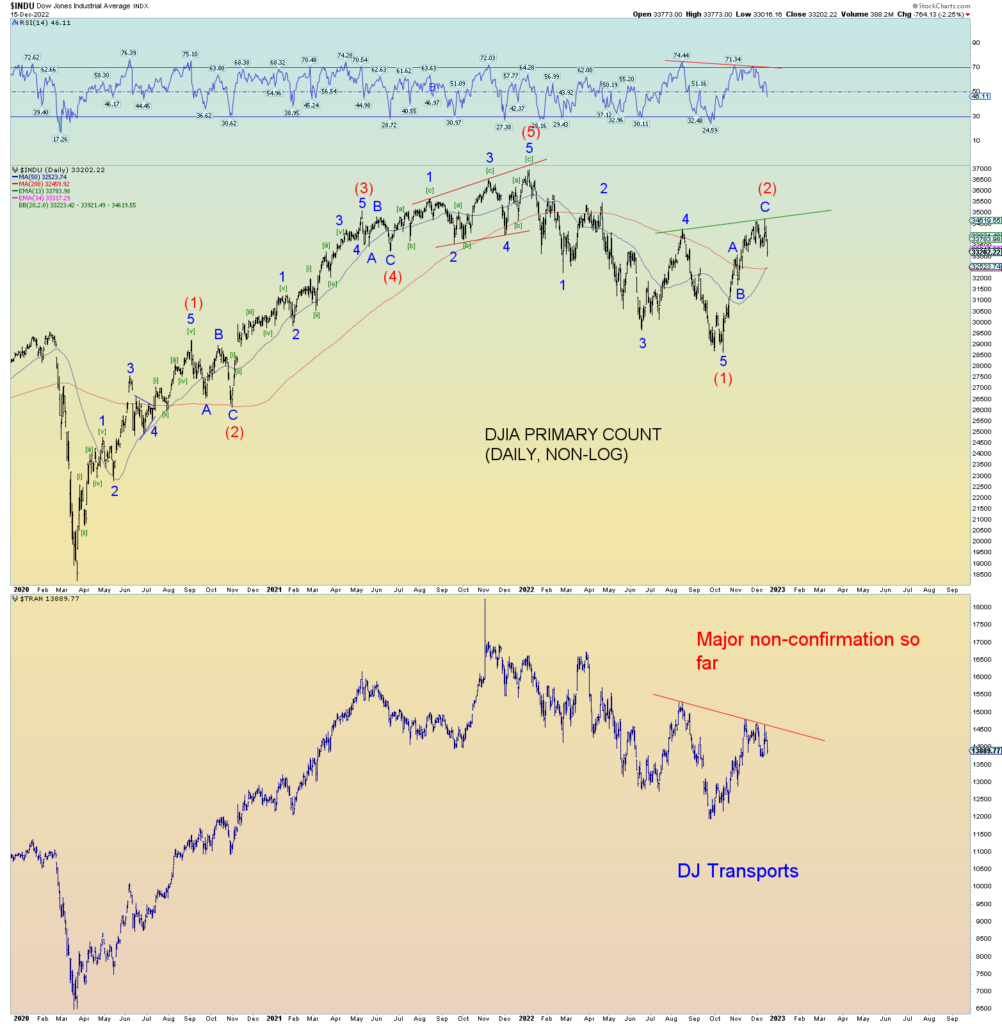
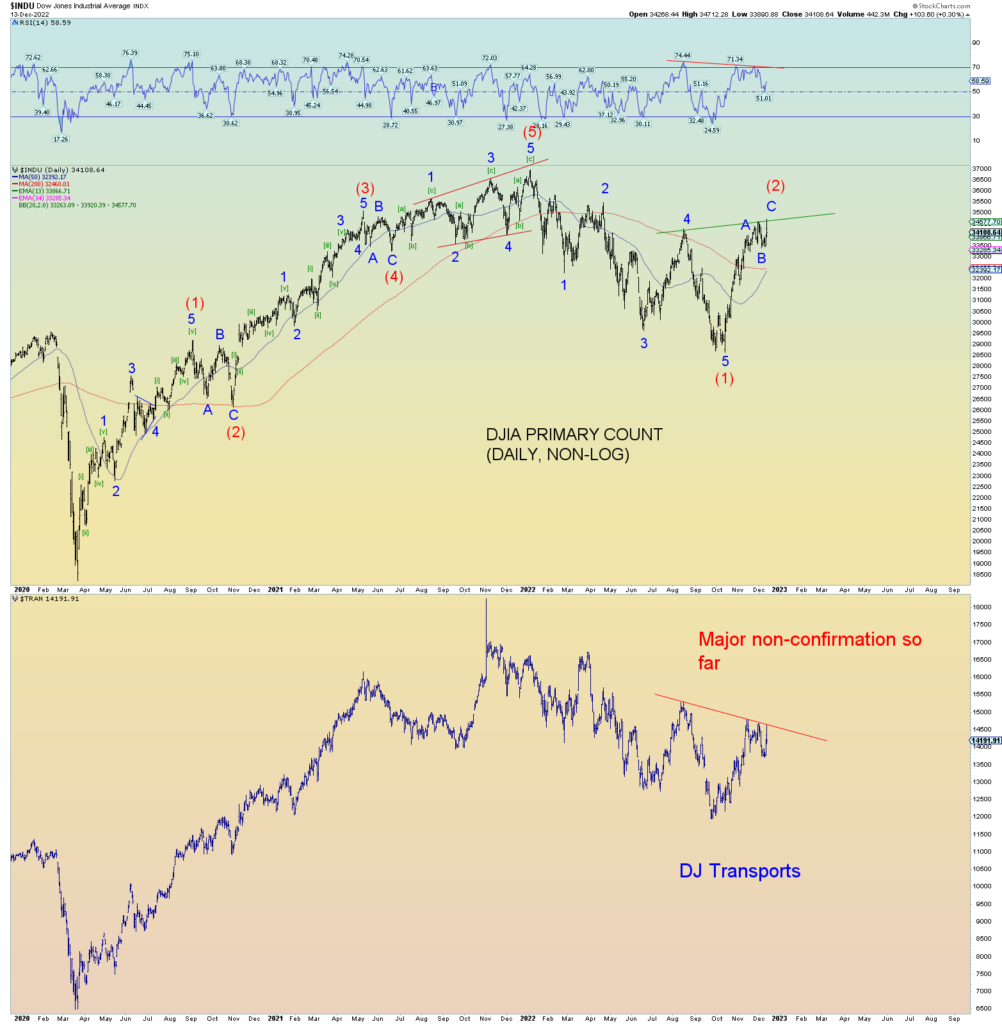
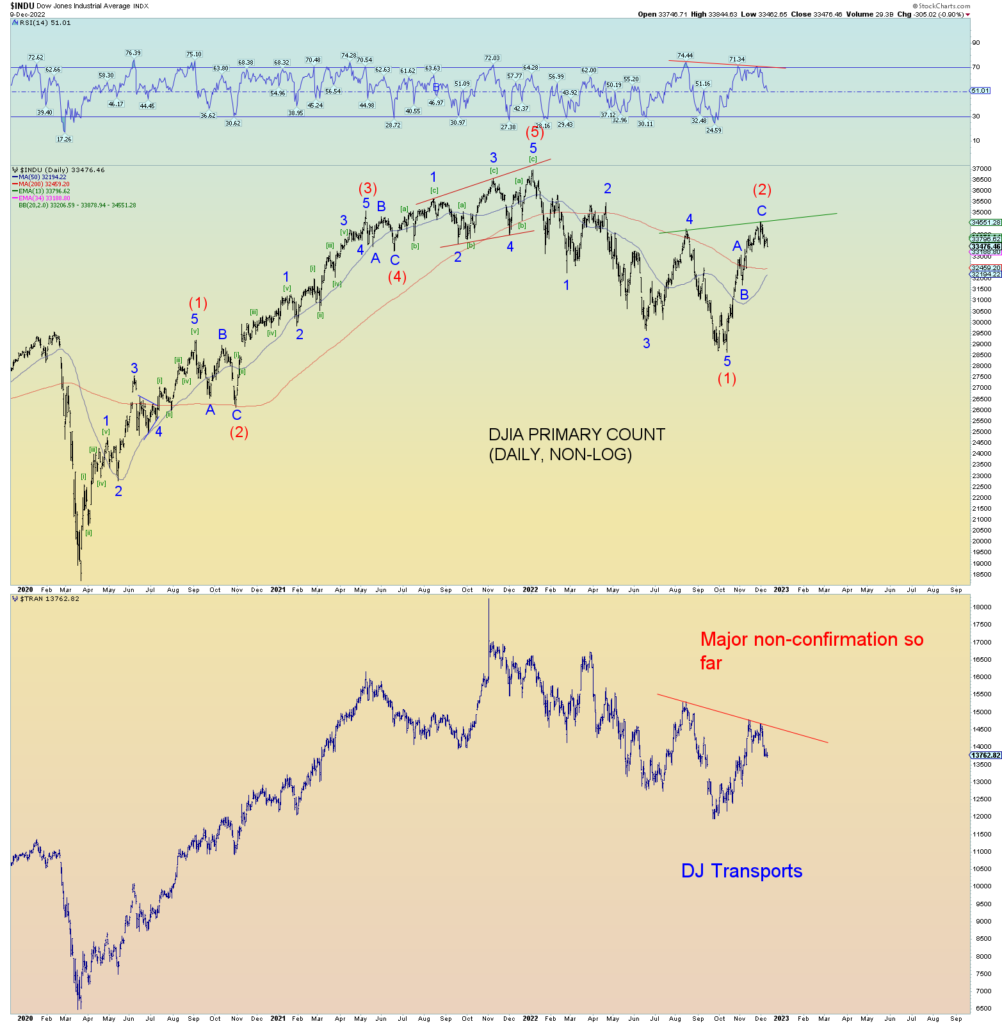
The DJIA is masking just how bad the market rot underneath has gotten. Almost “overbought” on the daily RSI, simply amazing.
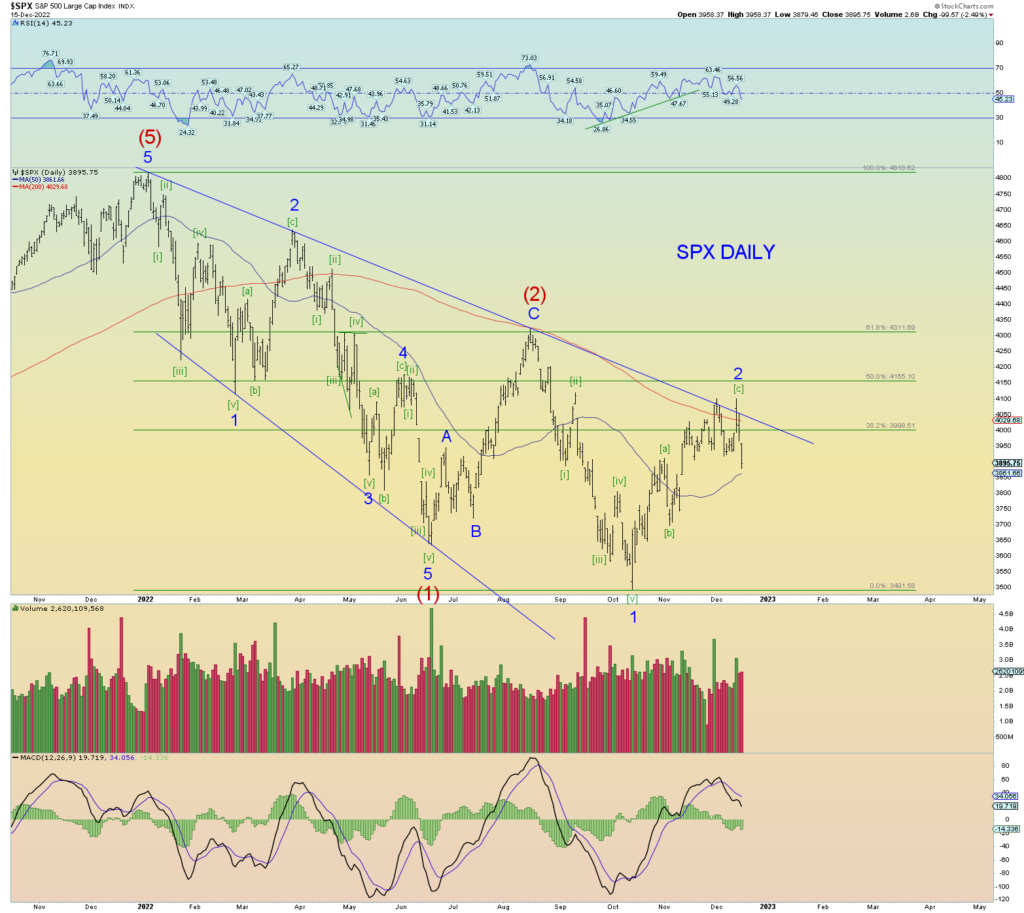
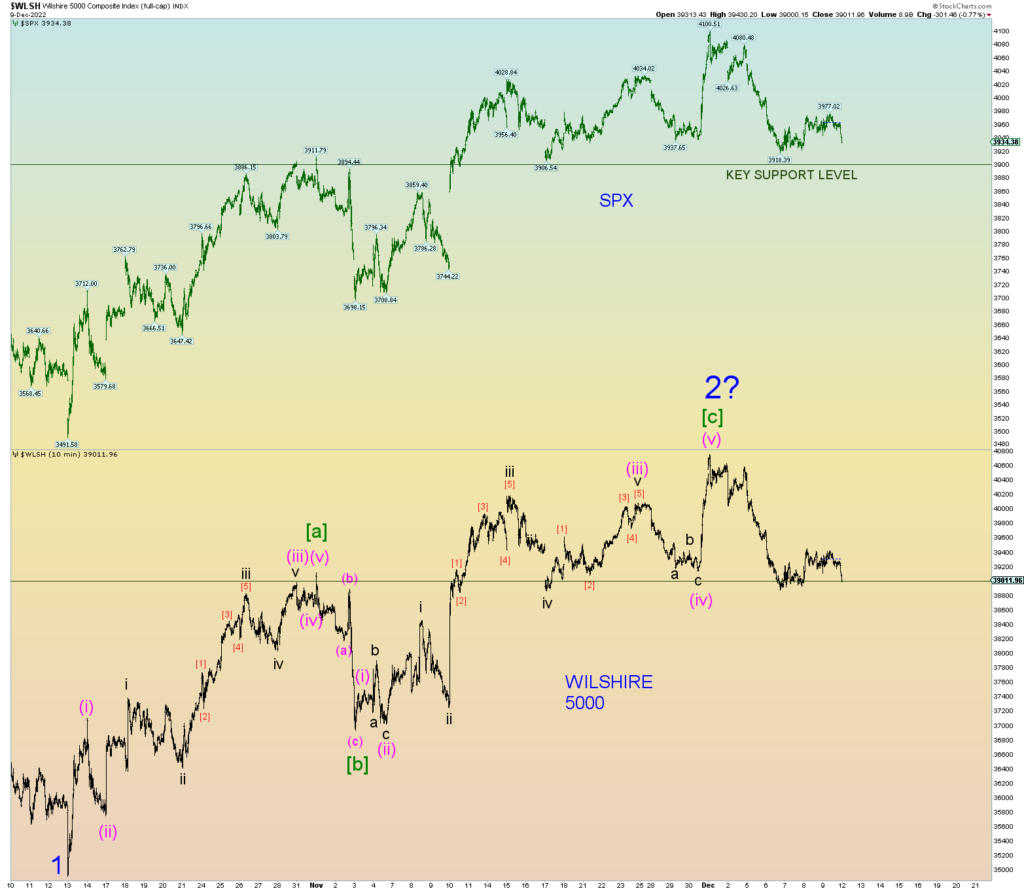
The SPX peaked at 3886+ and I was looking for 3888 or so where wave [c] = [a] of 2. Close enough. Perhaps Minor wave 2 has peaked. The pattern looks good and the time and price of the retrace is more than adequate. On the DJIA the retrace is quite deep.
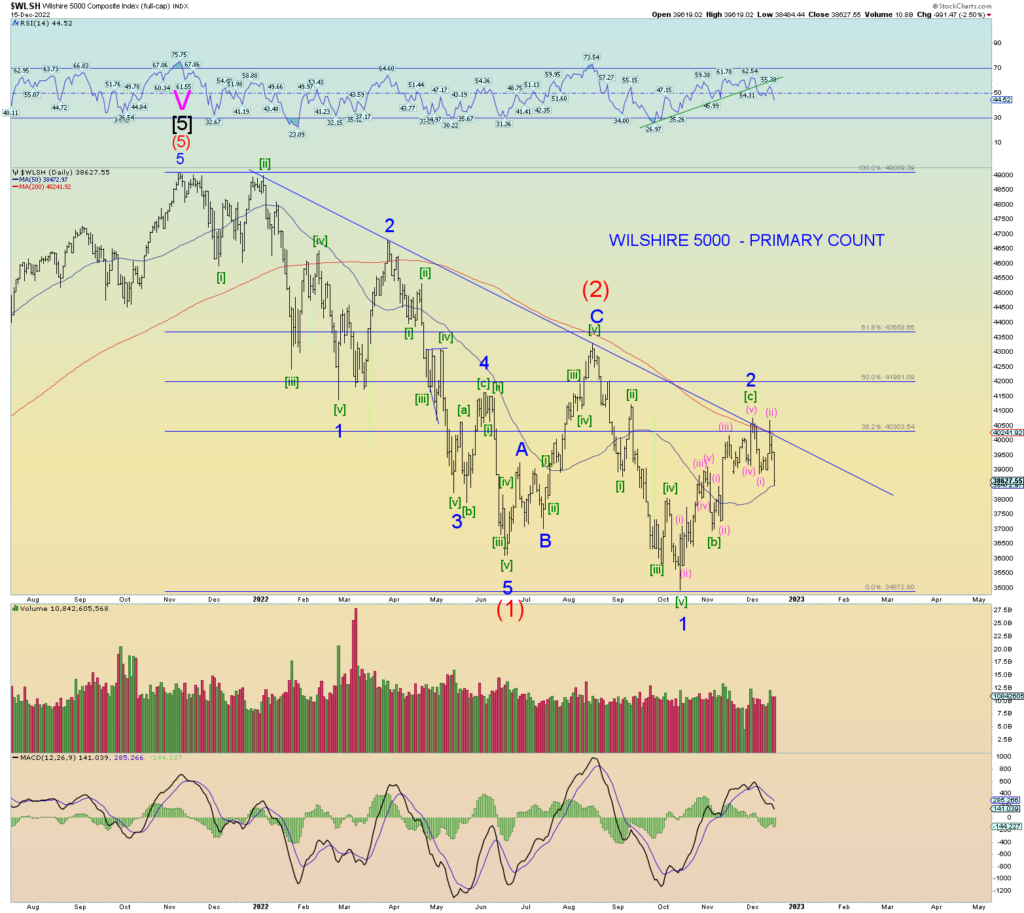
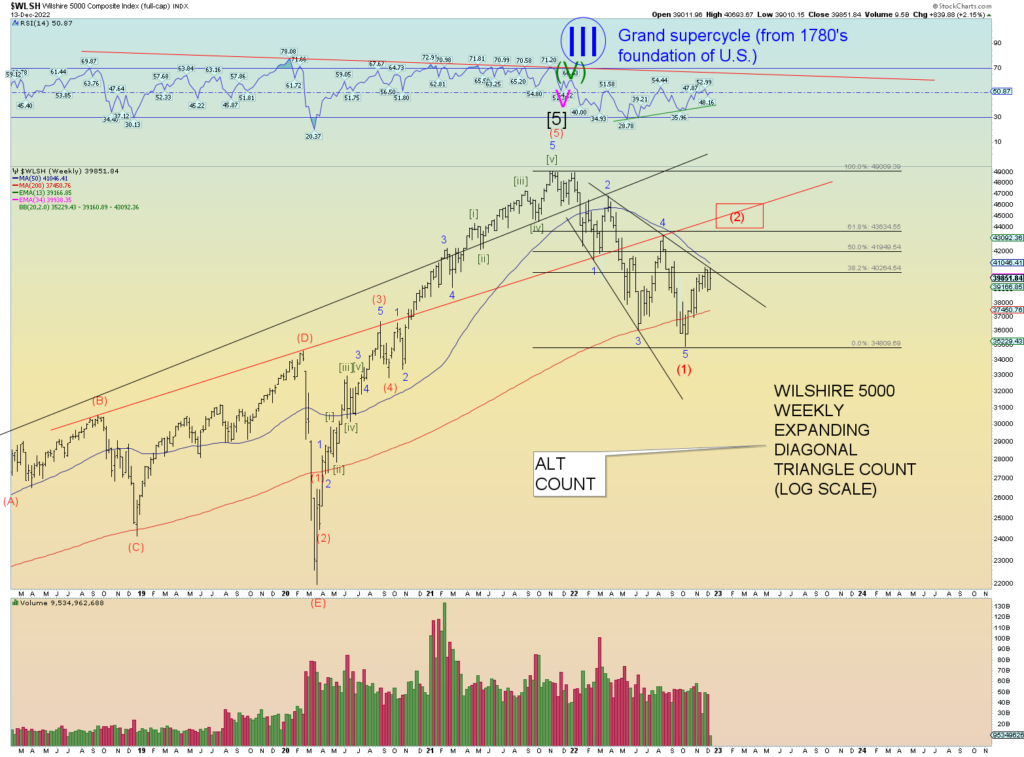
Wilshire daily shows prices have met horizontal resistance. Remember, a few weeks ago, everyone wanted out of this market. Now that prices are back toward 3900 today, many took the opportunity to do just that.
A major bond rally would not be surprising. Does that mean equities rally also? Not necessarily. I expect any positive correlation between equities and bonds to break. Hard down in stocks, panic-selling in a Minor wave 3 of (3) sending buyers into the “safe haven” of bonds. Just a thought.
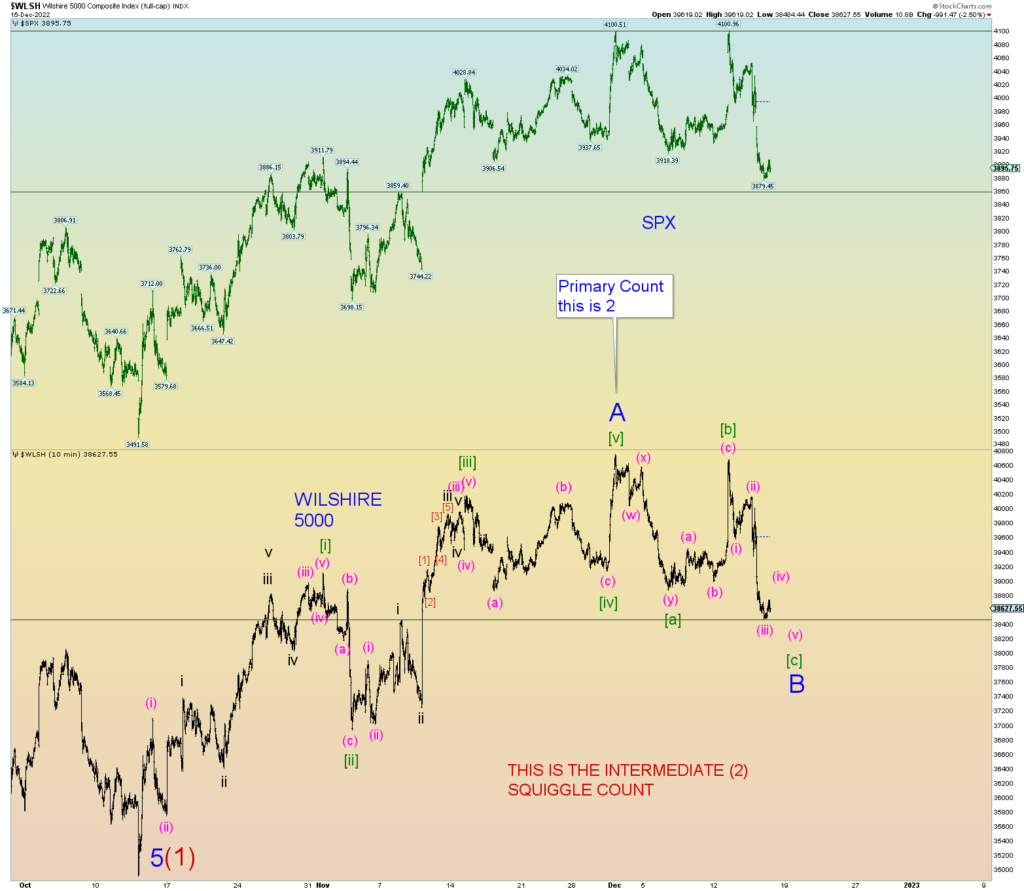
The SPX is pathing in a way that the primary count has predicted. It is charting a Minor 2 of (3) rally and probably has more upside to go. [c] = [a] @ about 3888.
And it is weird how even after I have been predicting the Minor 1 low and was patient with it fully forming (I was) and have been predicting Minor 2 would trace a Fibonacci % higher in a “corrective” [a]-[b]-[c] pattern (it has), it still “feels” defeating as a long-term bear. Why is that even when we can reliably anticipate waves that when they happen, doubts still arise?
I really have no doubts and it is mostly based on my end times timeline. Because IF Armageddon will occur on or about 21 Sep 2028, THEN events will begin to ramp up exponentially. So far, the wars and rumors of wars has only gotten worse.
Hello 50 DMA. Maybe we go to the 200 DMA. There is a strong double Fib retrace relationship at about 4000 SPX. Note how Intermediate (2) wave C expanded in relationship to its wave A. Yet the entire thing went down anyway and made significant new lows. I expect the same to happen here in an even more bearish downturn.
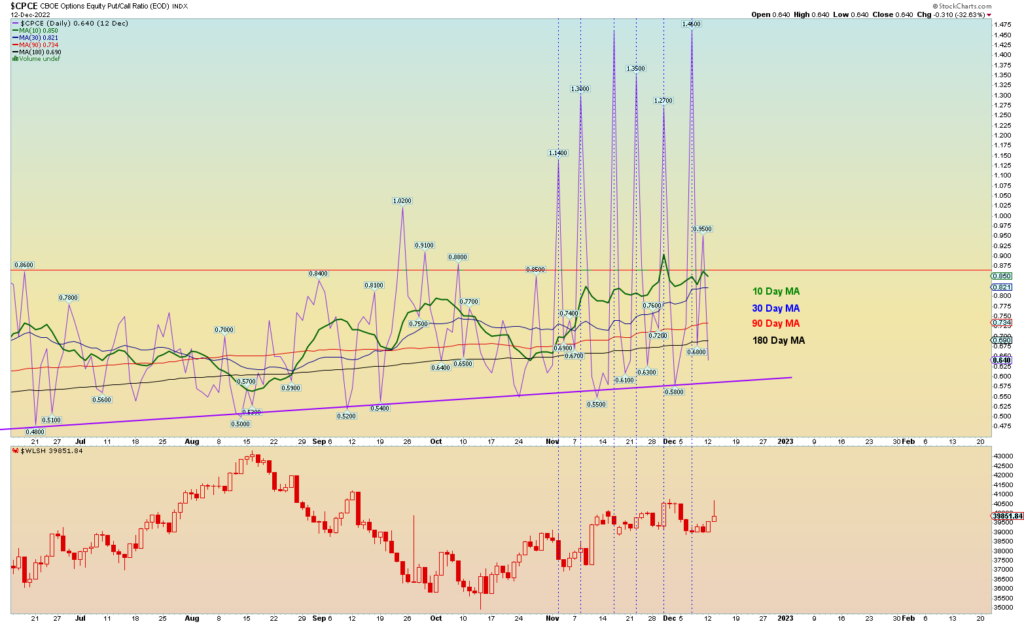
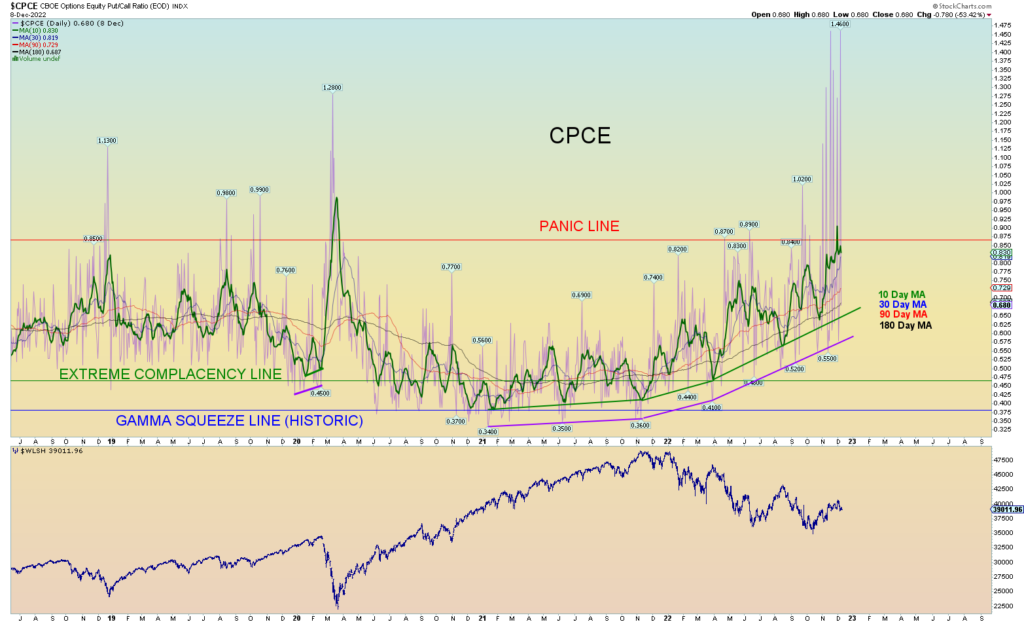
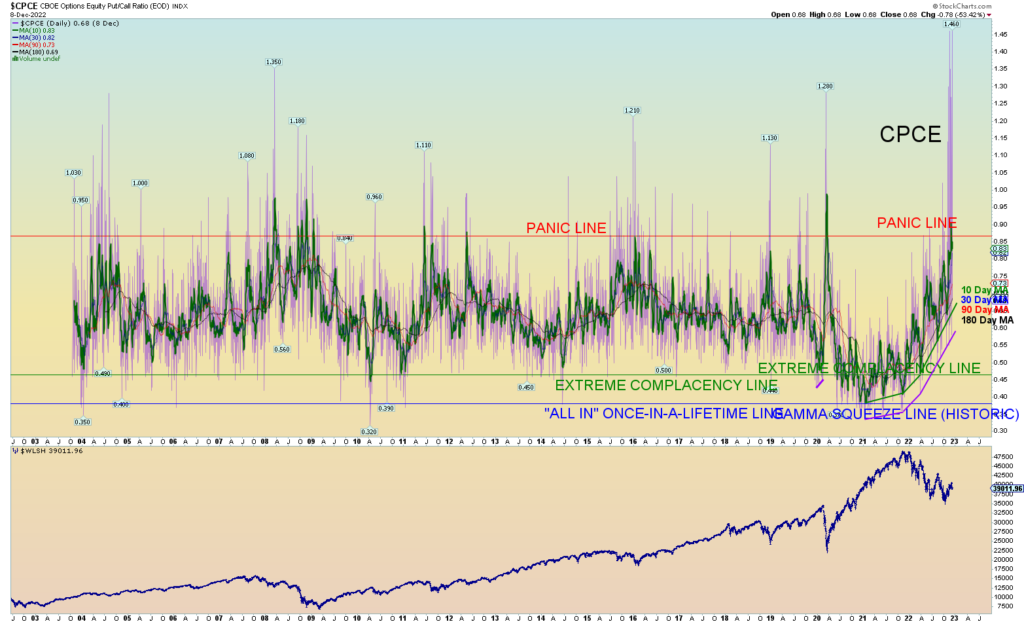
The CPCE has solid trends in place. Yesterday’s .55 daily reading (today should also be a strong call buying day) is bringing the 10-day MA down to its up-trend line. I am expecting the 10-day MA (green) to hit this line (at least) before the collapse of (3) comes upon the market.
As a final note, well, that Democrat turnaround from “give peace a chance” to “never mind it was the intern’s fault, bring on war” in less than 24 hours proves who is running this world. It is Satan in control of all political power structures, and if I am correct, he has given his Antichrist, his “chosen one” Zelenskyy real power over the earth. And who is to argue? Whatever Zelenskyy wants he seems to get ever since the war started. Even Musk who started to complain about the cost of Starlink services quickly and quietly said “never mind”, I’ll pay for it.
And why wouldn’t he? The globalists have allowed him untold riches and now they want favors in return in support of the globalist New World Order. Elon is a globalist also.
Soon the “False Prophet” will also begin to rise to power. We see that Boris Johnson will consider taking up permanent lobbying in America for Zelenskyy. He and Elon Musk are the frontrunners for False Prophet.
Sigh. I hope I’m wrong about everything. I hope China doesn’t attack Taiwan soon.
But if I am correct, the stock market will crater as part of the plan for a global reset. It ain’t hard to understand folks. Tear down the old system first, create chaos, war and disorder in the world, famine, disease and death, and there you go. People will clamor for the solutions offered by the Globalists/Satanists.
There are now enough waves in place to consider that Minor 2 of (3) is complete. The SPX poked above its prior Minute [iv] of 1 price peak, and the Wilshire 5000 did not. Sometimes that slight divergence between the 2 indices is telling. We shall see.
However, timewise and pricewise, it would look better if Minor 2 advanced a bit higher in price.
Oversold has been well worked off setting the market up for a massive plunge. To fulfill the positive RSI divergence prices would have to go above Minute [iv] of 1. The SPX did today the Wilshire did not.
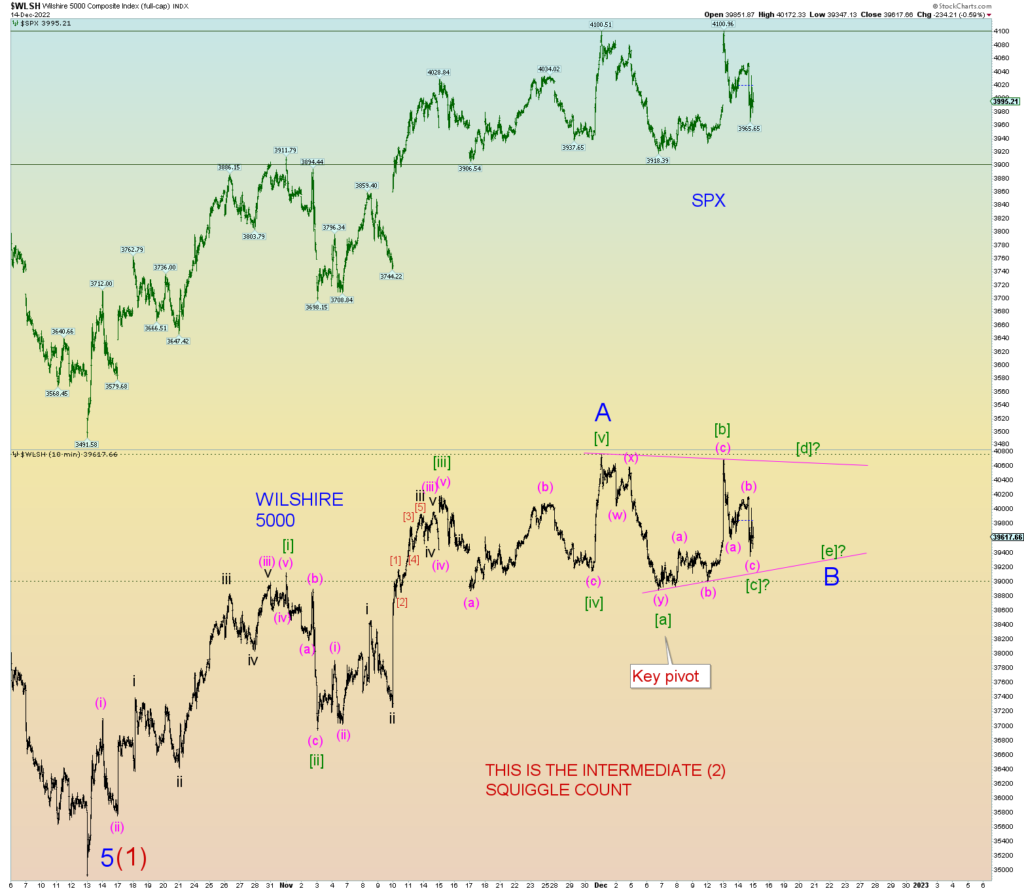
If we get the down open Monday and then recovery, the best pattern is that wave [b] of 2 is a running ascending triangle. Prices for (e) of [b] would have to finish lower than the peak of [a]. Otherwise, it’s not a running triangle.
The market has been range bound for a month at the 3575 – 3800 range. The head fake beneath the range formed Minor 1. A proposed head fake above the range should form Minor 2. At the moment the market is frustrating the maximum amount of people both bull and bear alike.
Bonds. Hammered. I keep placing a wave [1] but it keeps just going lower and yields higher. The Ponzi has popped, and no one realizes just yet.
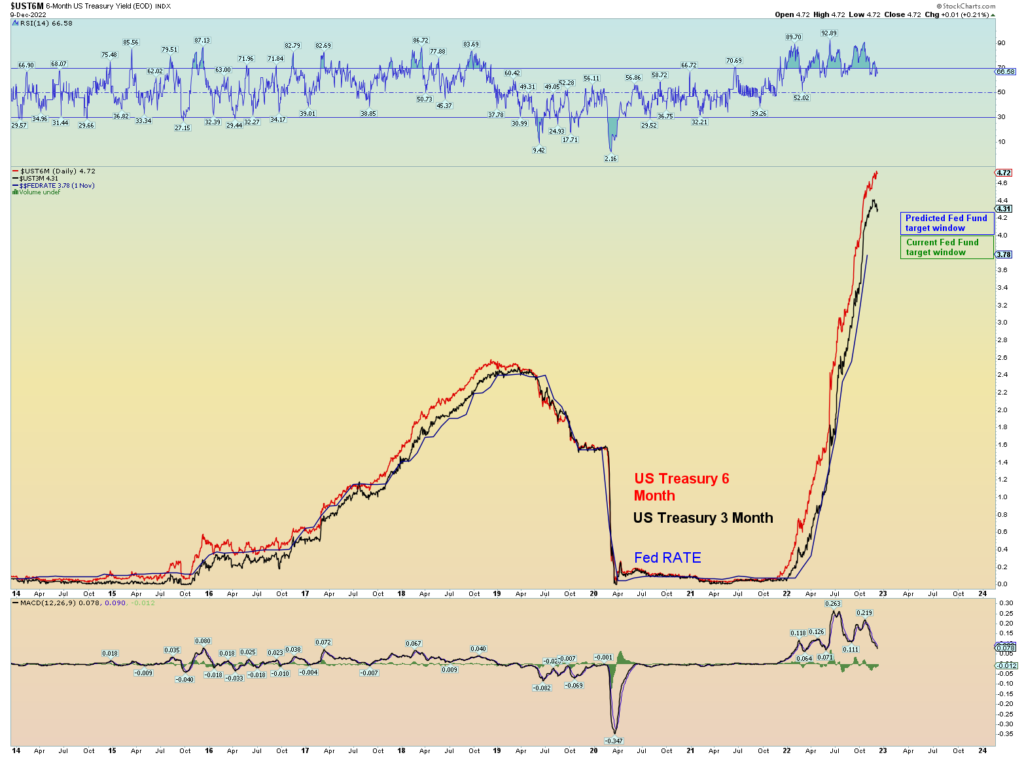
3 and 6 months still shooting upwards. Solid 3/4-point raise is coming, but if these 2 rates rise another 1/5 point and hold above that, we are looking at a full 1-point rate raise by the Fed come the next meeting in early November.
Today the signs of “heavy” trading picked up again. At one point the NYSE was trading at over a 5:1 down ratio in decliners vs. advancers even though the price drop seemed “tame” compared to what has been happening. The SPX closed under 3700.
Perhaps a backtest of the upper channel line occurs tomorrow maybe a gap down. Who knows, they have been pushing futures every which way of late to get the extreme openings.
The thin blue box is the “virgin” space of the 5-wave structure from (2) to 1. This is the Minor 2 minimal target range and it’s at the 38.2% retrace Fib which would be an acceptable wave 2 level.
If prices bust downward we have last support at about 3578 SPX.
GLOBAL WAR COMMENTARY
I am predicting that after this week’s Chinese Communist Party meeting, Babylon USA will go back to provoking Xi with high-level visits to Taiwan again.
Perhaps even V.P. Kamala Harris will surprise visit within 2 weeks. That’ll really rile ’em up. We had #3 in the Presidential line visit, why not #2?
Again, the best weather window for attacking across strait is October/November in my estimation.
If China does a full-on invasion and Taiwan fights back, the USA will find themselves shooting down Chinese jets before Thanksgiving. And then the global war goes “hot”. Just remember, the globalists trying to bring about the New World Order want and need these wars. Global financial collapse is coming. Satan is in charge of it all.
The Wilshire 5000 has corrupted data again on Stockcharts. I had to add to the top of today’s candle.
The market has now bounced higher than at any other time since the wave (2) peak of August. Prices have broken out of the down channel, and the wave pattern so far from the low is a 3-wave pattern. All these things collectively signal that we are on the correct count of Minor 2 of Intermediate (3) down.
The following charts show ideal Elliott Wave relationships within the context of a series of (1)-(2), 1 – 2, [i] – [ii]. In an ideal EW pattern as the wave hierarchy gets smaller, the speed of the market should speed up and volatility steepen. So far that has been the case. We can estimate Minor 2’s target range. Intermediate (2) did not retrace 61.8, perhaps Minor 2 only makes it to 50% or even less.
Once the market rolls over Minor 2, this is when things should really fall apart. Eventually the market should panic break at the ideal “third of a third” wave panic point. Sometimes time speeds up also. So even though this chart shows ideal pathing, it’s just a best-case scenario.
Too early to tell what is going on with the pattern since the low, but so far it charts best as a double zigzag. That could be just wave [w] of a complex [w]-[x]-[y] corrective pattern, or in theory, it could be all of Minor 2 itself. However it seems a bit short in price and time so we assume not just yet.
Or we could have a Minor 2 pattern going on like this below and we are only seeing the very few first days of many.
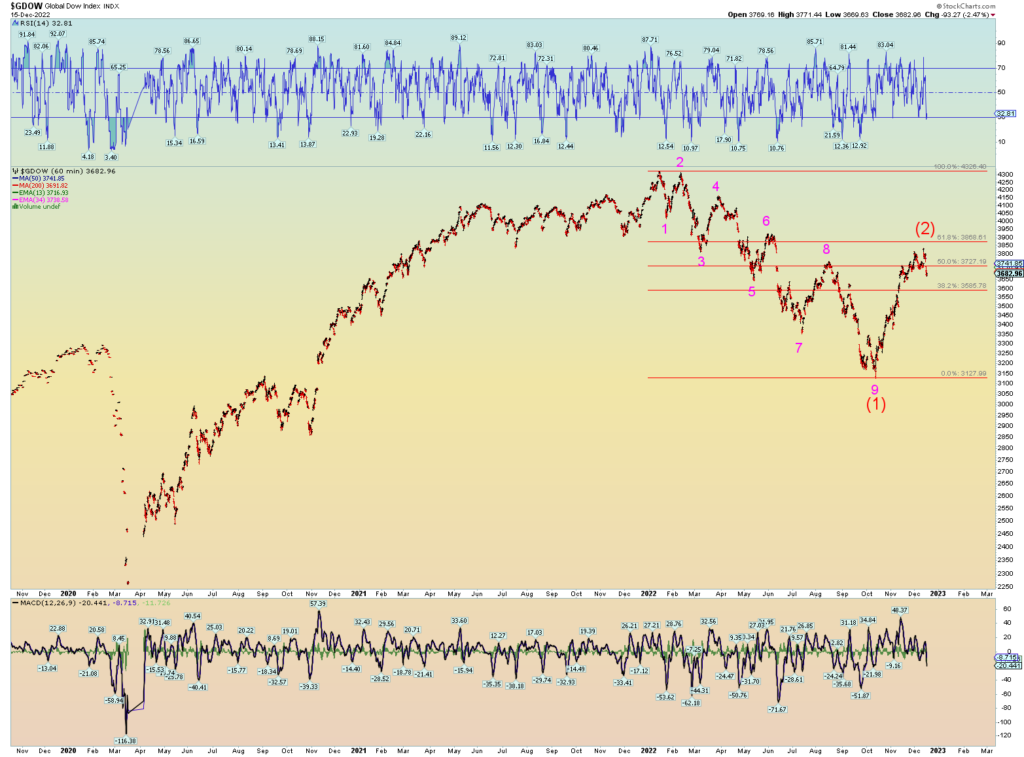
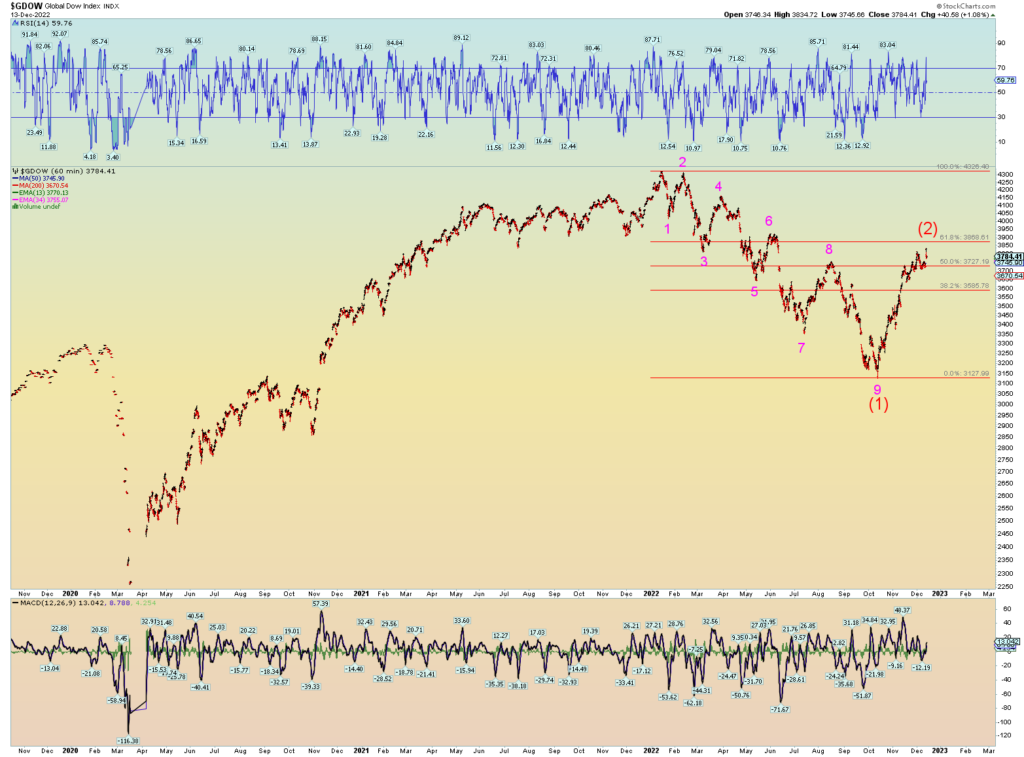
The DJIA has been more stubborn in giving up prices since the January peak and more persistent in its retraces. The positive RSI divergence has already been fulfilled with prices soaring over Minute [iv] of 1 of (3) whereas the other indices are lagging in that regard.
NYSE. Today’s advance/decline ratio was only 2.5 to 1.
If the Fed were to raise rates today, it would be a 3/4-point raise. There are signs that the rise is slowing as the spread between the 3 and 6 month its narrowing.
What people don’t understand is that the Fed cannot lower rates with the 3- and 6-month short term rates at their present levels. It is the market that drives rates, not the Fed. And people will counter that the Fed controls the 3- and 6-month yields that is not true.
At any rate, the Fed funds has always stayed within market range or else there would be extreme distortions. Imagine if the Fed cut rates tonight by 1%. to a target window of 2 – 2.5%. With the 3- and 6-month rates being double that, what kind of distortions do you think that would create in the way the Primary Dealers handle the overnight paper markets and other short term market making funding schemes (of which there are too many to count)?
The Fed would lose money is the bottom line. And as much as people like to think the Fed serves “we the people” they are a private bank first and foremost.
So, the Fed follows the market, so they do not lose money. it’s that simple. Rates go up, they must follow. Rates go down, they must follow. This is the same way all Central Banks operate more or less. In Europe, real rates went negative, and the ECB decided to follow along and set a negative funding rate which was probably a mistake which presents tremendous duration risk.
The real rates in the U.S. also went negative, but the Fed set the floor at 0% as to avoid overly long-term complications of which the ECB is starting to experience. But alas, it won’t matter.
It’s all a Ponzi, make no mistake. Once debt/GDP ratio – which can be debated what the true number is – becomes greater than 100%, bankruptcy is sure to follow. We are 32 trillion in debt, and I think the GDP is more or less the same (and one could also argue that number is fudged beyond measure). It doesn’t take much of a GDP decline in combination of soaring interest rates to break the bank. This is where we are at.
That which cannot go on forever – won’t.
It is like a household that earns $100,000 and has $100,000 in credit card debt that is of course subject to prime + bankster robbery. A loss of income or lesser paying job will break that household very easily. An interest rate of 9% going to 14% and loss of income to now only $65,000 means it’s game over. And the interest compounds until one must declare bankruptcy which of course wipes out the debt and effects the banks that “funded” it. It’s a cascading situation. And interest (usury) is evil and ungodly and of course its run mostly by adherents to Judaism or Jewish offshoot Freemasons. Both groups are doing the work of the Satan to bring about the New World Order. Complete financial “reset” is part of that plan.
There will be no “Fed pivot” because it is all a lie, and they have setup the masses to think otherwise. 30 years of “market conditioning” will do that to you. But the rug is being pulled out all the same.
They just don’t want to be blamed too much. But they are to blame all the way since 1913 and the creation of the Fed monster to begin with.
The primary count is that Minor 2 of Intermediate (3) is playing out. This could take some time. Minor 1 of (3) took about 41 trading days. Therefore Minor 2 could take some time for instance 21 trading days would be an example.
However, the important thing is that Minor 2 has the right “look”. An [a]-[b]-[c] pattern of some sort. Part of the right look is having the right price (and time).
The blue box is the target box. It looks about right and I do expect prices to go above Minute [iv] peak of Minor 1 down. Another touch of the 50 DMA perhap.