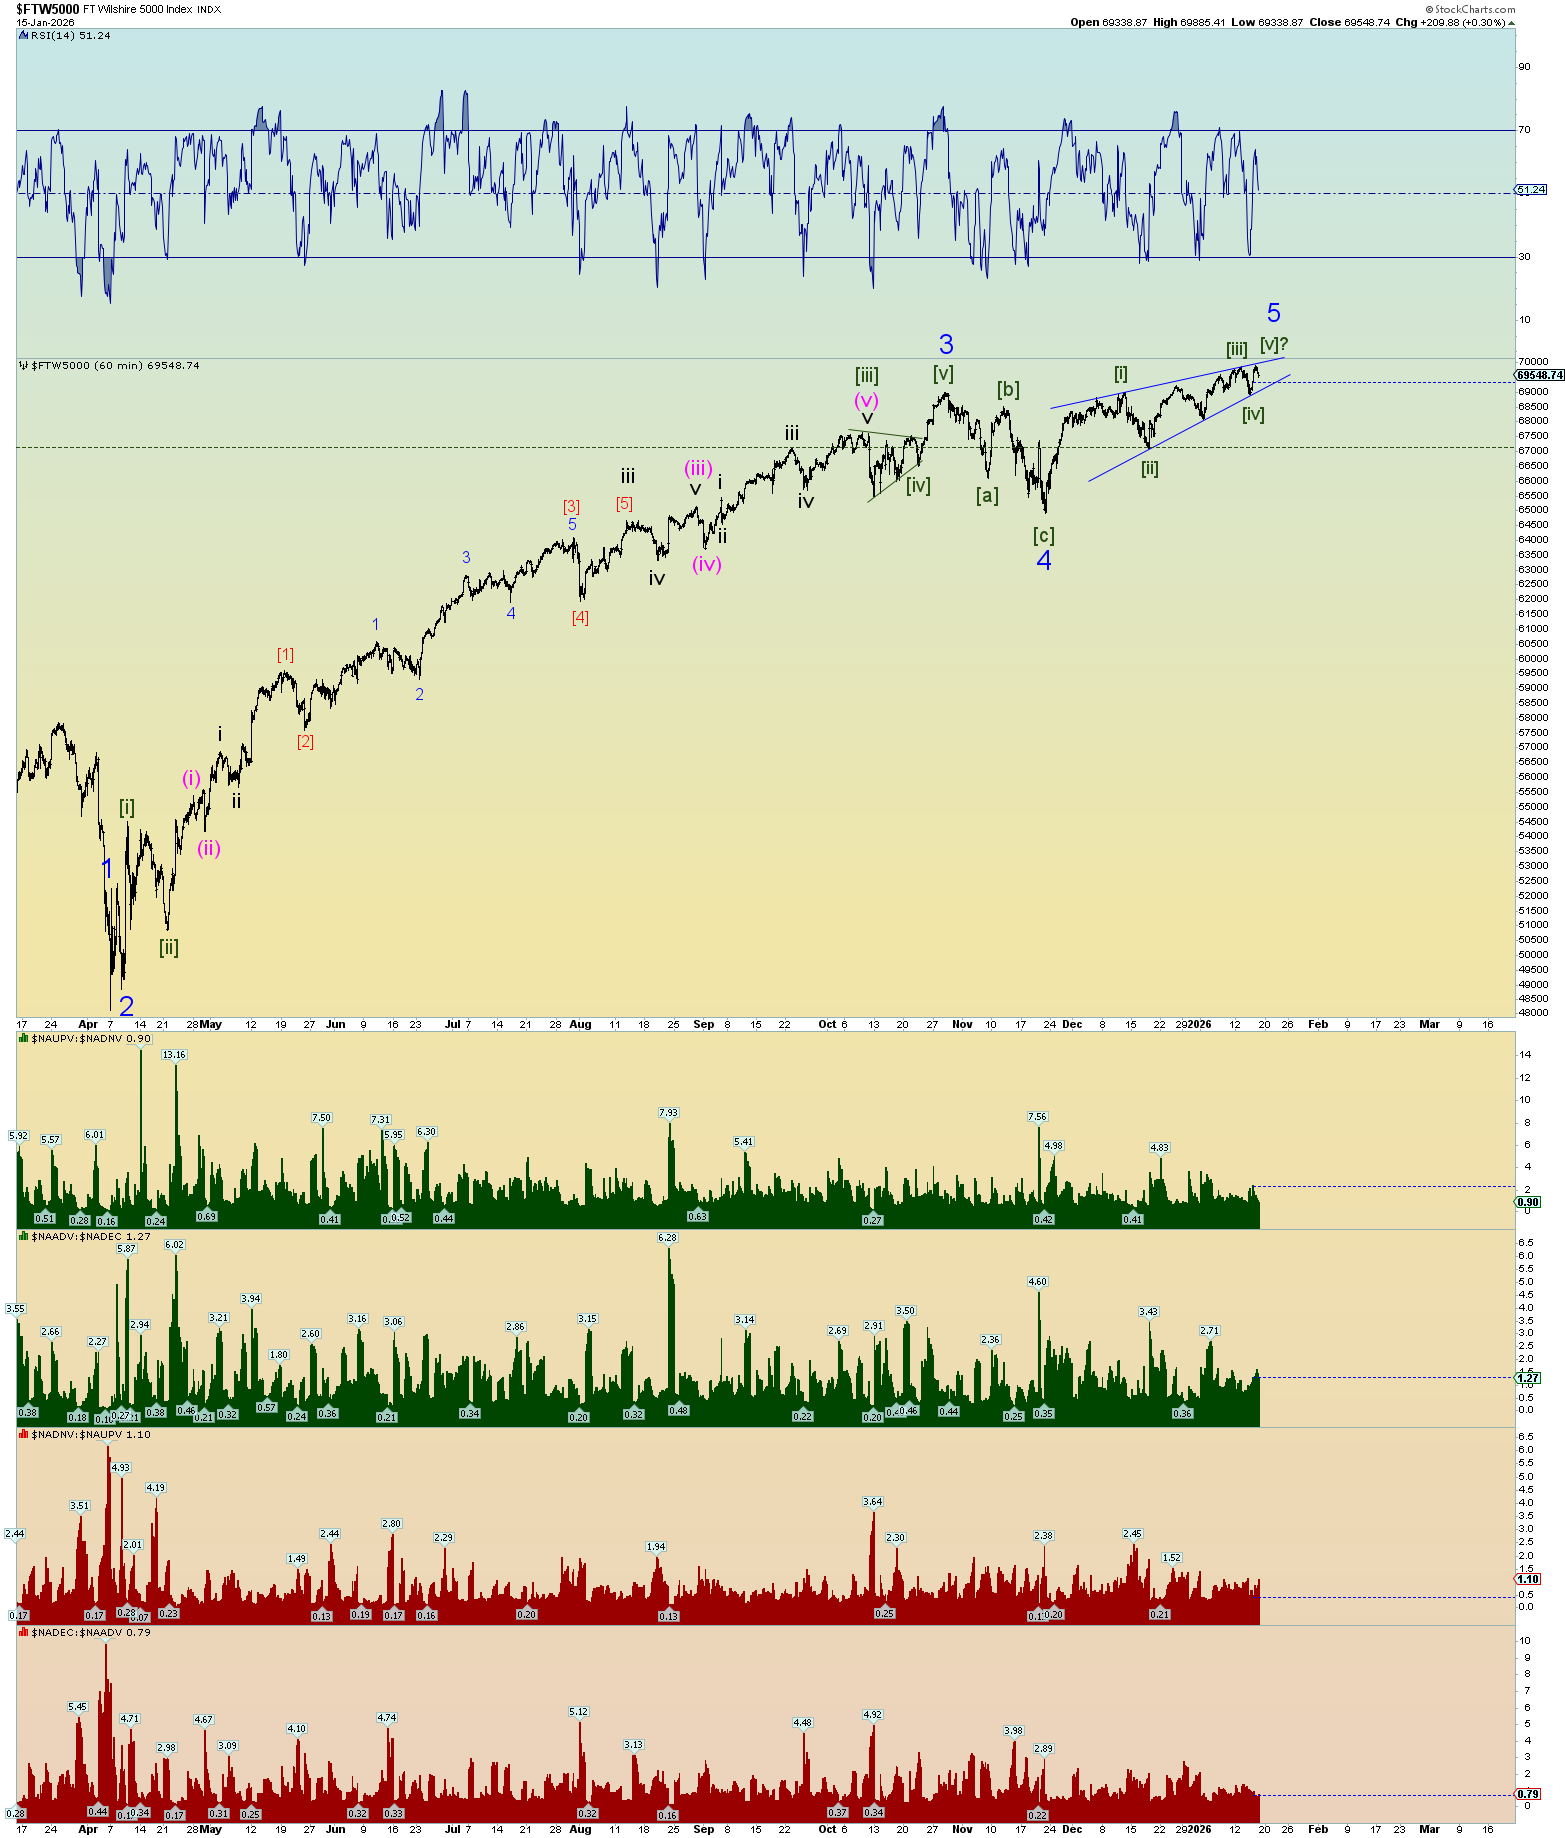
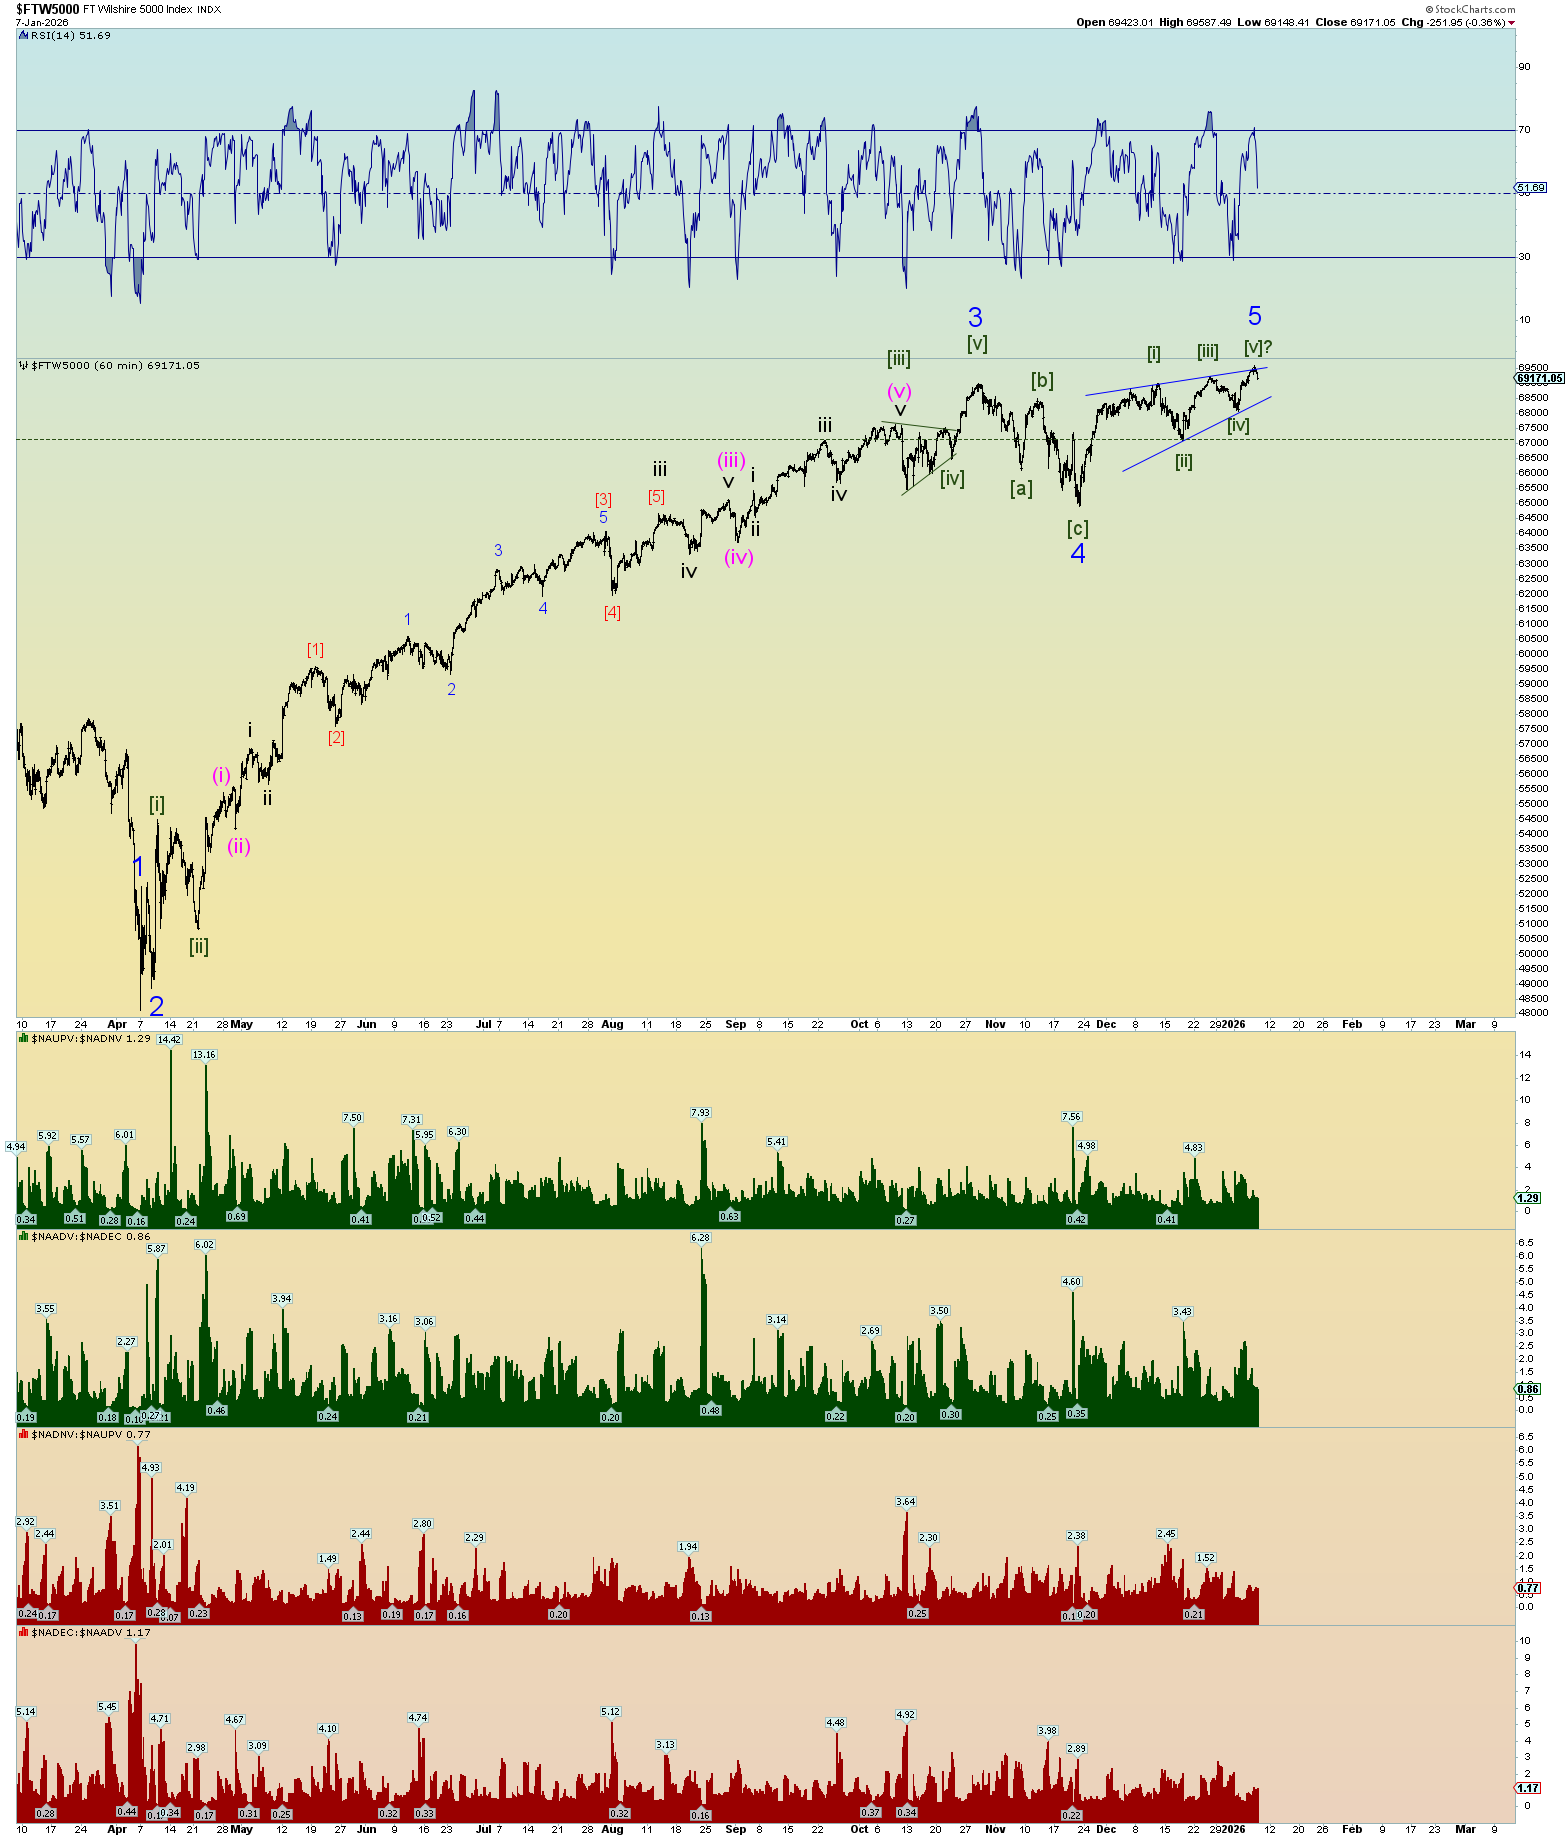
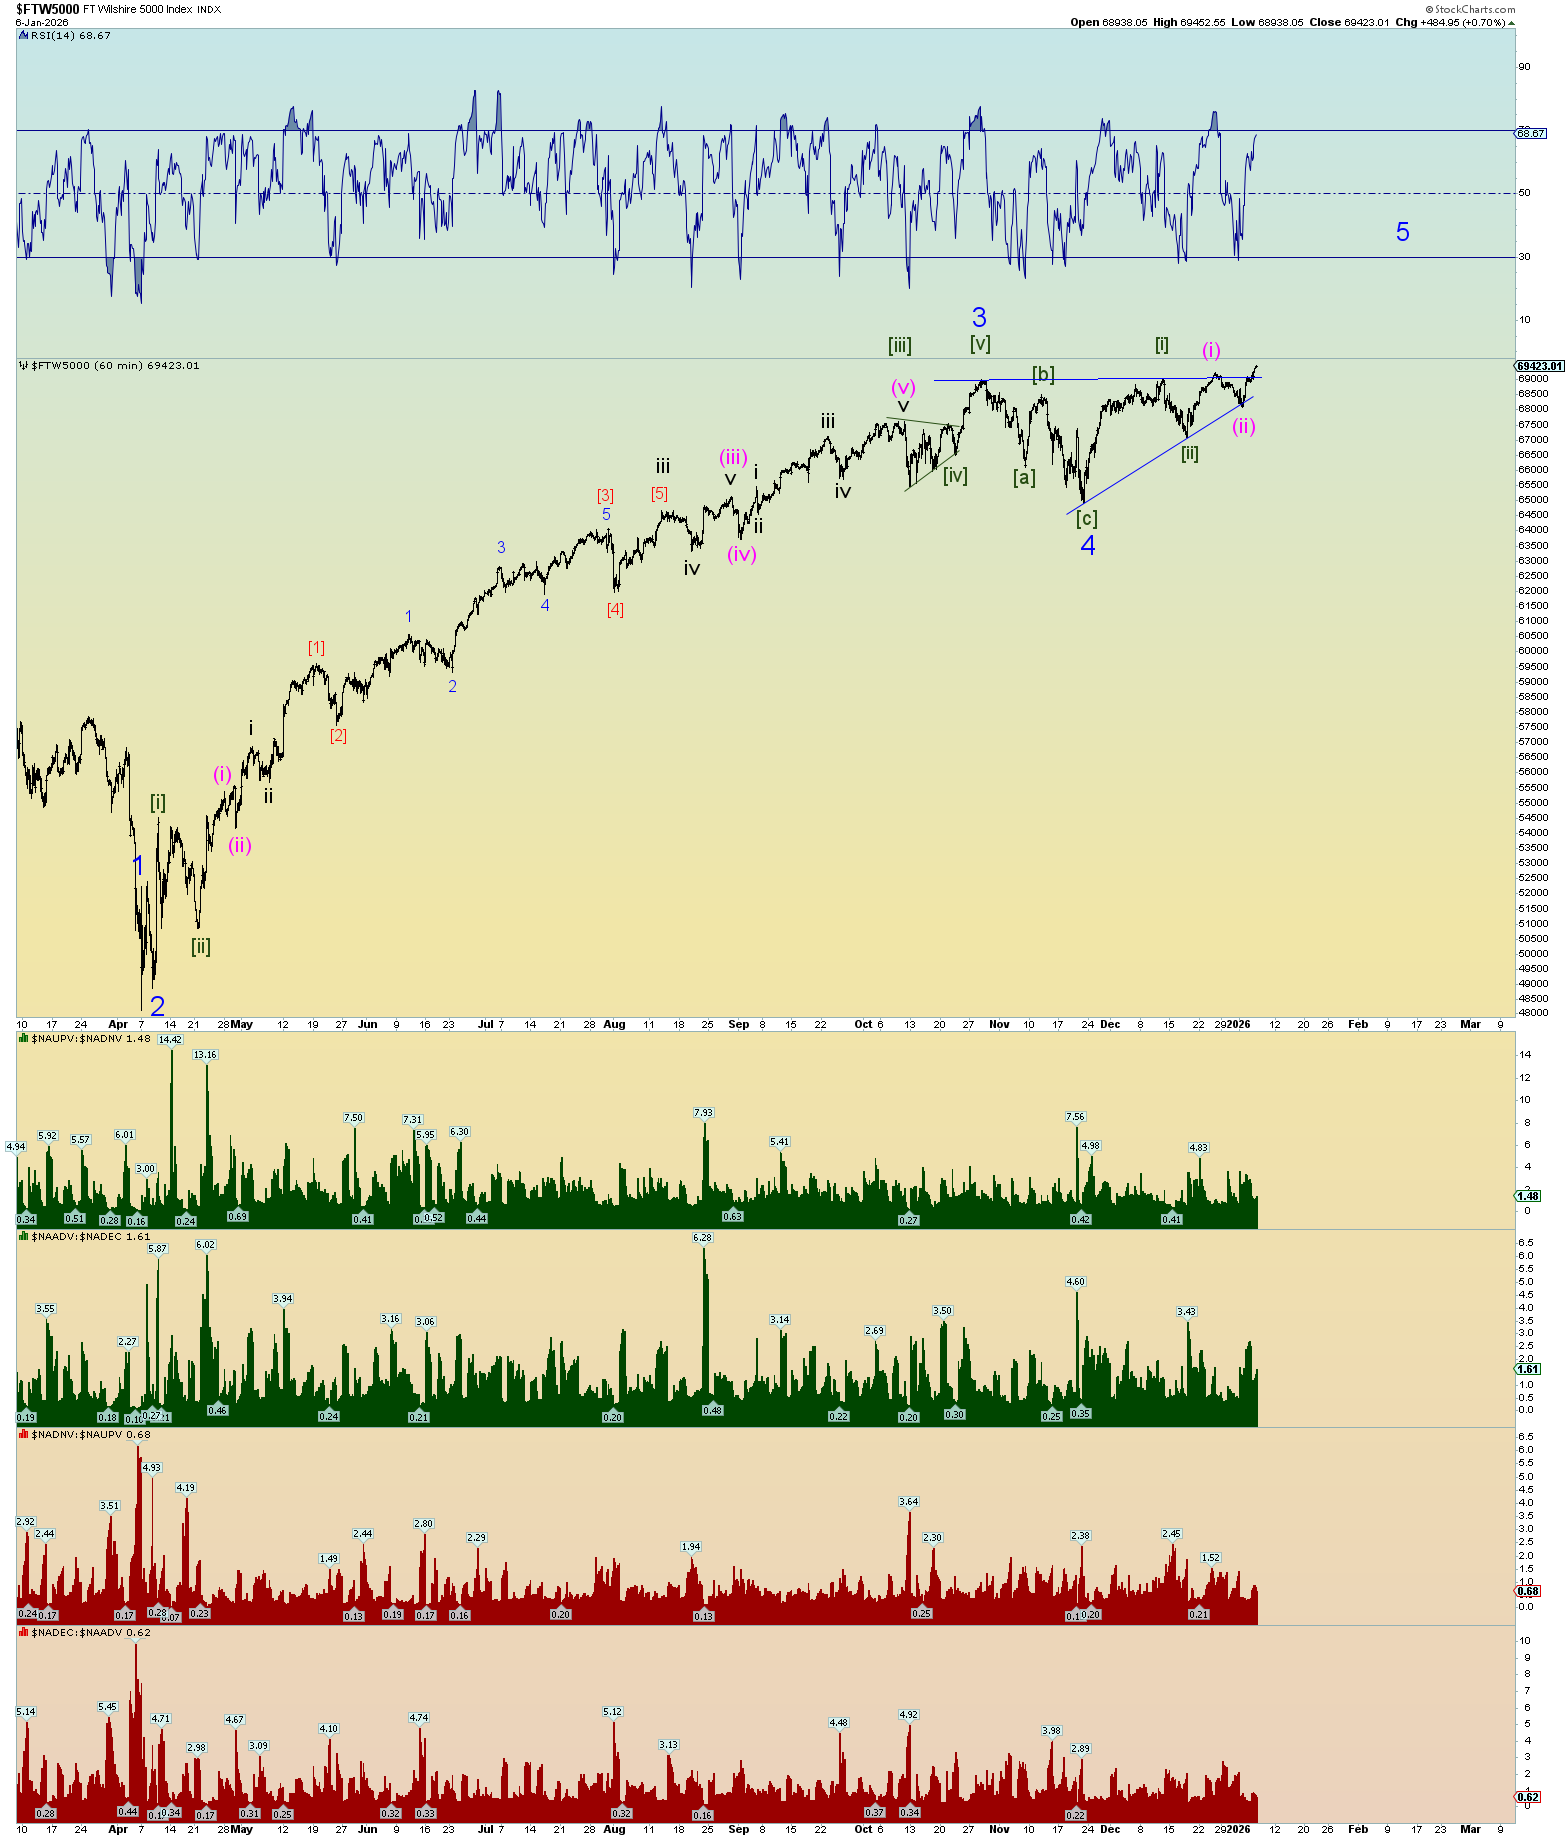
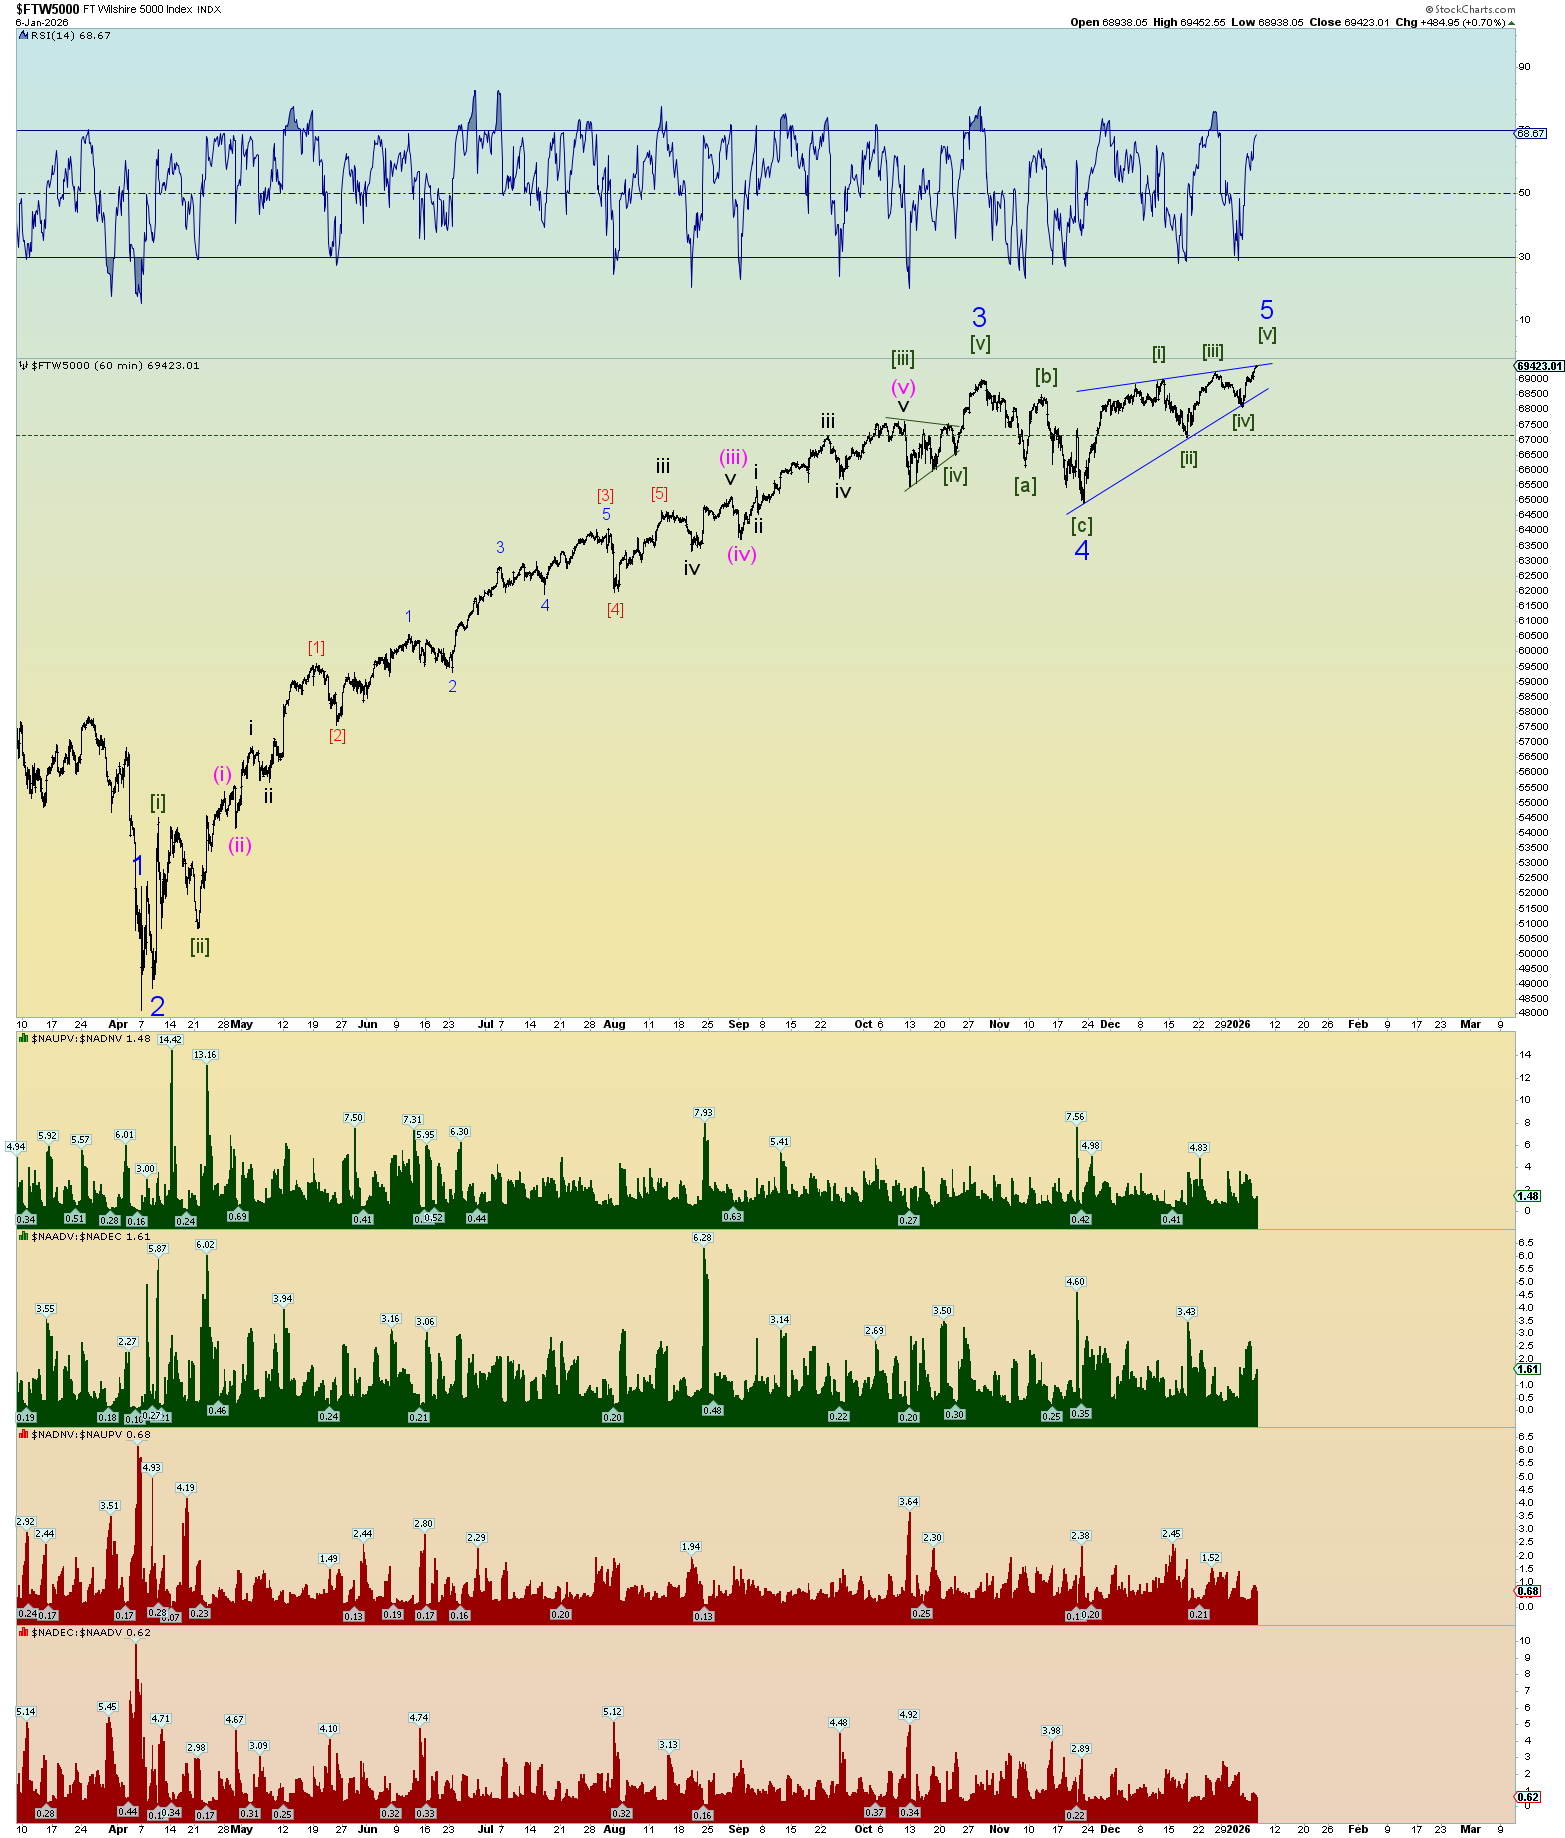
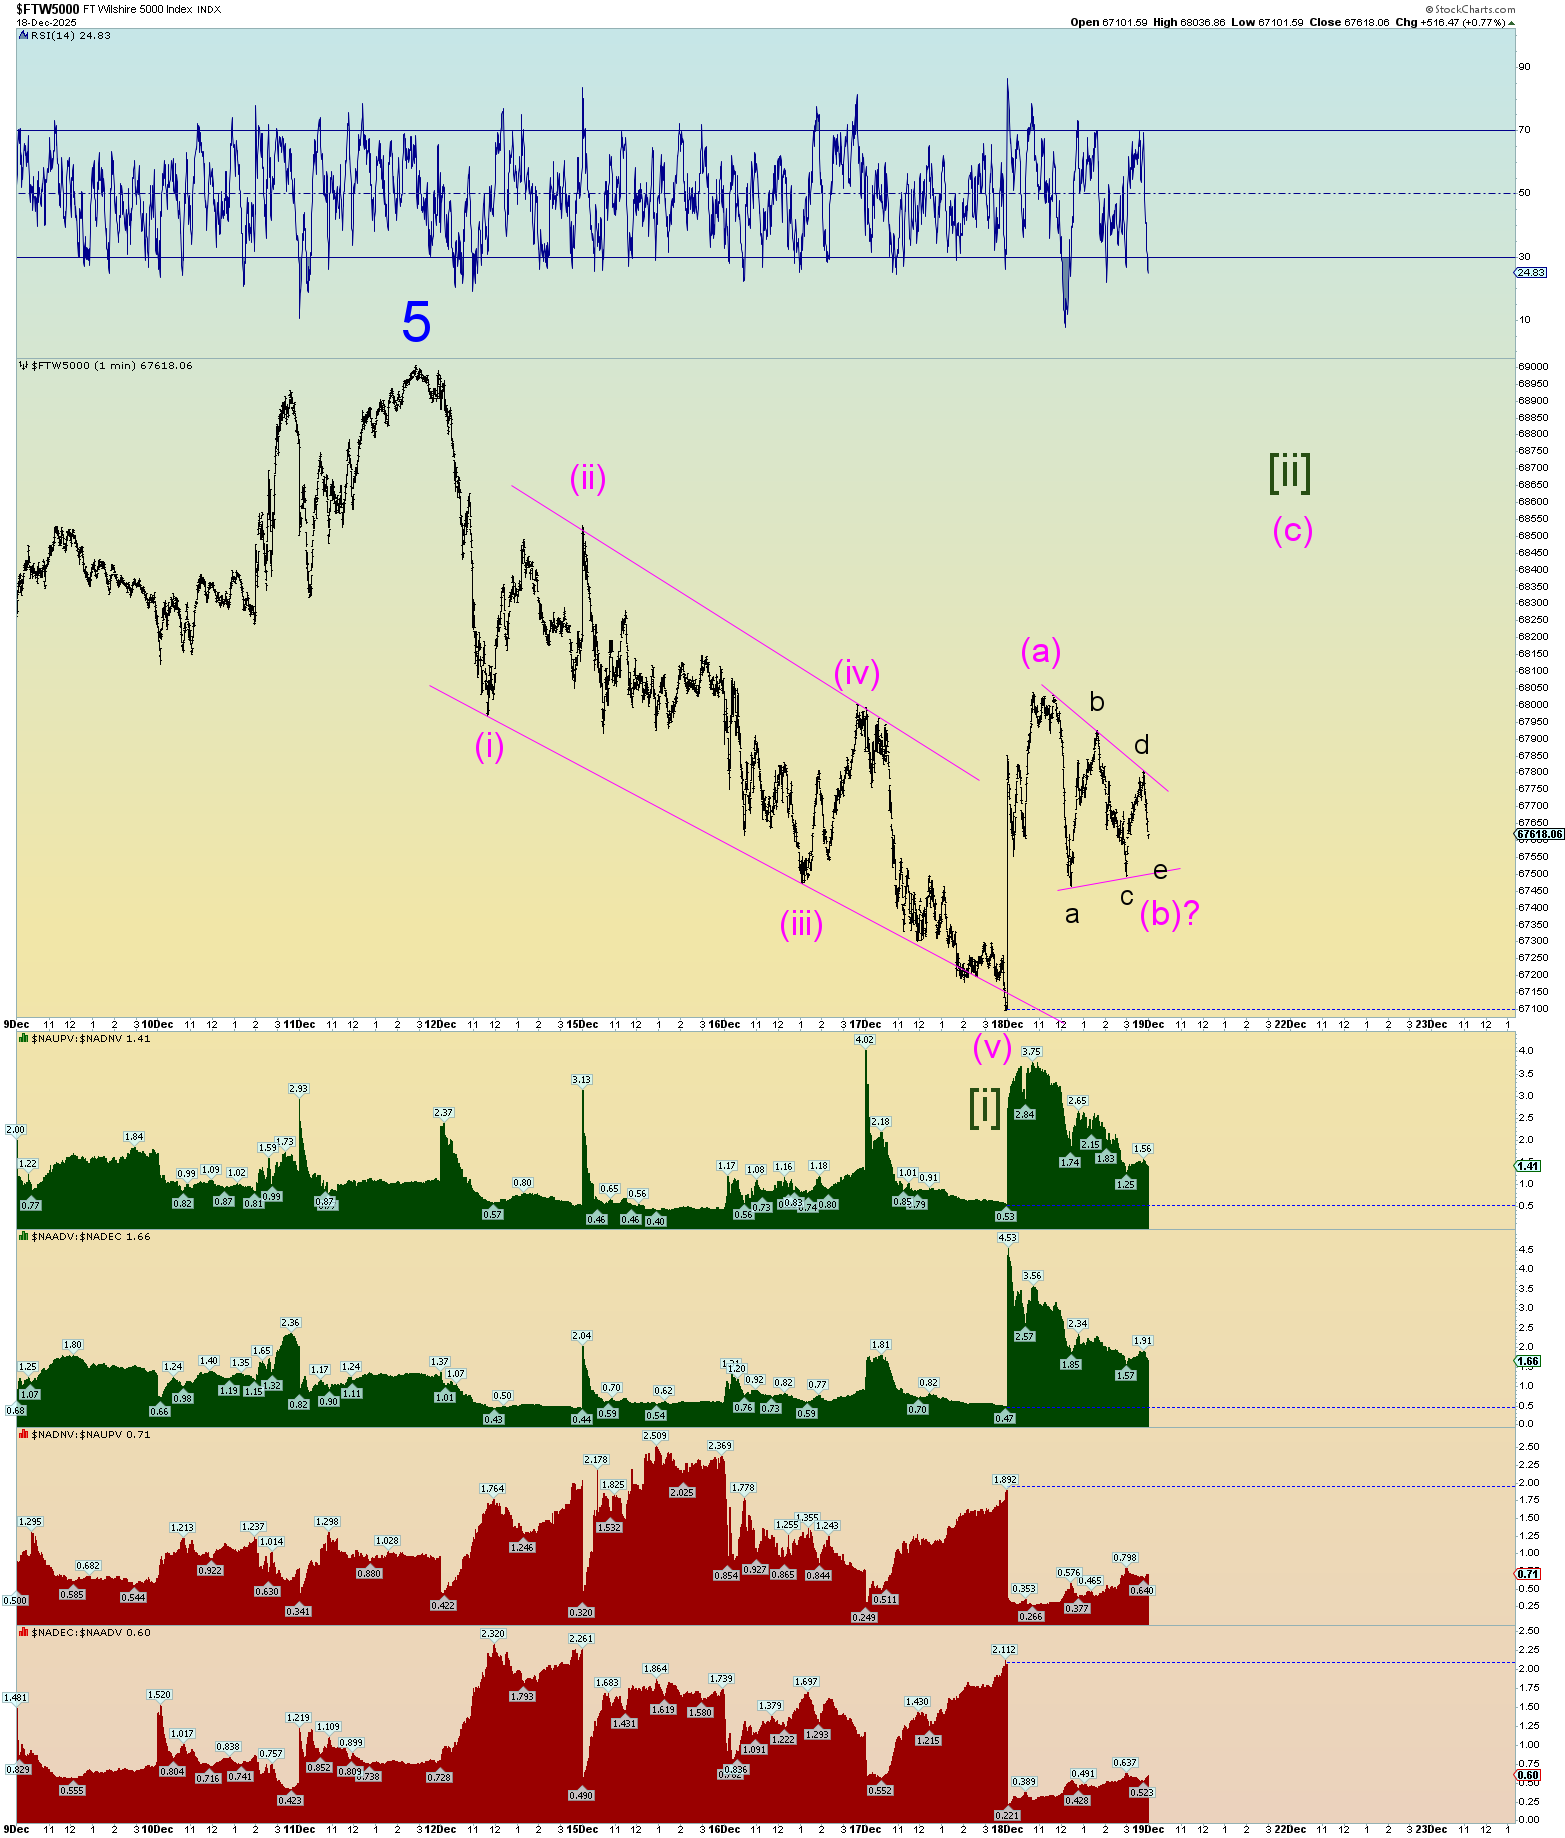
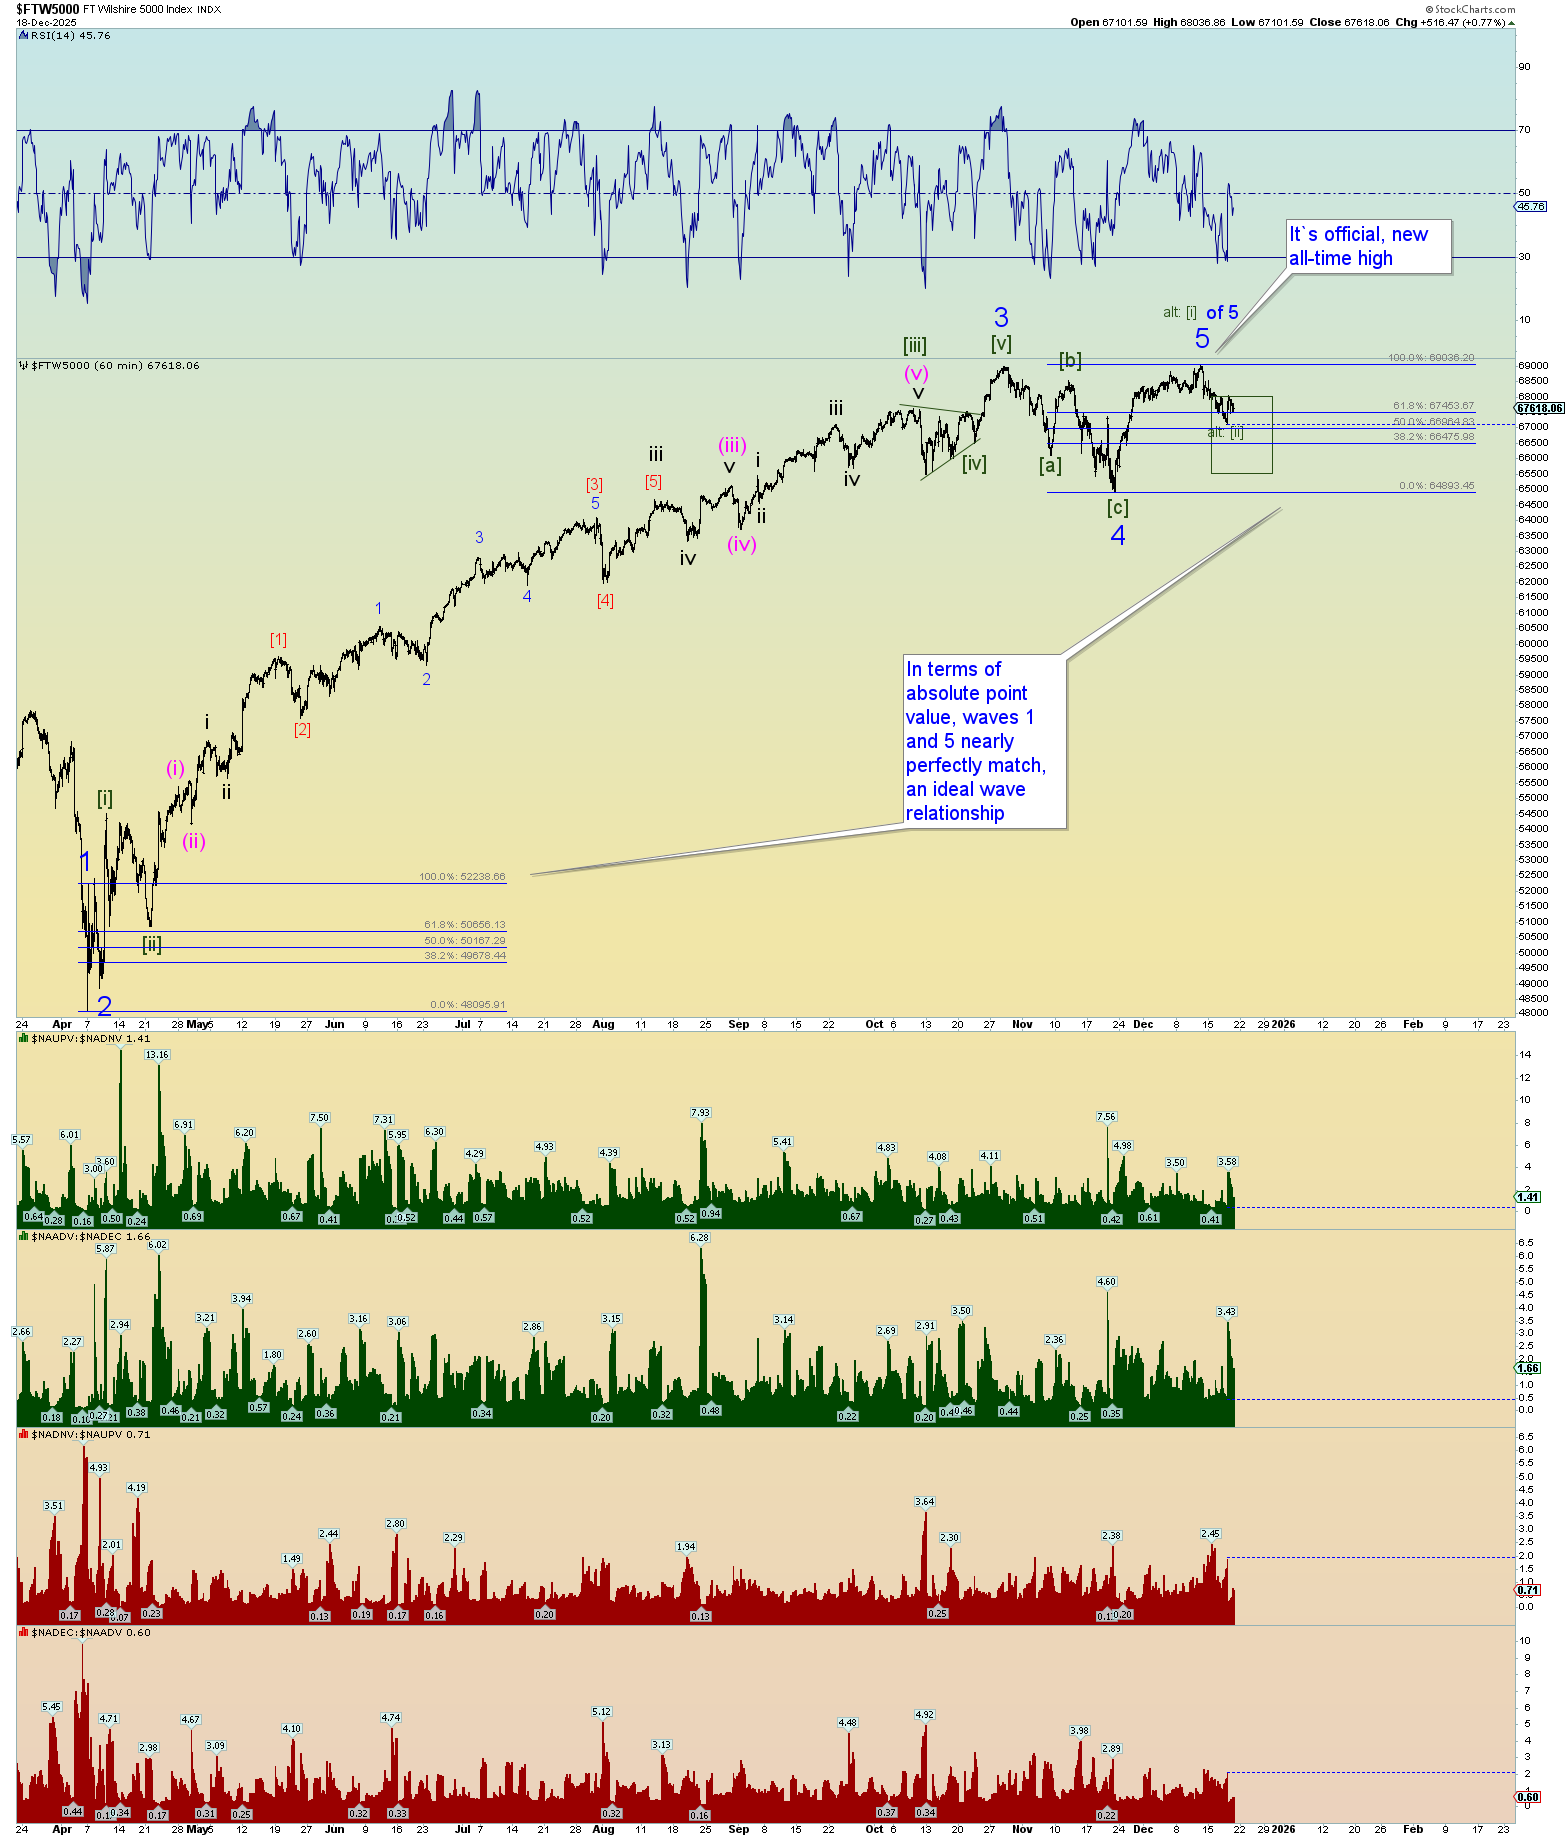
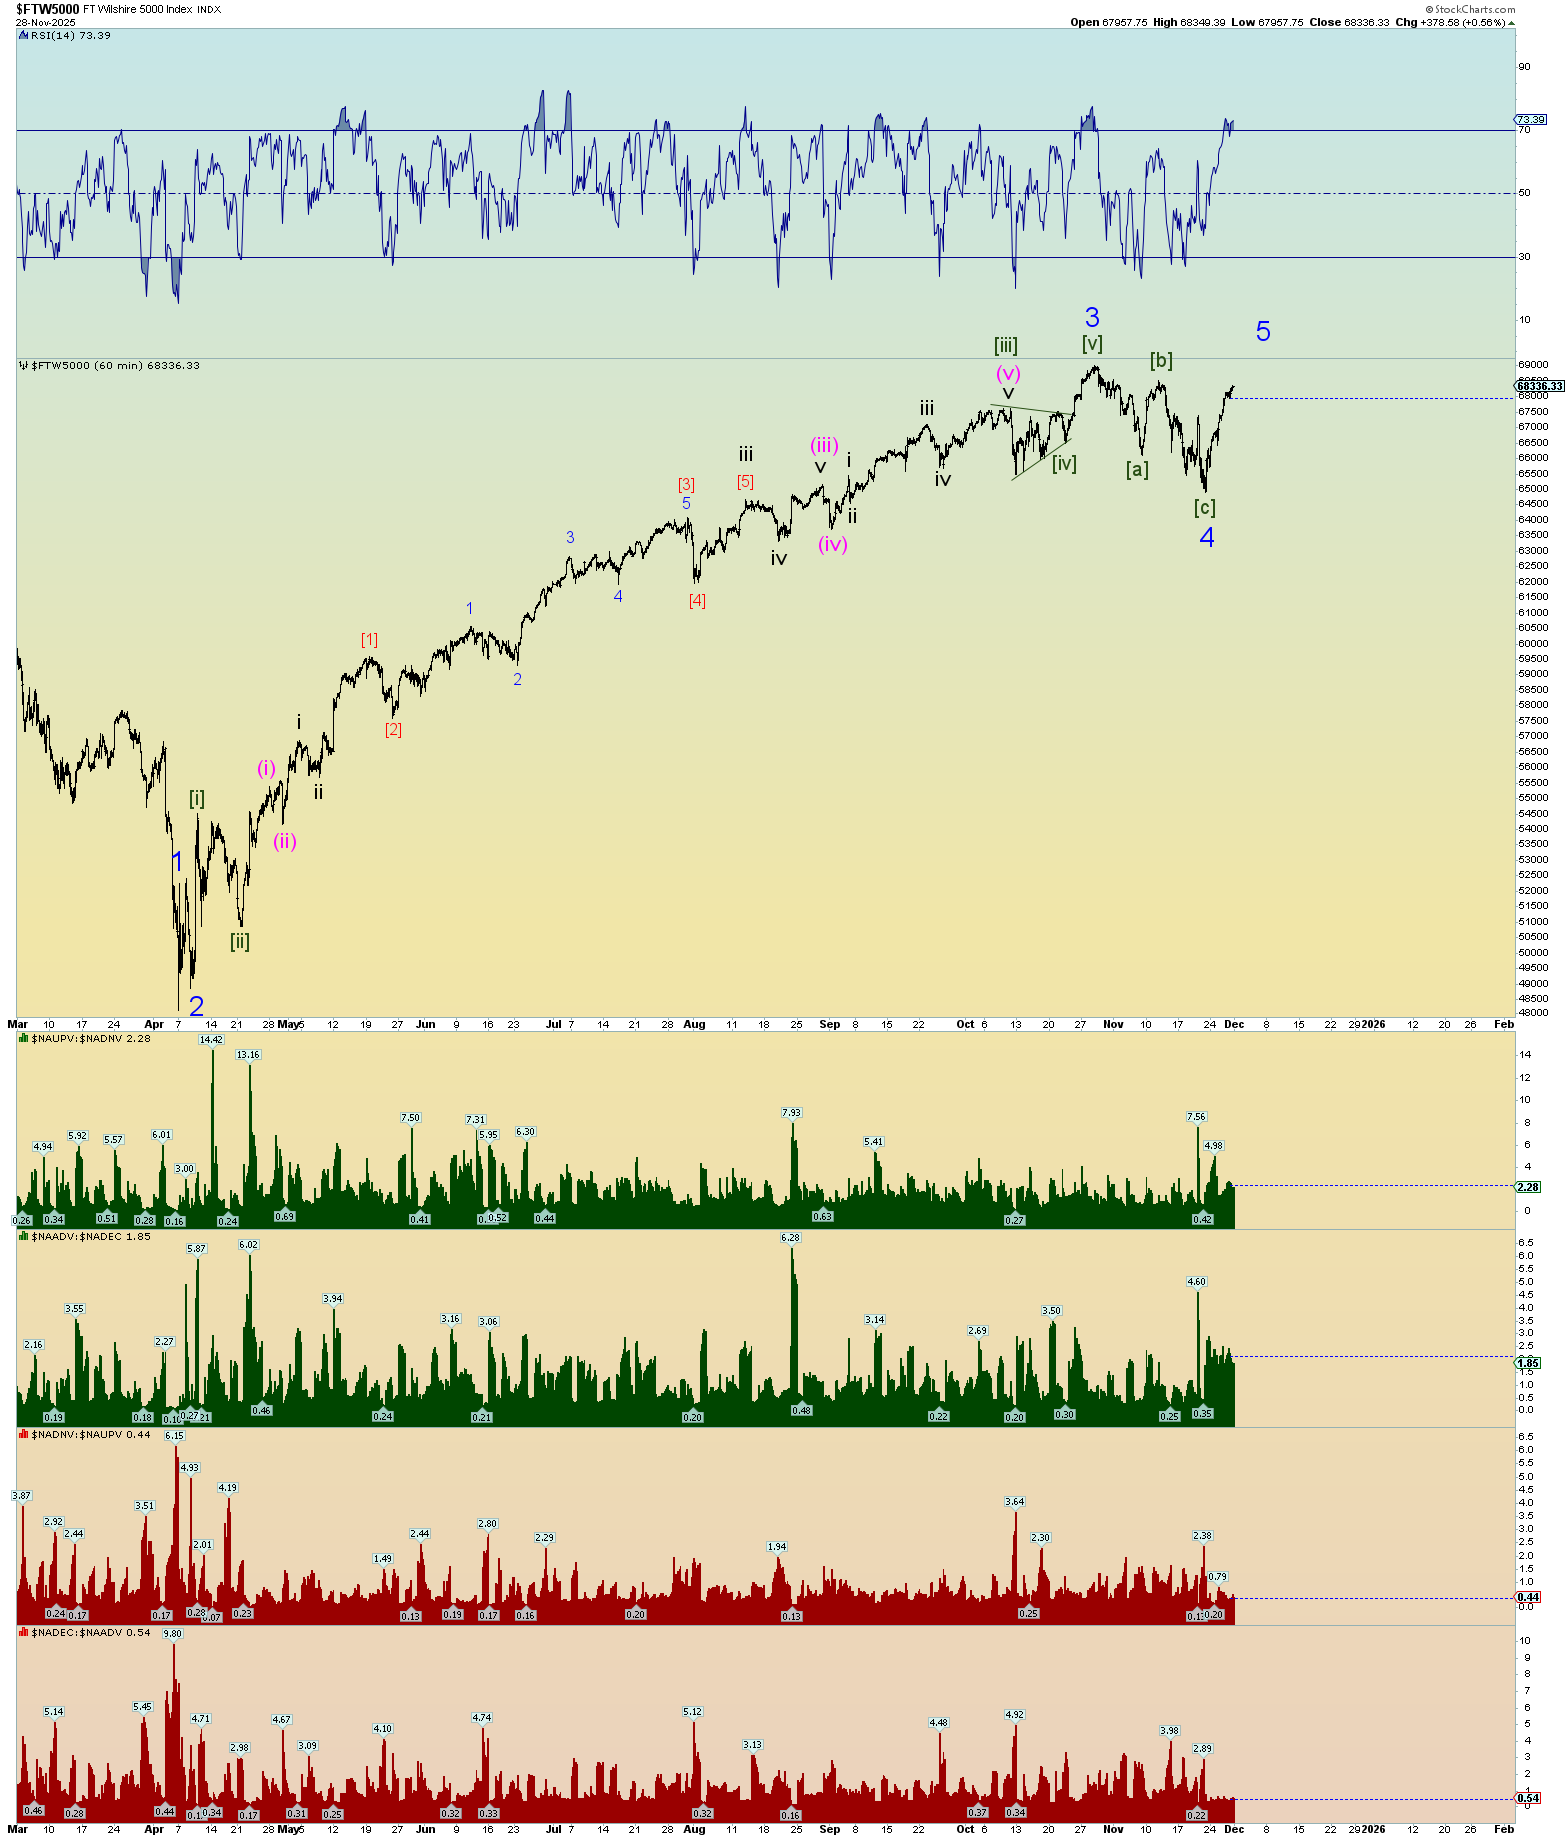
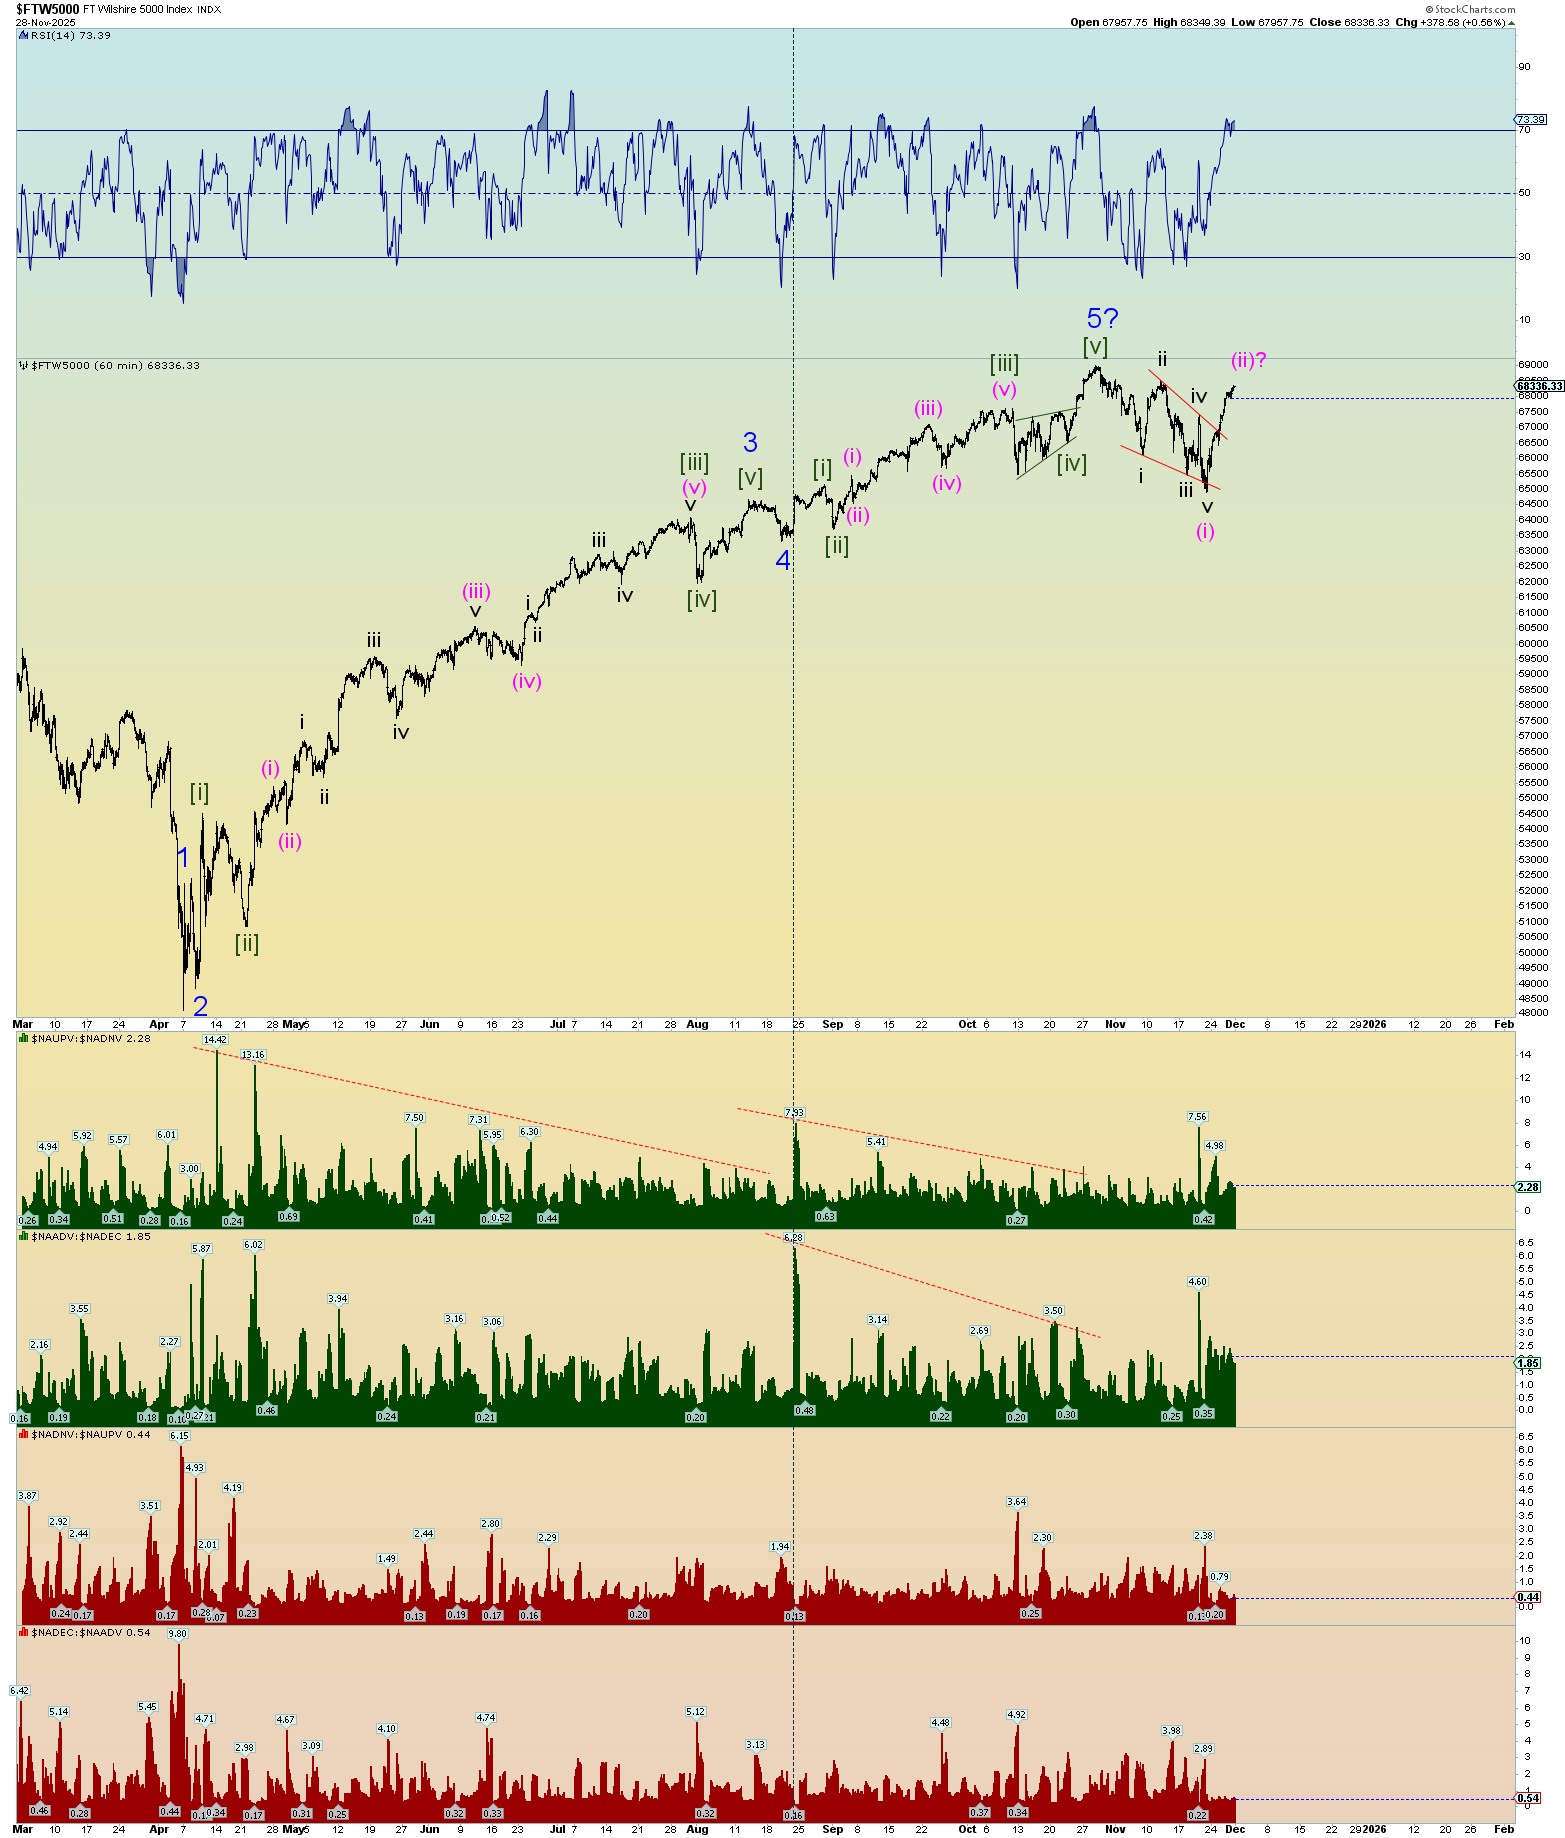
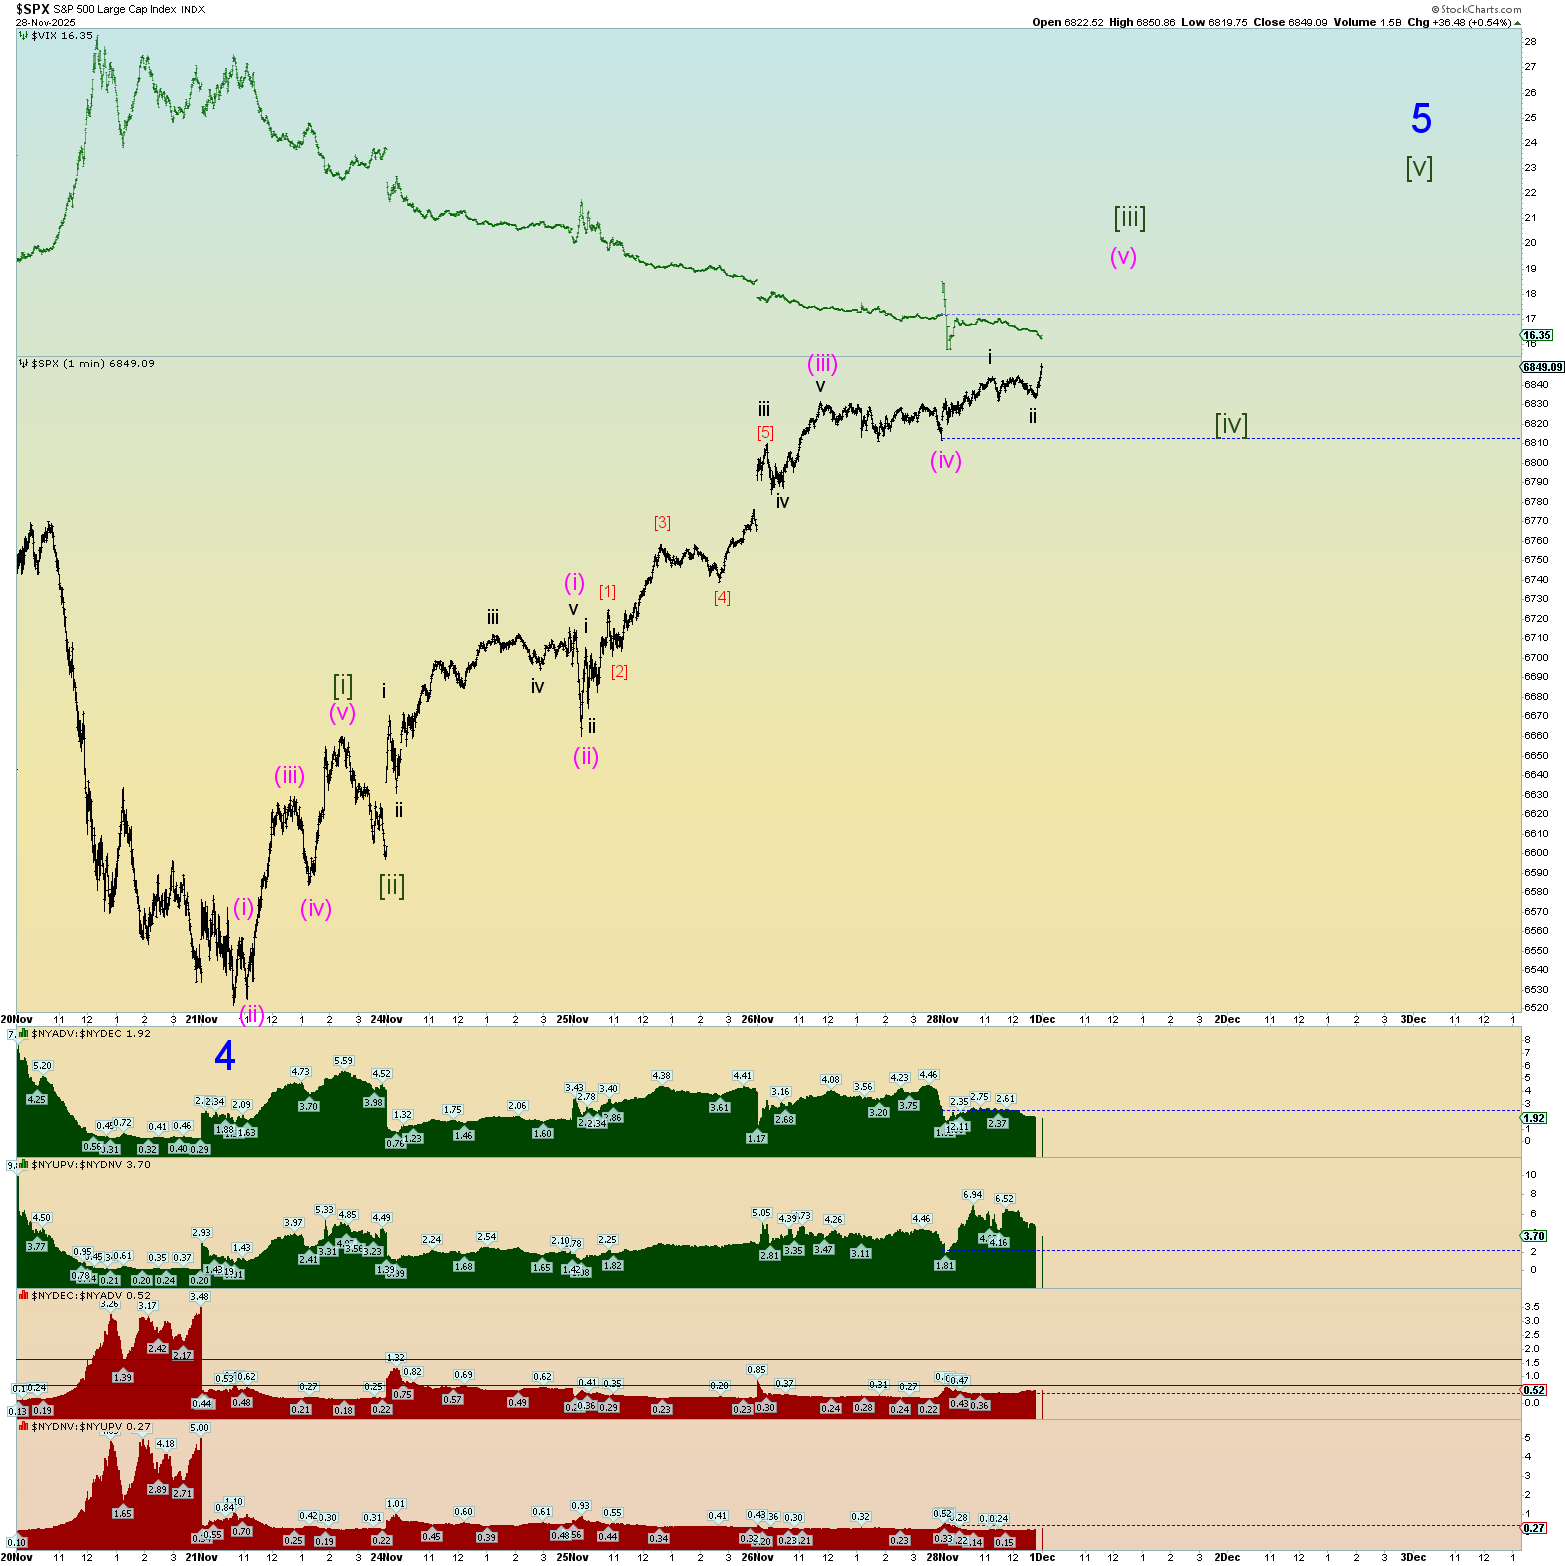
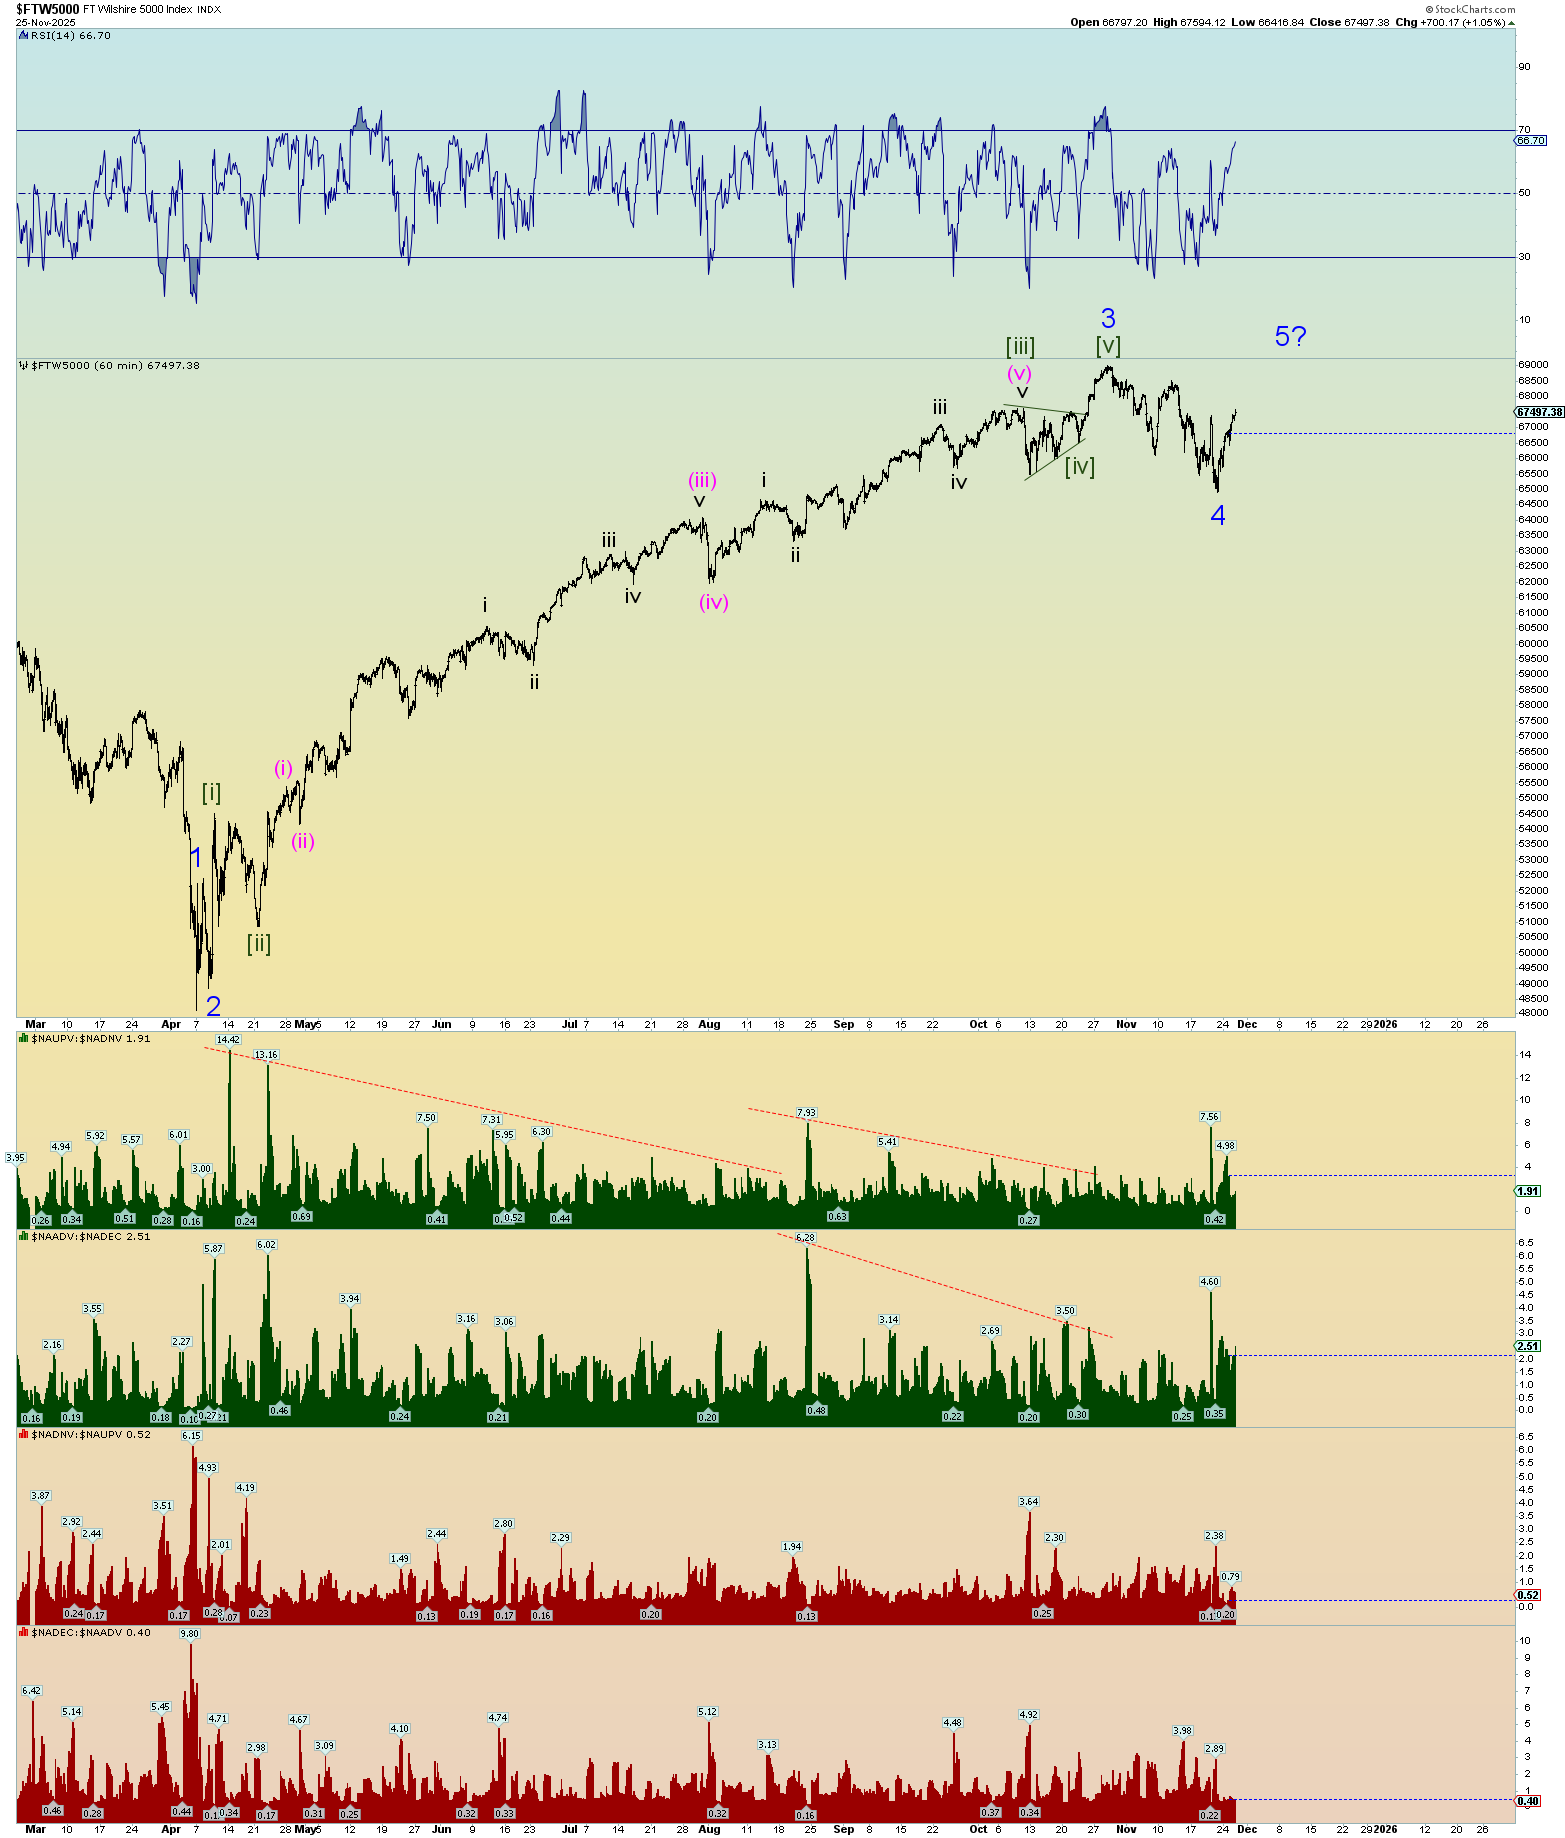
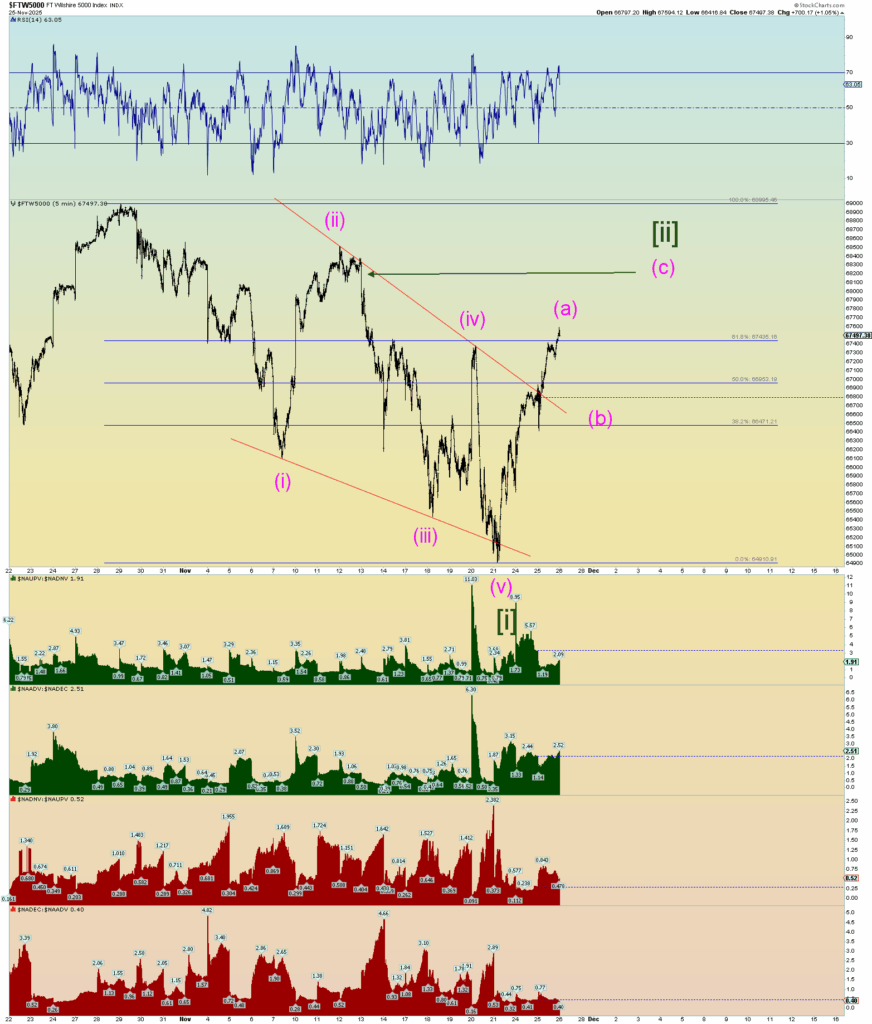
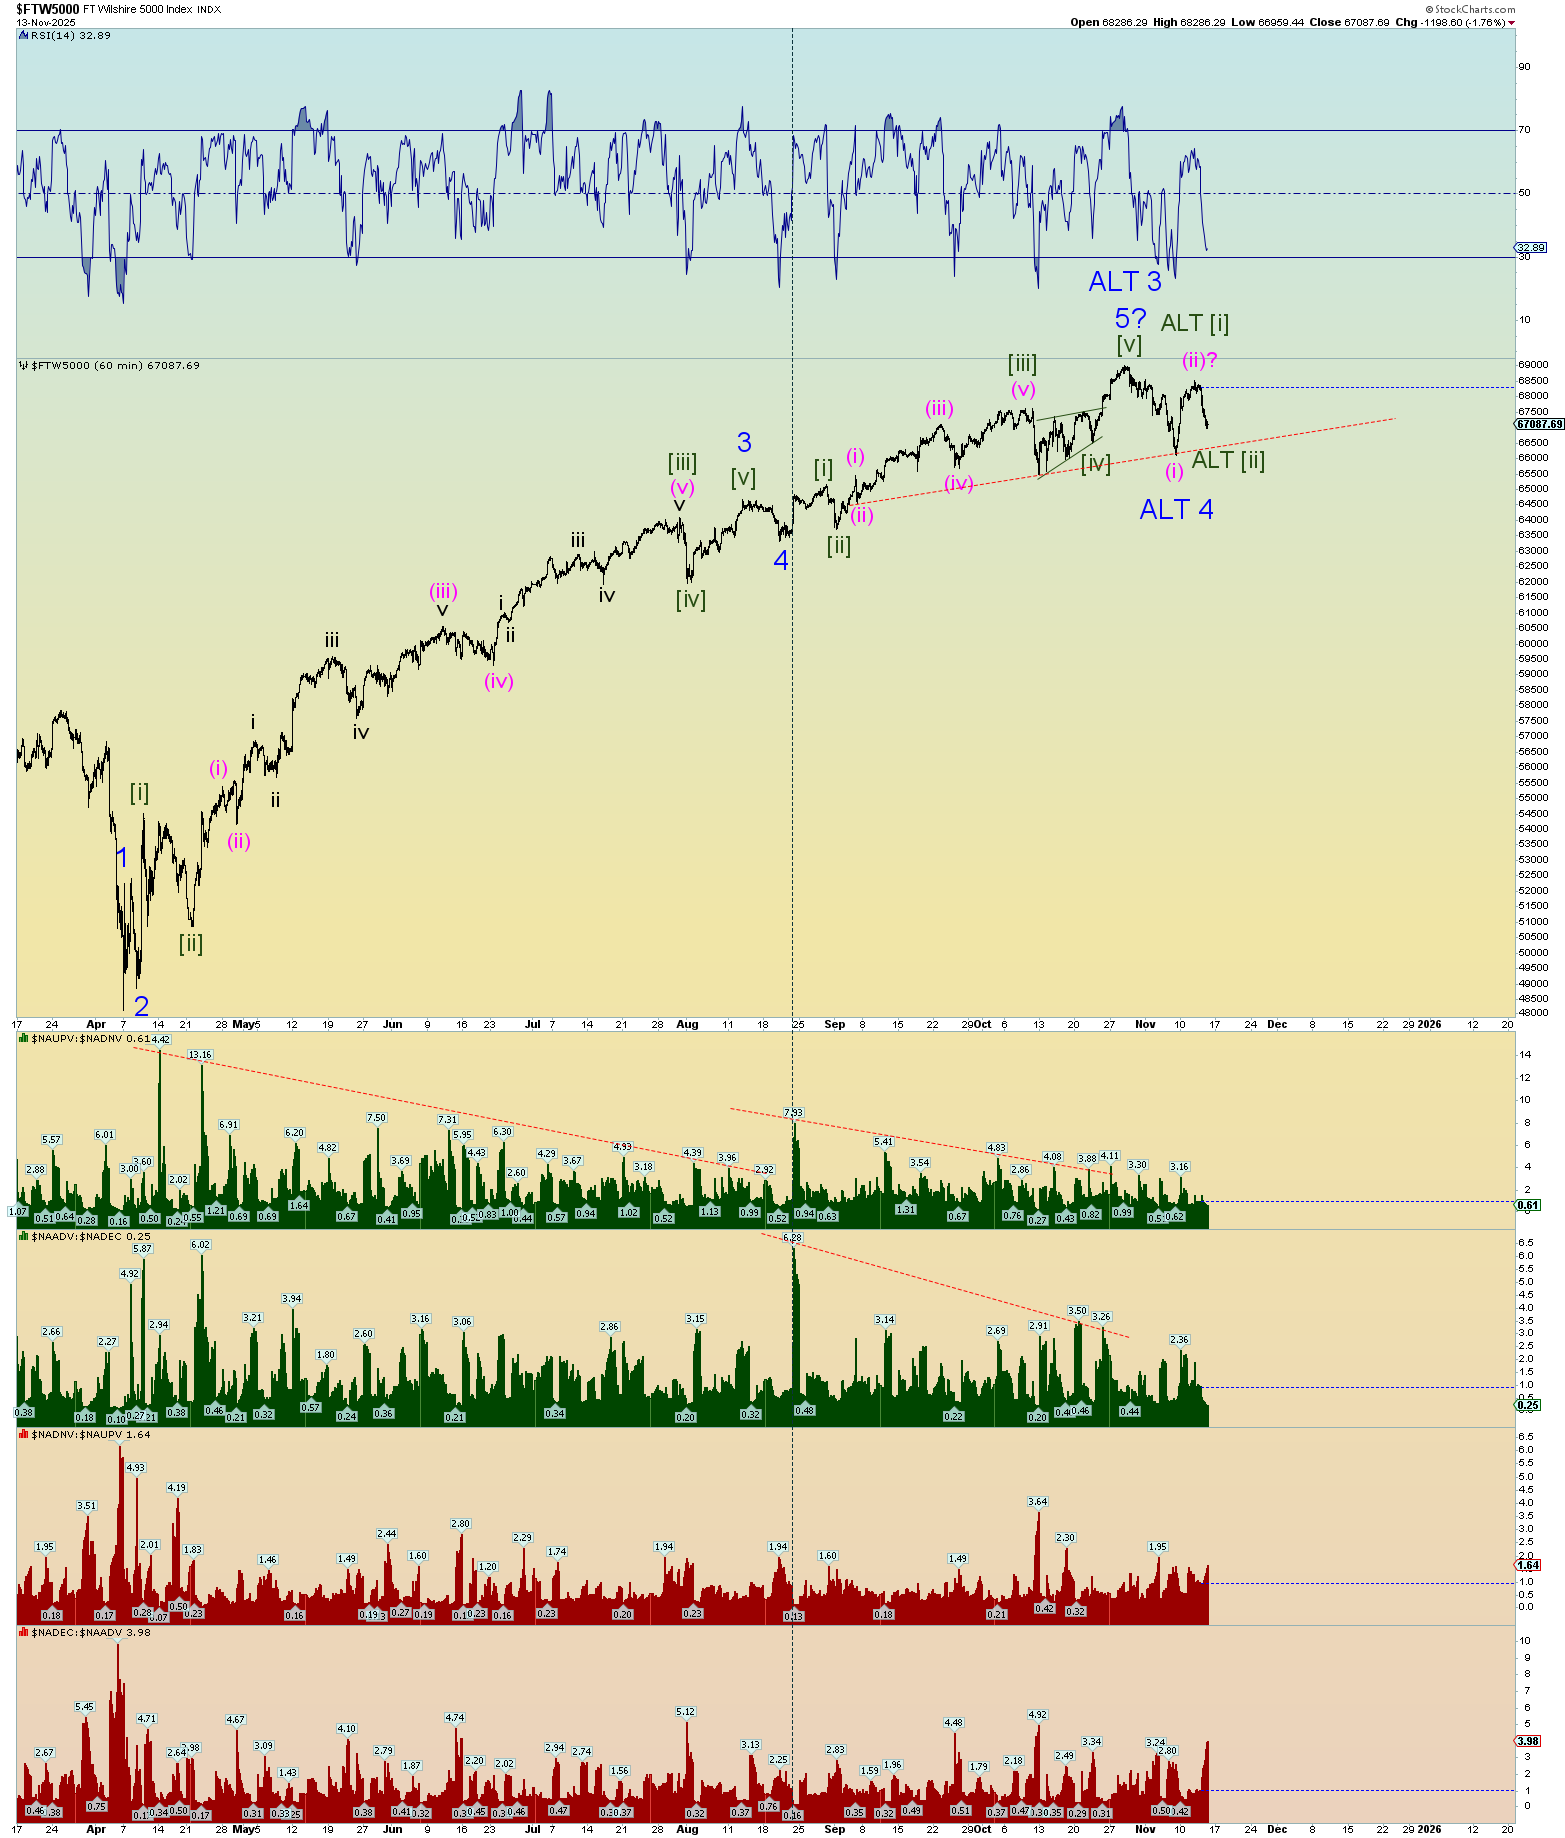
The potential ending diagonal triangle is still a possibility. But the primary count calls for an “upside surprise” in a third of a third.
The top alt might have made its high today. Yes, today was a new all-time high in the Wilshire 5000. There is even room for another pop up out of the gate tomorrow but then it would have to reverse.
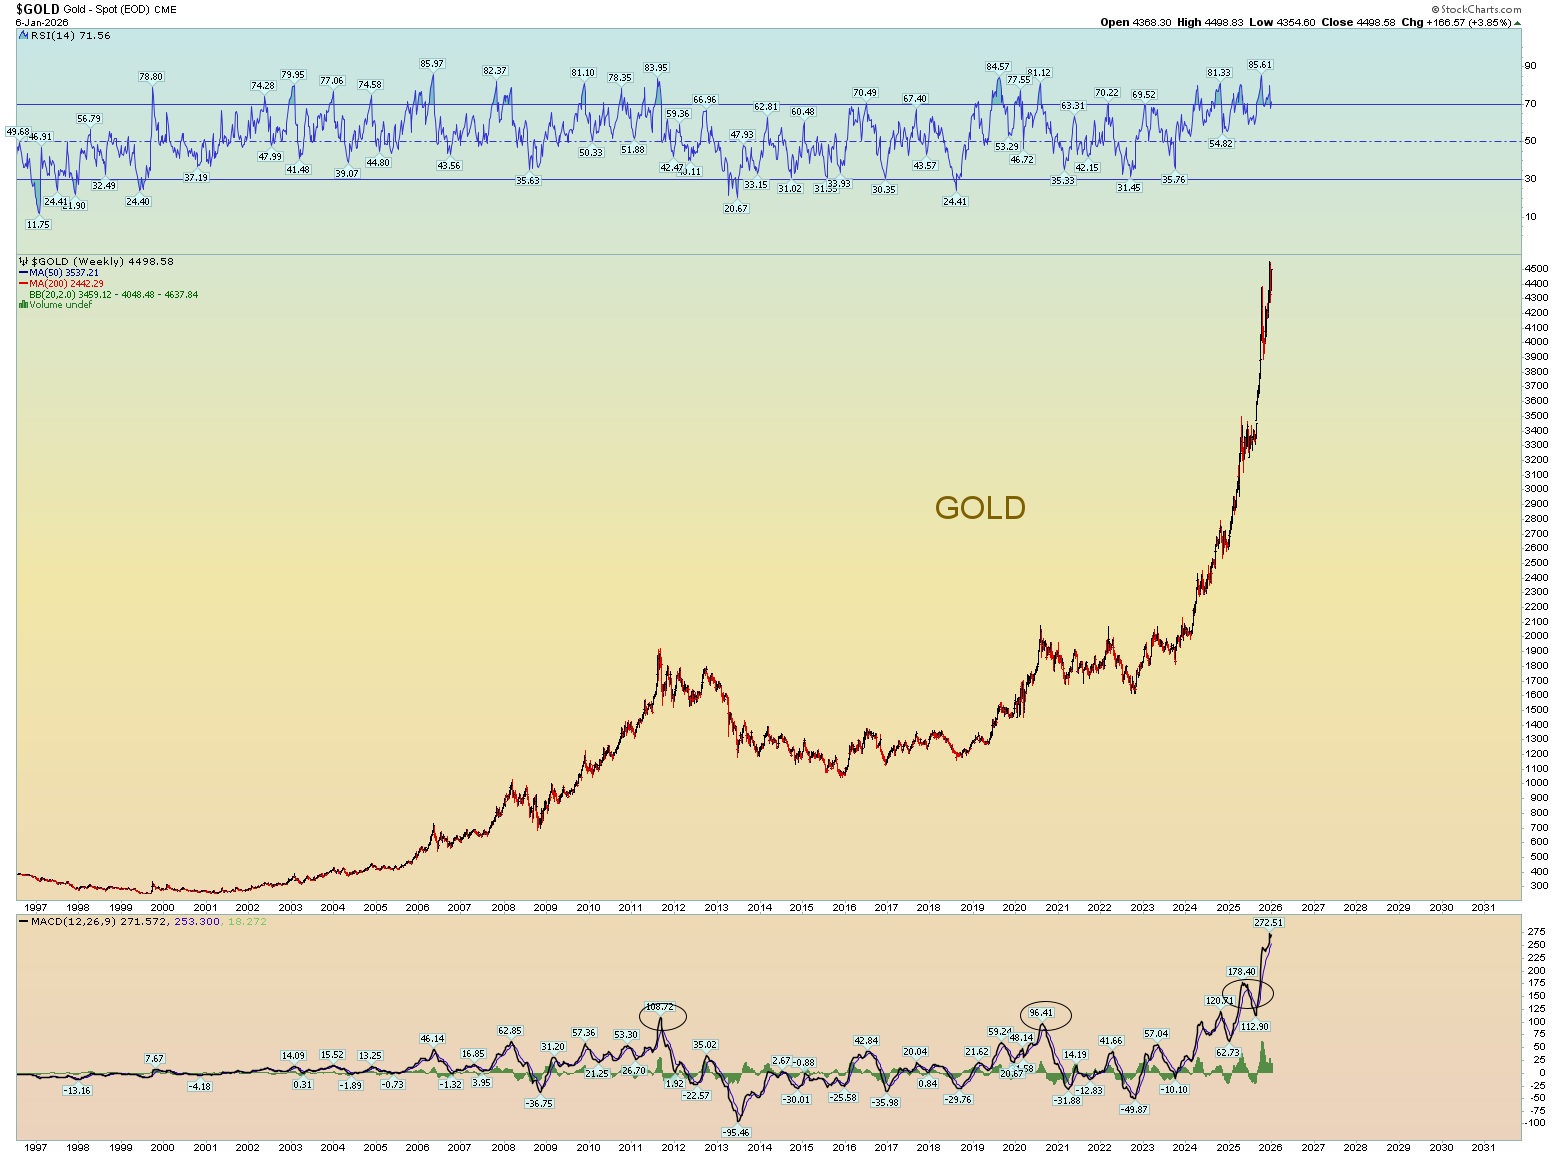
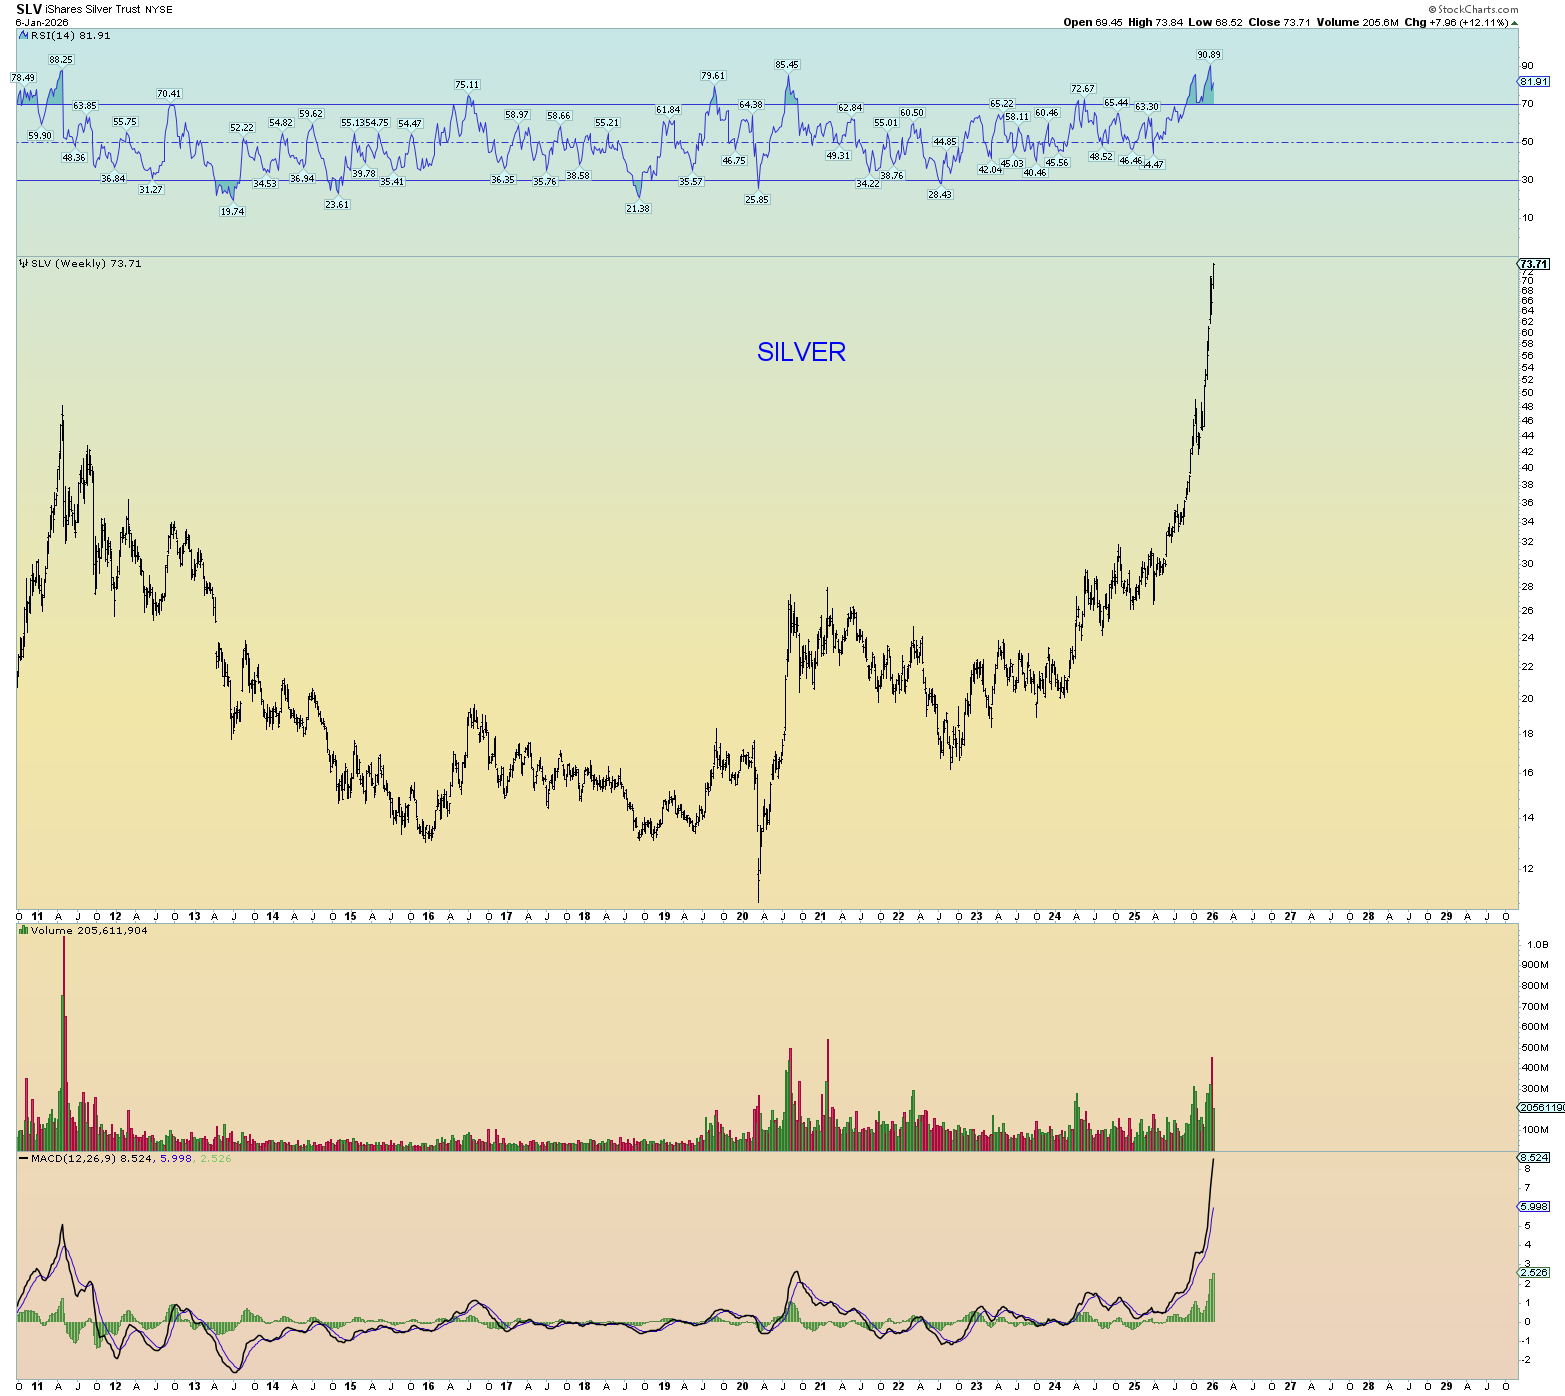
Sooner or later this long-winded bull count will end in spectacular fashion. The freak moves of Gold and Silver seem appropriately timed for this ending.
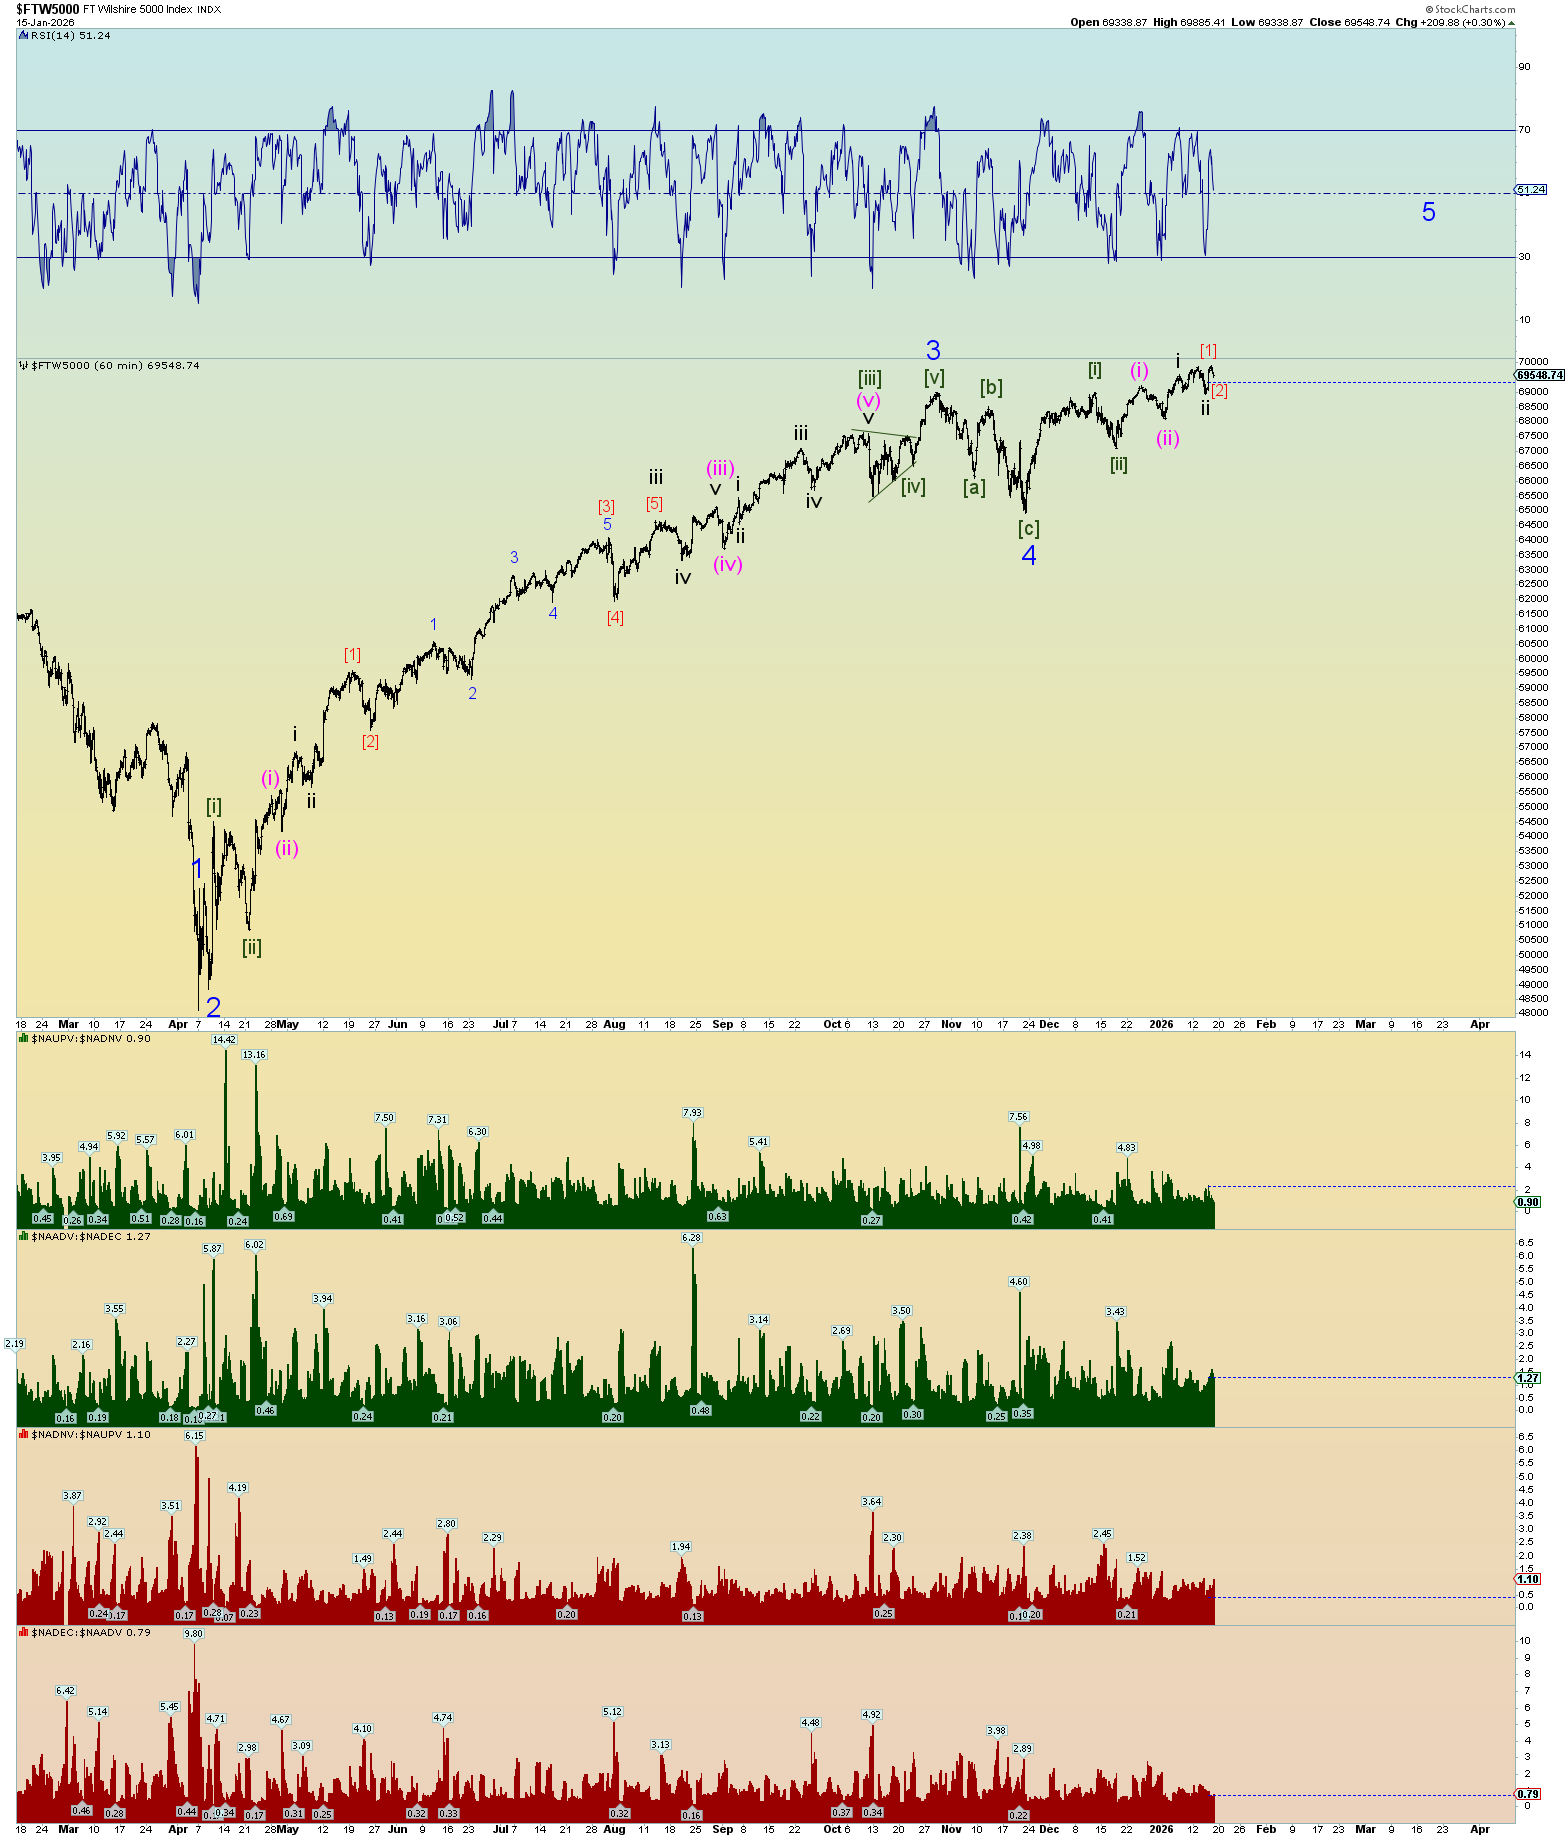
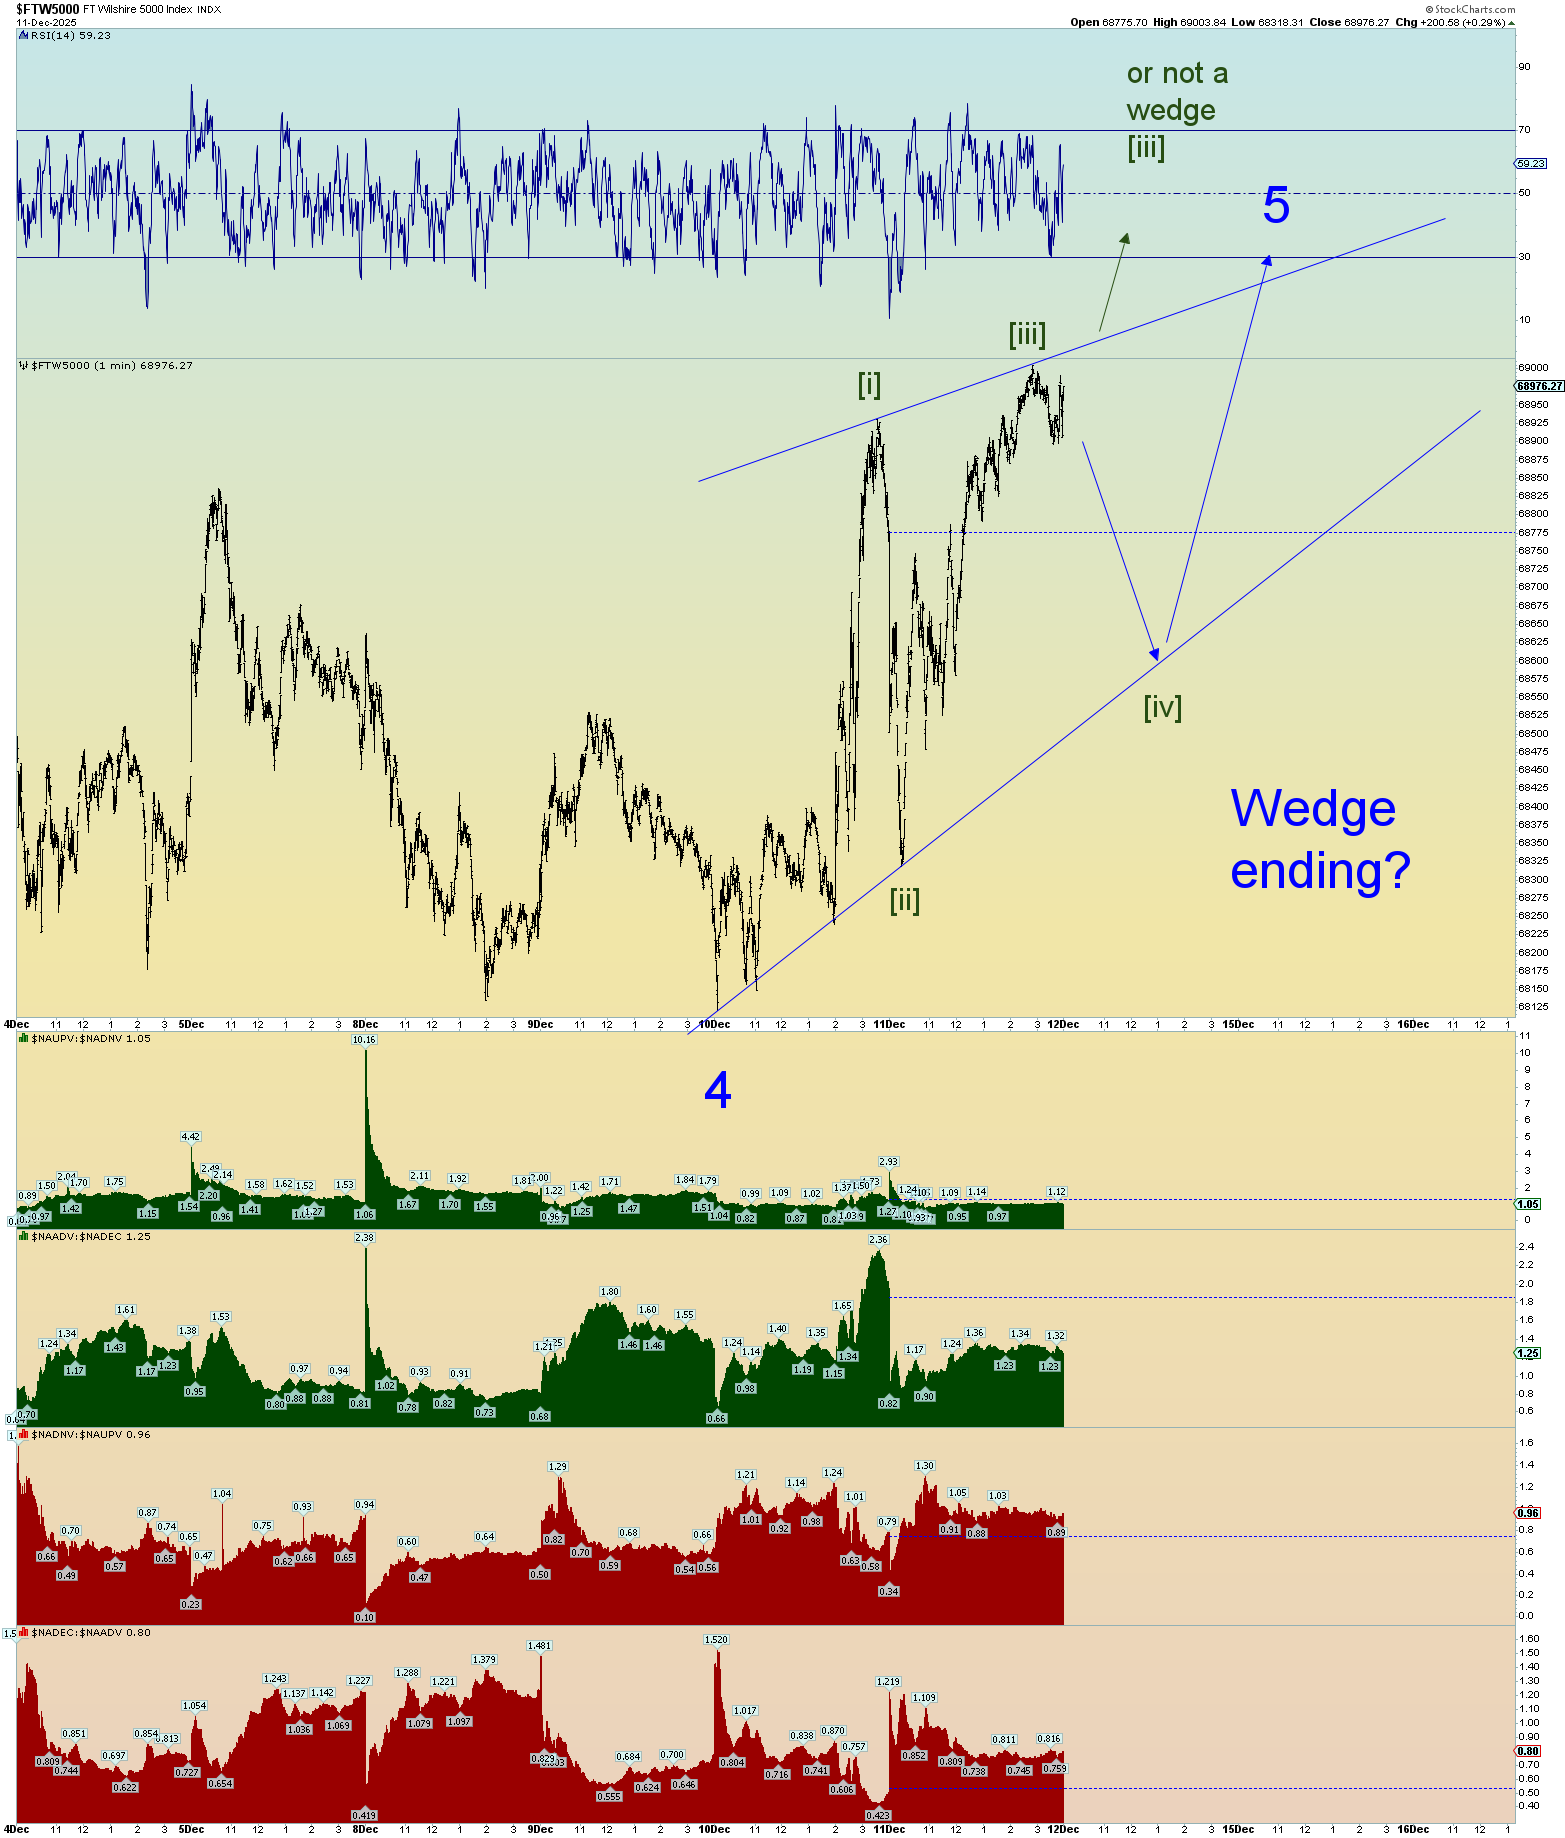
Well, the curious ending diagonal triangle pattern has perfectly topped over the trendline (as was suggested in yesterday’s update) and has gone under.
If this is the true pattern, expect a quick price collapse to beneath blue Minor 4.
So, we got that going for us. But these never seem to work out. Otherwise never mind. We’ll know tomorrow.
Best guess squiggle count. Yes, it’s not a “clean” impulse down, but yeah, if we are transitioning from a major all-time top into something else, it will be messy.
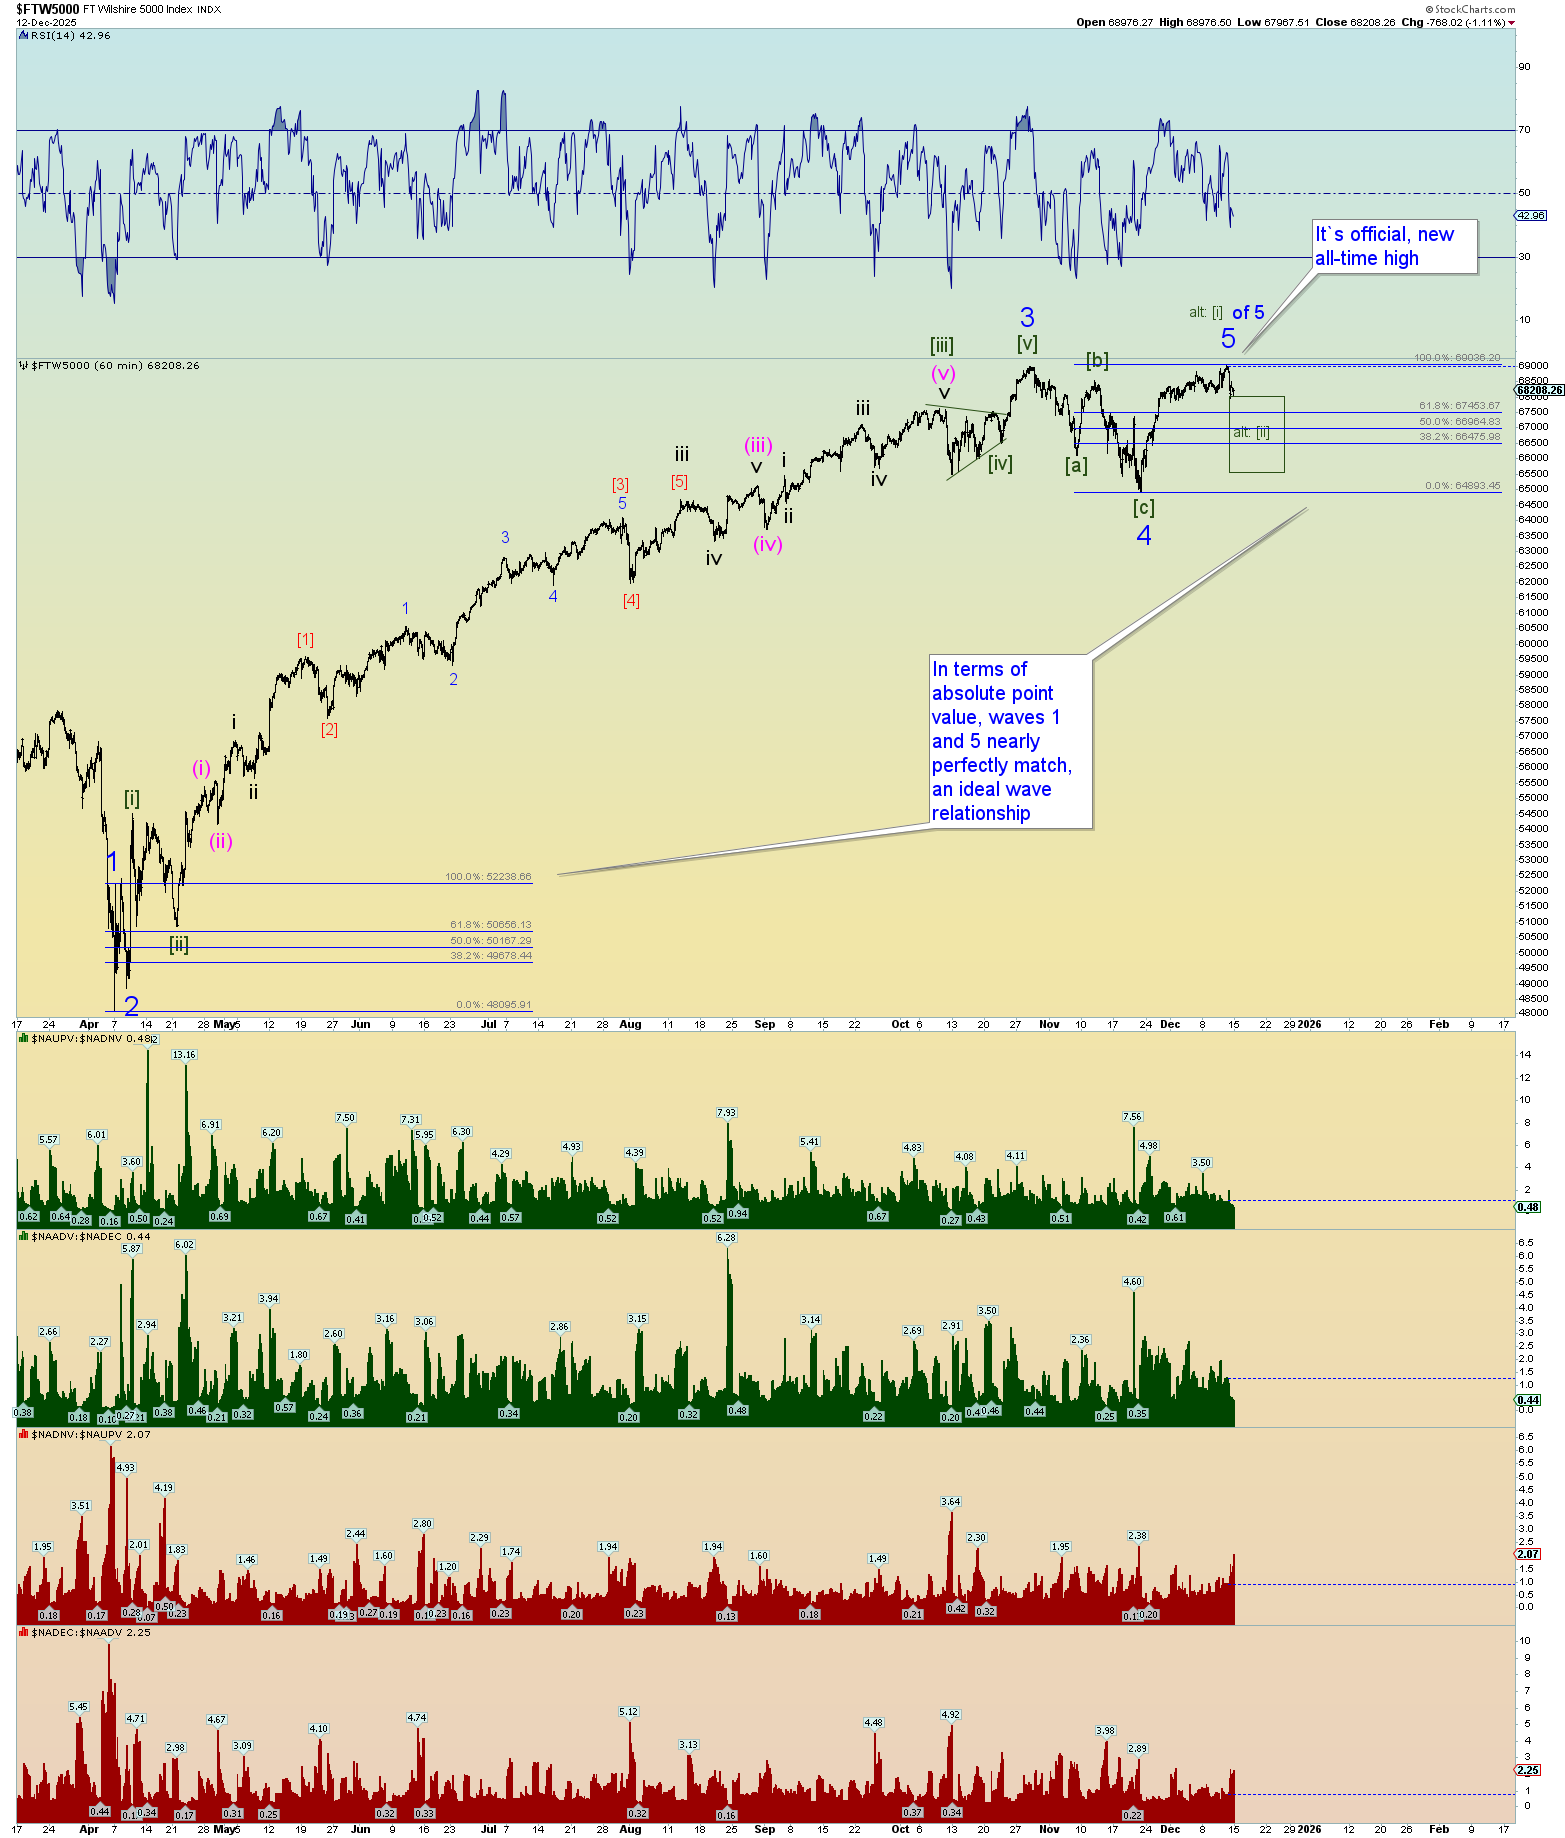
The top alt count is that Minute [ii] of 5 is tracing out or has bottomed today.
I’m only going to post the squiggle count tonight. The market neither went up to form a possible Minute wave [iii] of 5 of (5) of [5] nor did it park itself in a decline as a wave [iv] of 5 of an ending diagonal triangle as was proposed in the Wilshire 5000 3-minute chart last night as the decline was a new low over the past many days.
But that is actually good because in one day, it eliminates certain options in the wave count and opens up other probabilities. And that is what wave counting is all about, probabilities based on wave structure and social mood sentiment. And sentiment has been sky high in many areas.
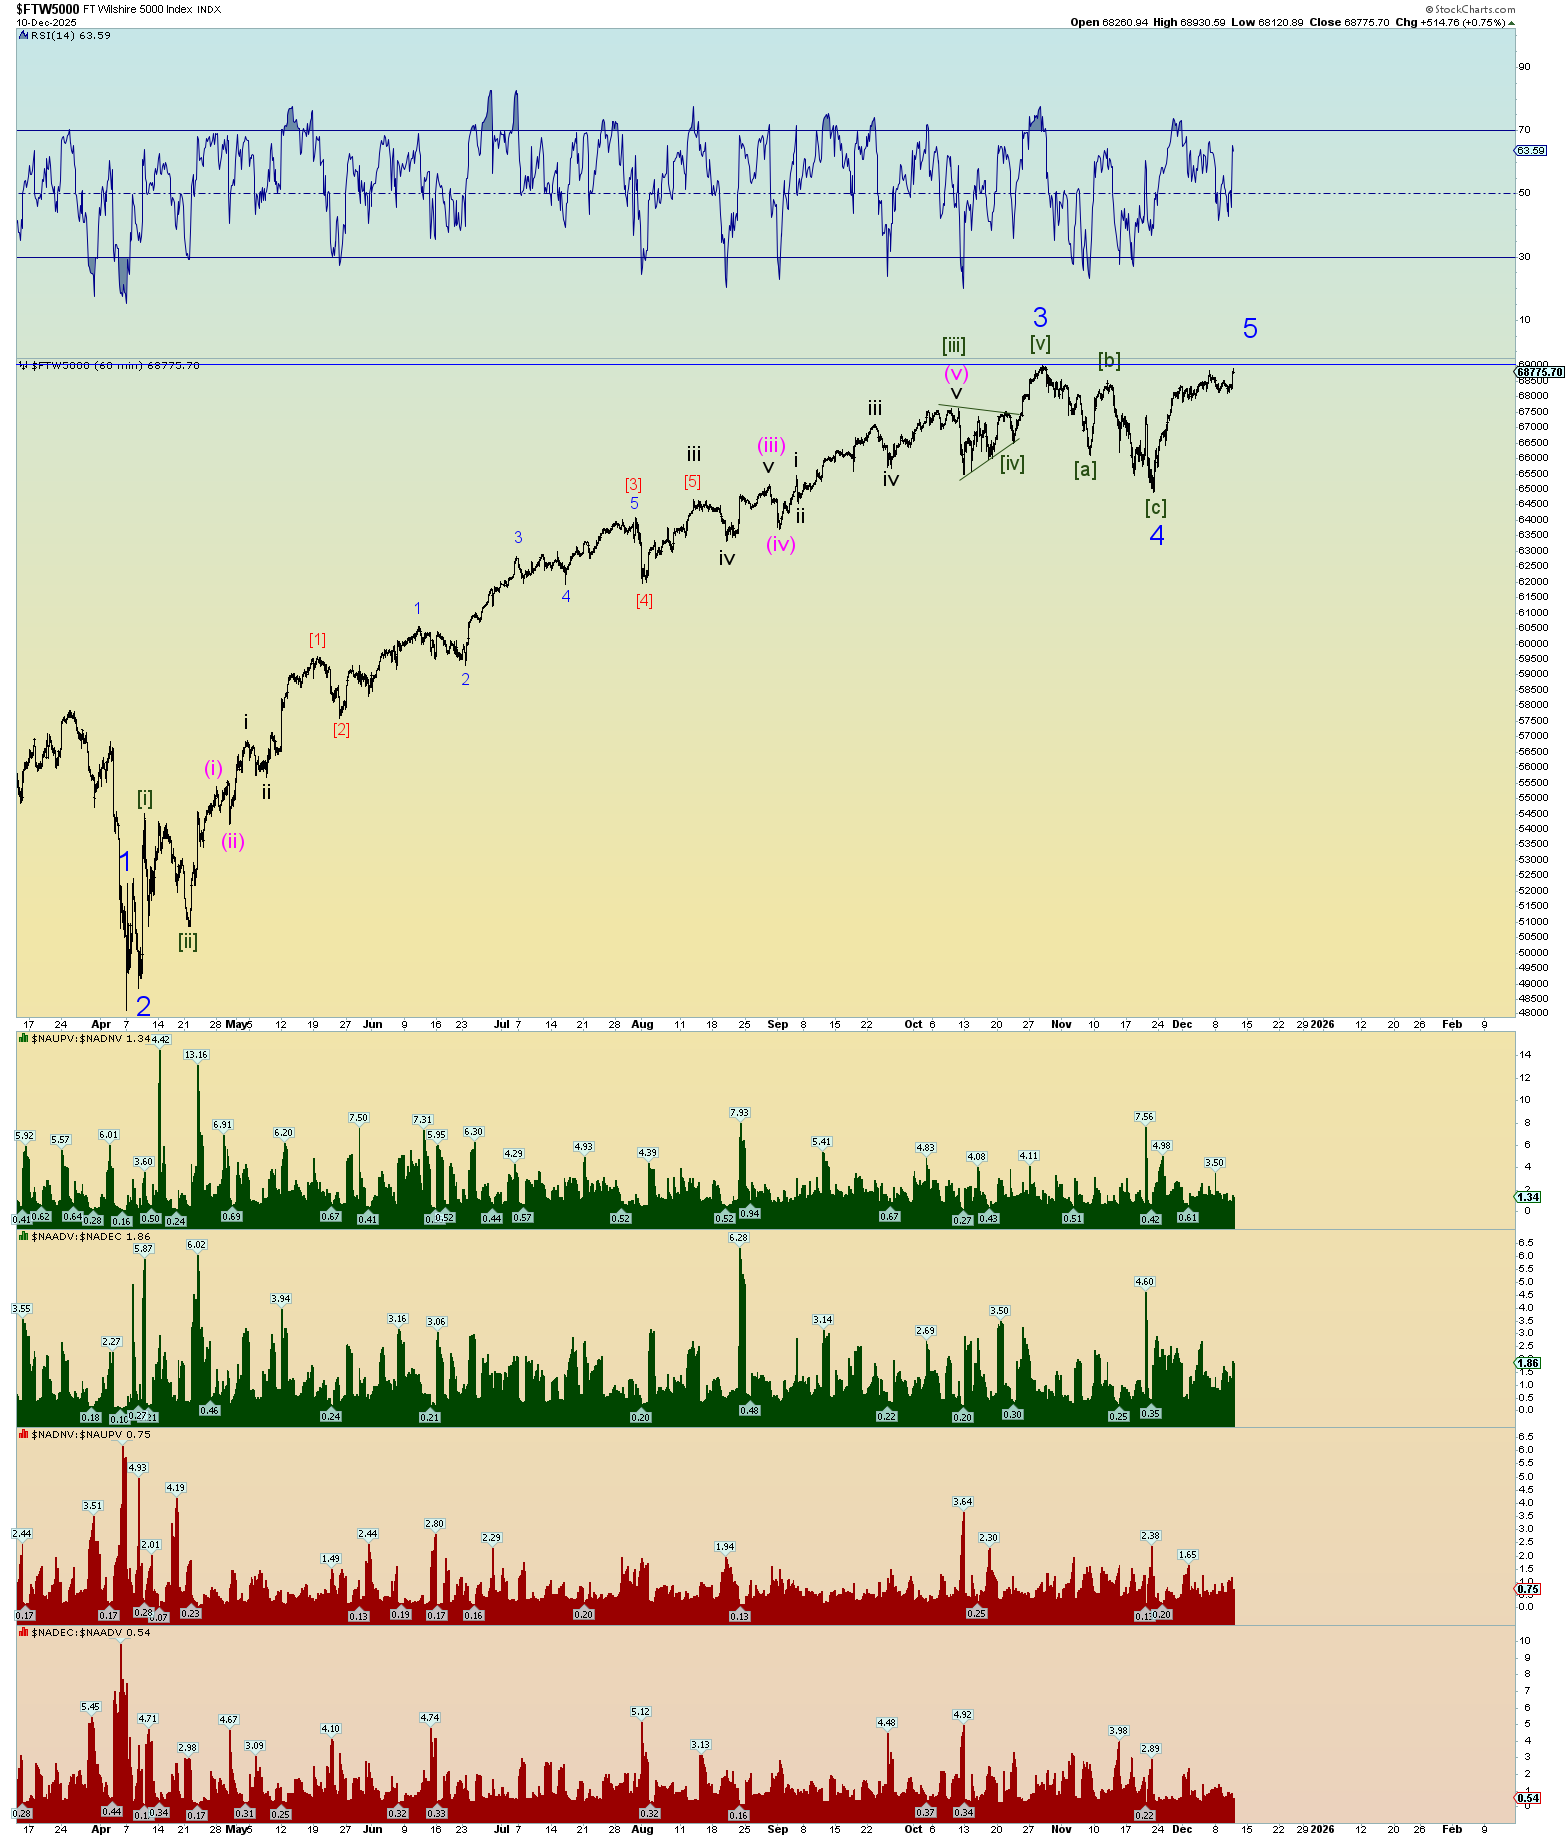
And I’ll be honest, this wave count below is a “beautiful picture” as Robert Prechter of EWI has often said. That’s why I use the sunset background!
Ok. Well, we got some real count confirmation today. The Wilshire 5000 reached a new all-time intra-day high. I mix in S&P 500 charts because these are equivalent charts although I prefer to use the Wilshire 5000 when parsing top and bottom ticks in squiggle counts.
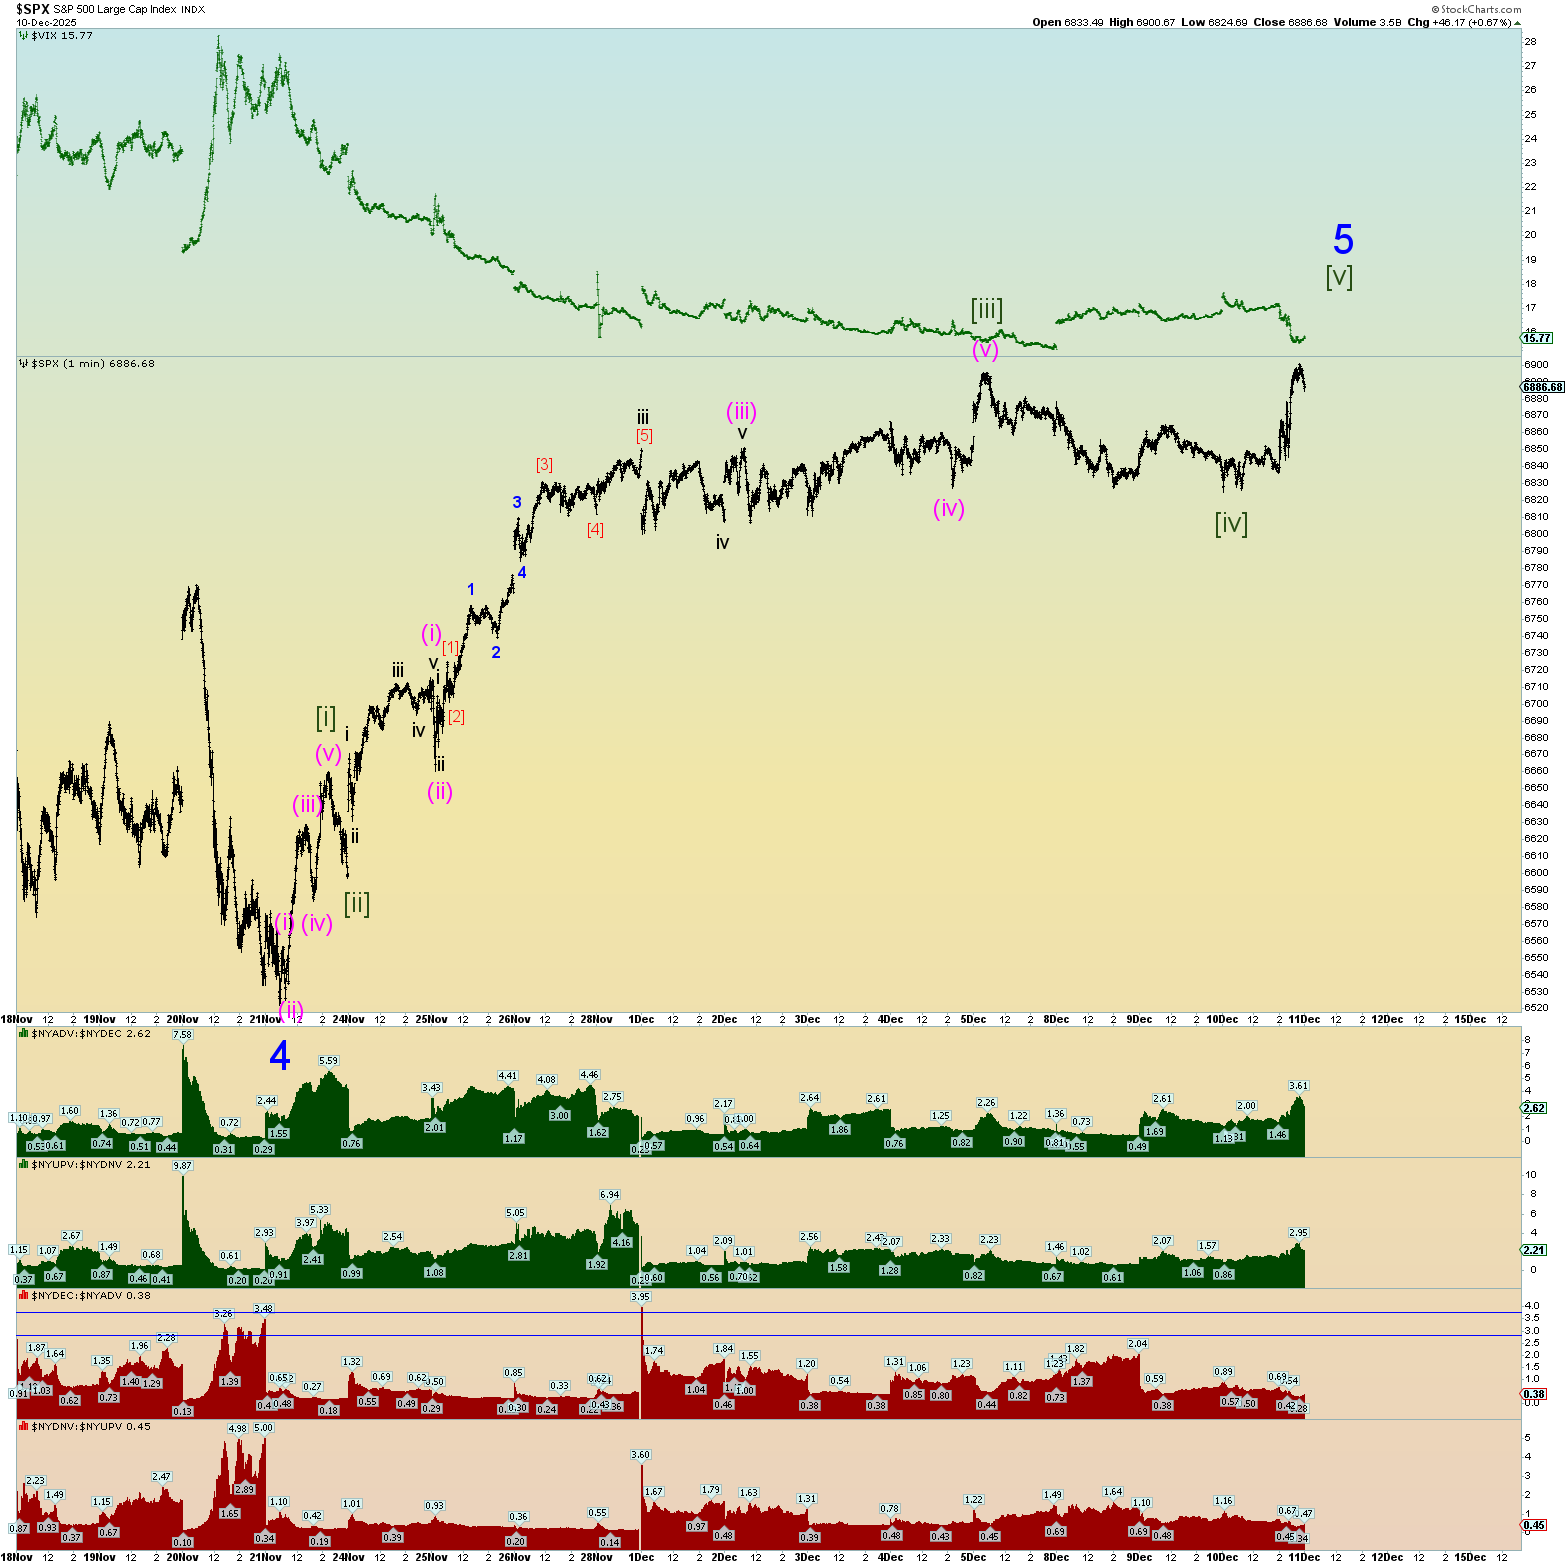
Possible squiggle counts going forward. Wedge maybe? The deep retrace of this morning head-faked everyone and then the surge of a wave [iii]. Seems “wedge-like” behavior near a top. Very herky jerky. Very curious to see what emerges tomorrow.
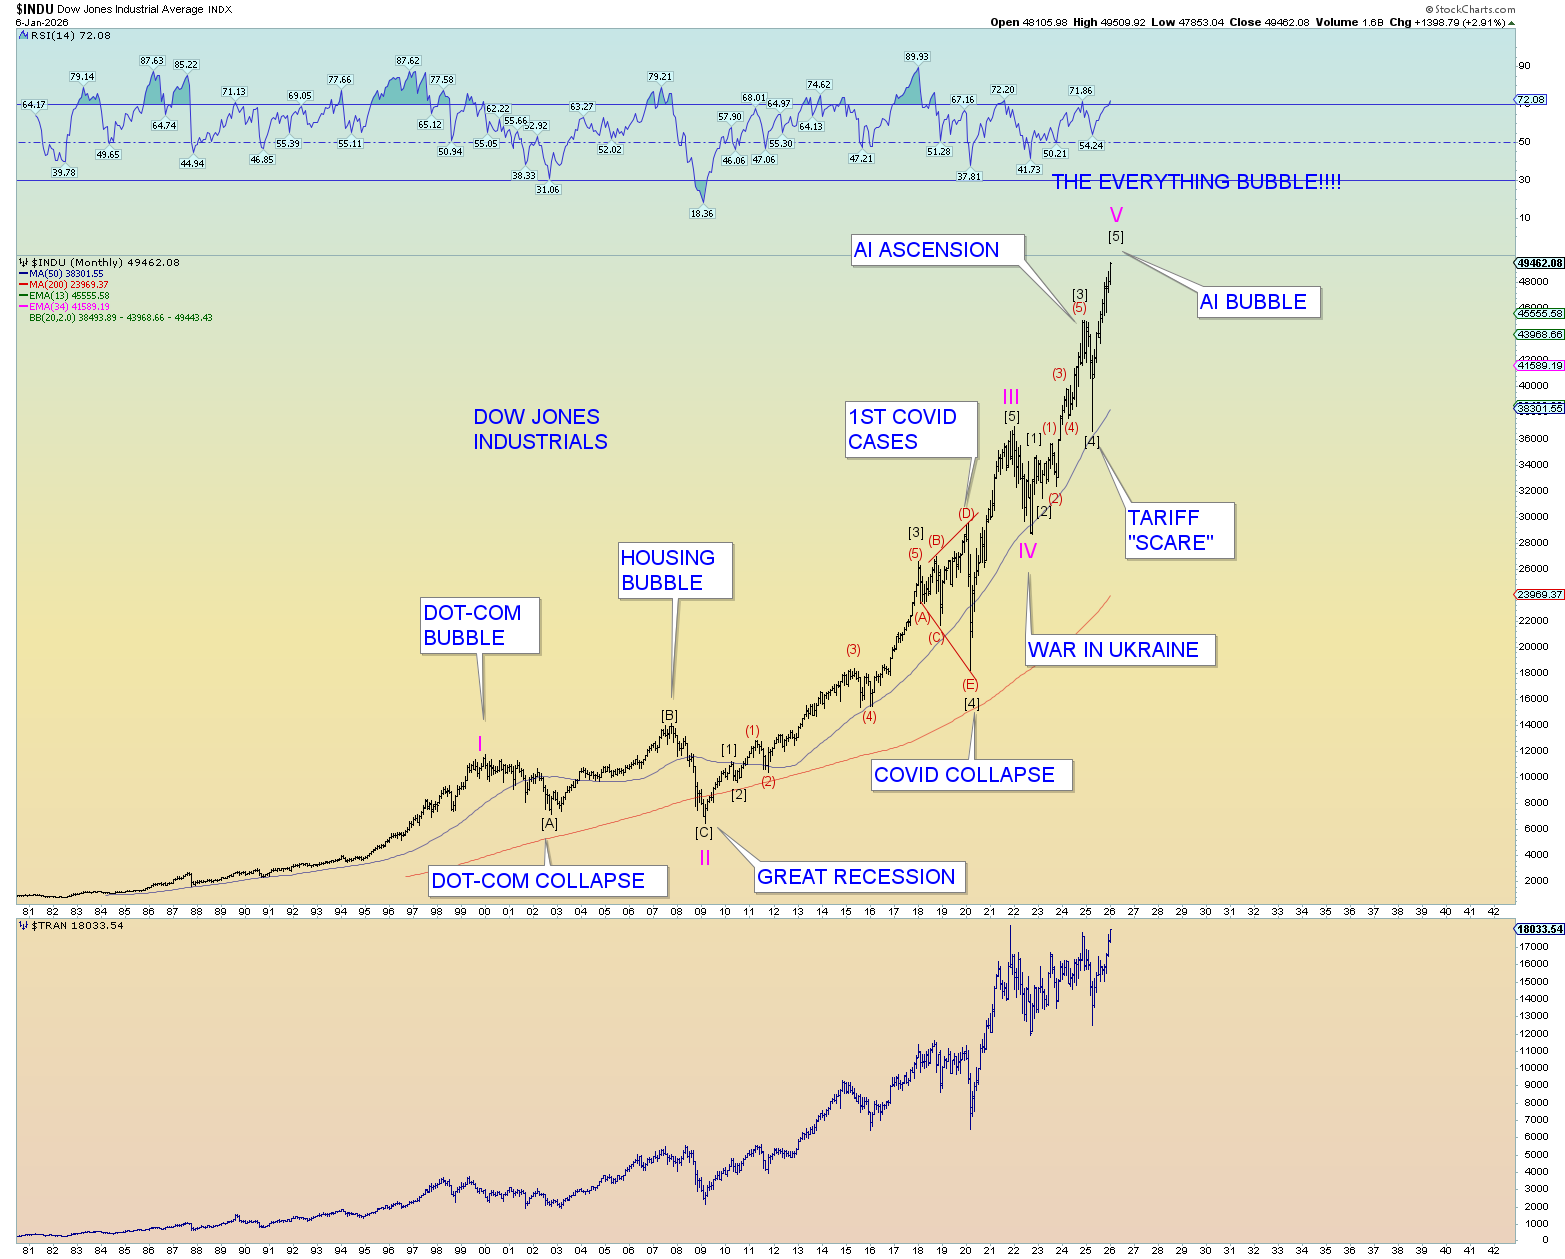
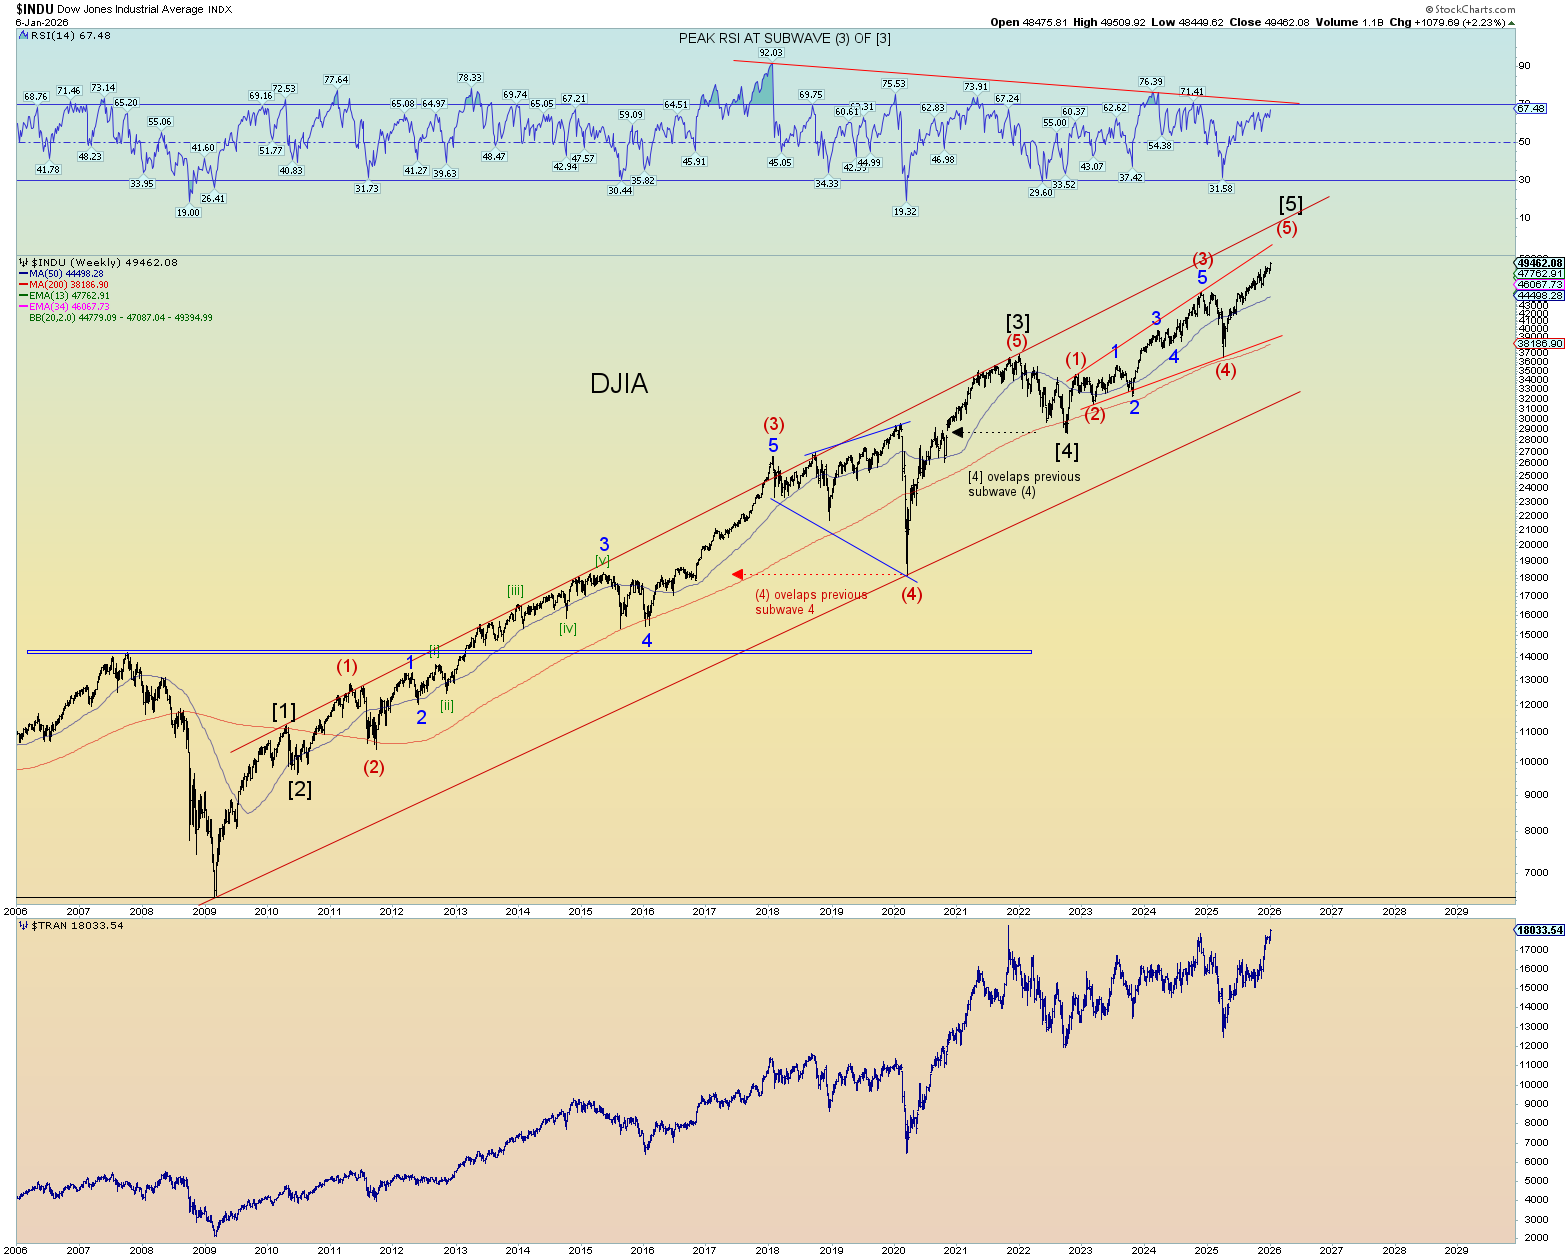
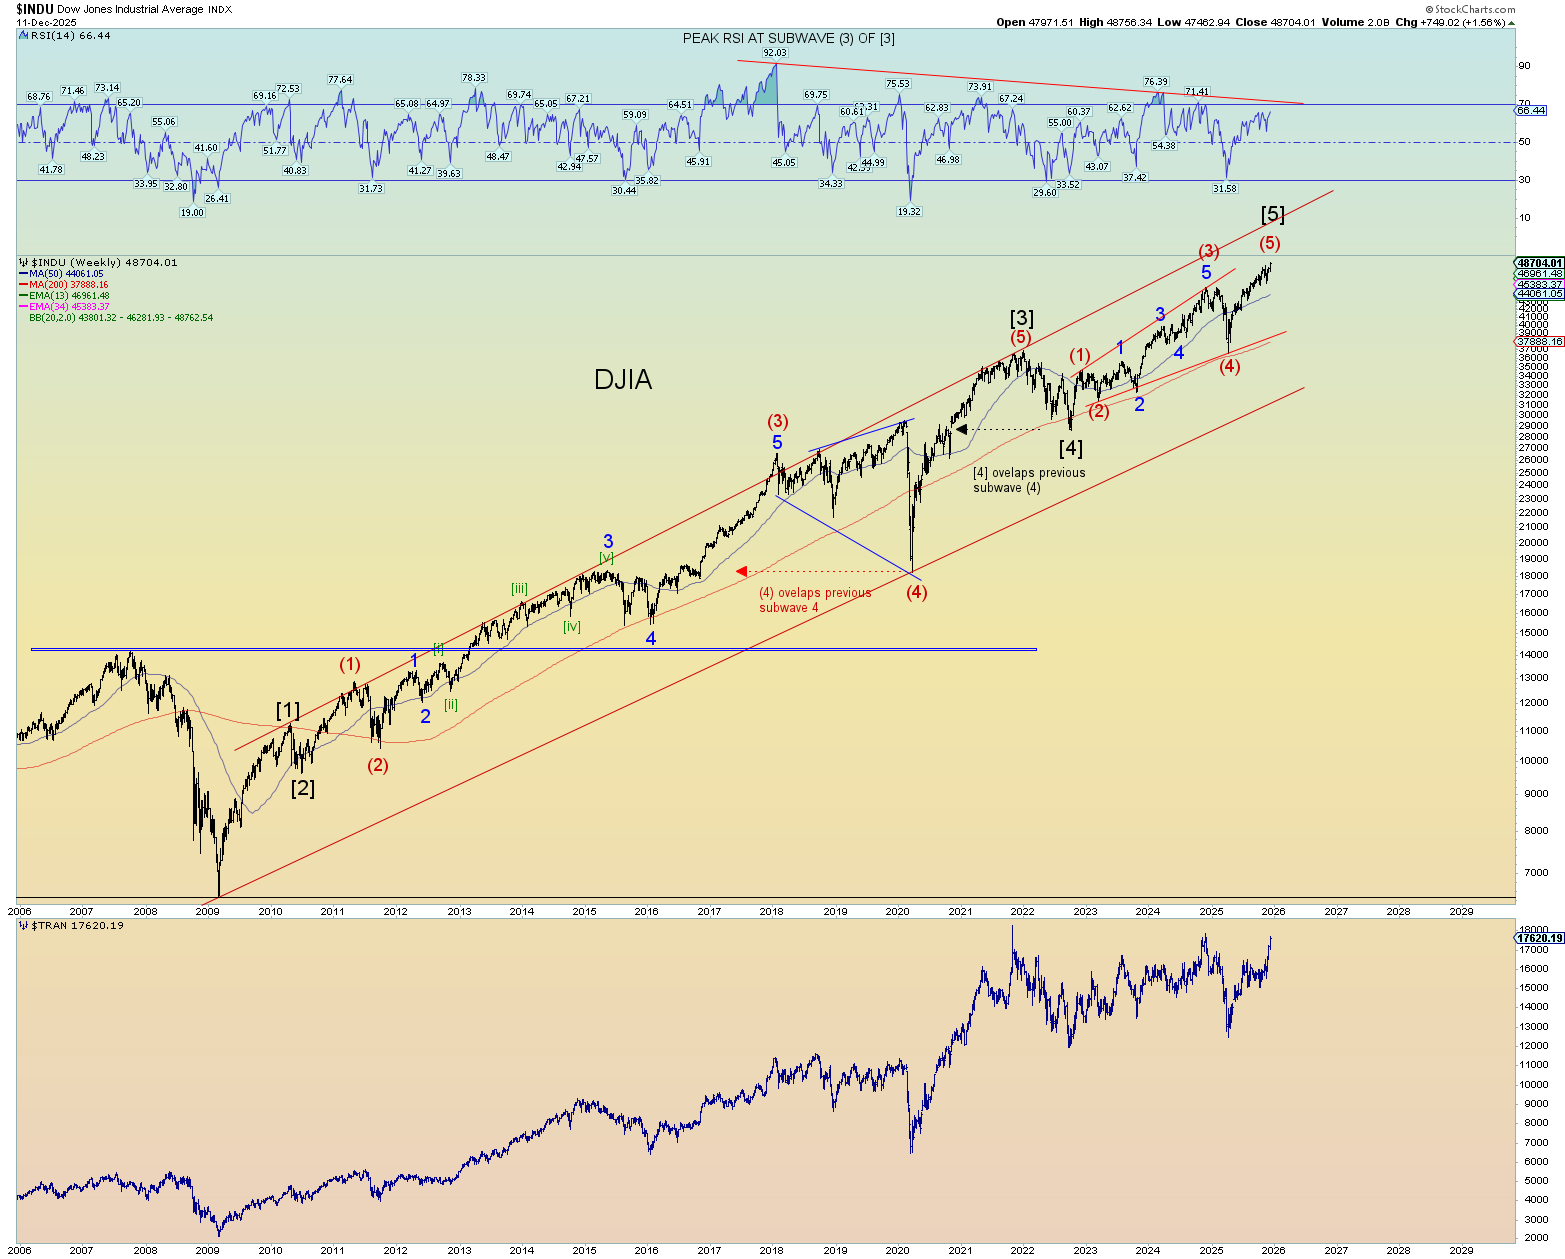
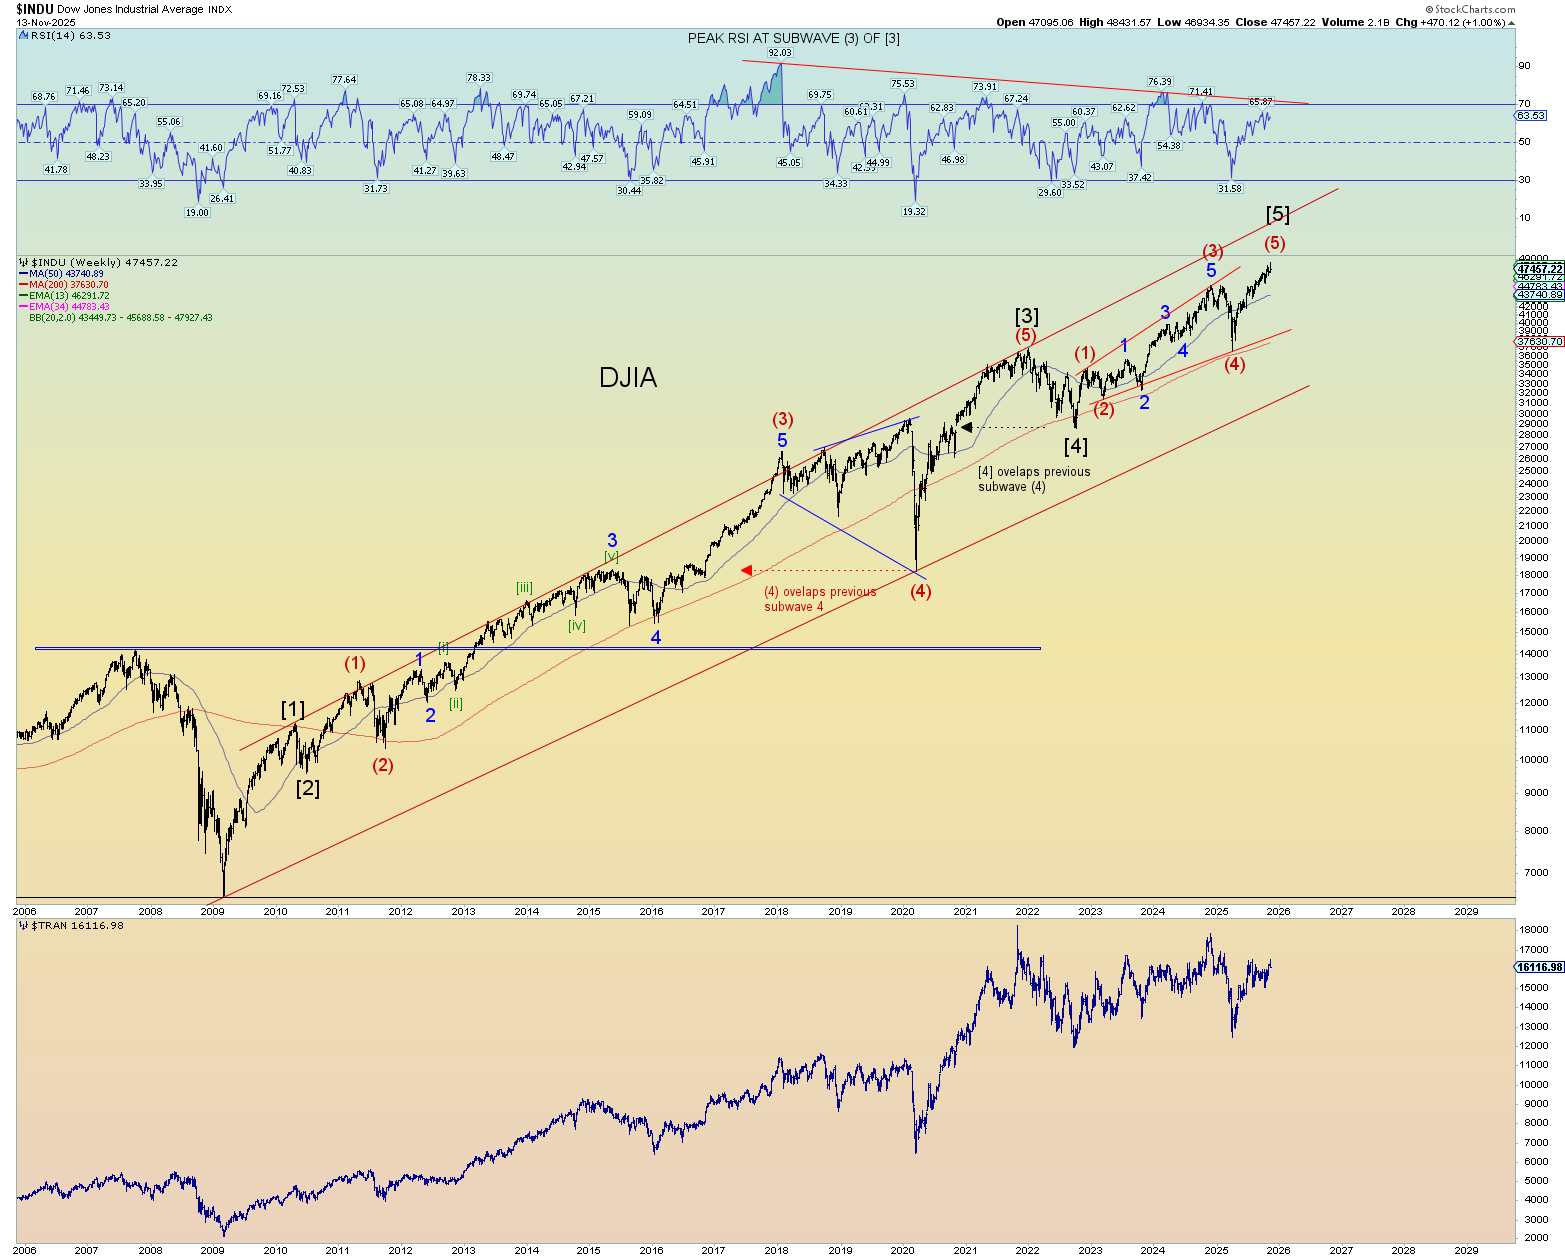
Industrials new all-time high today.
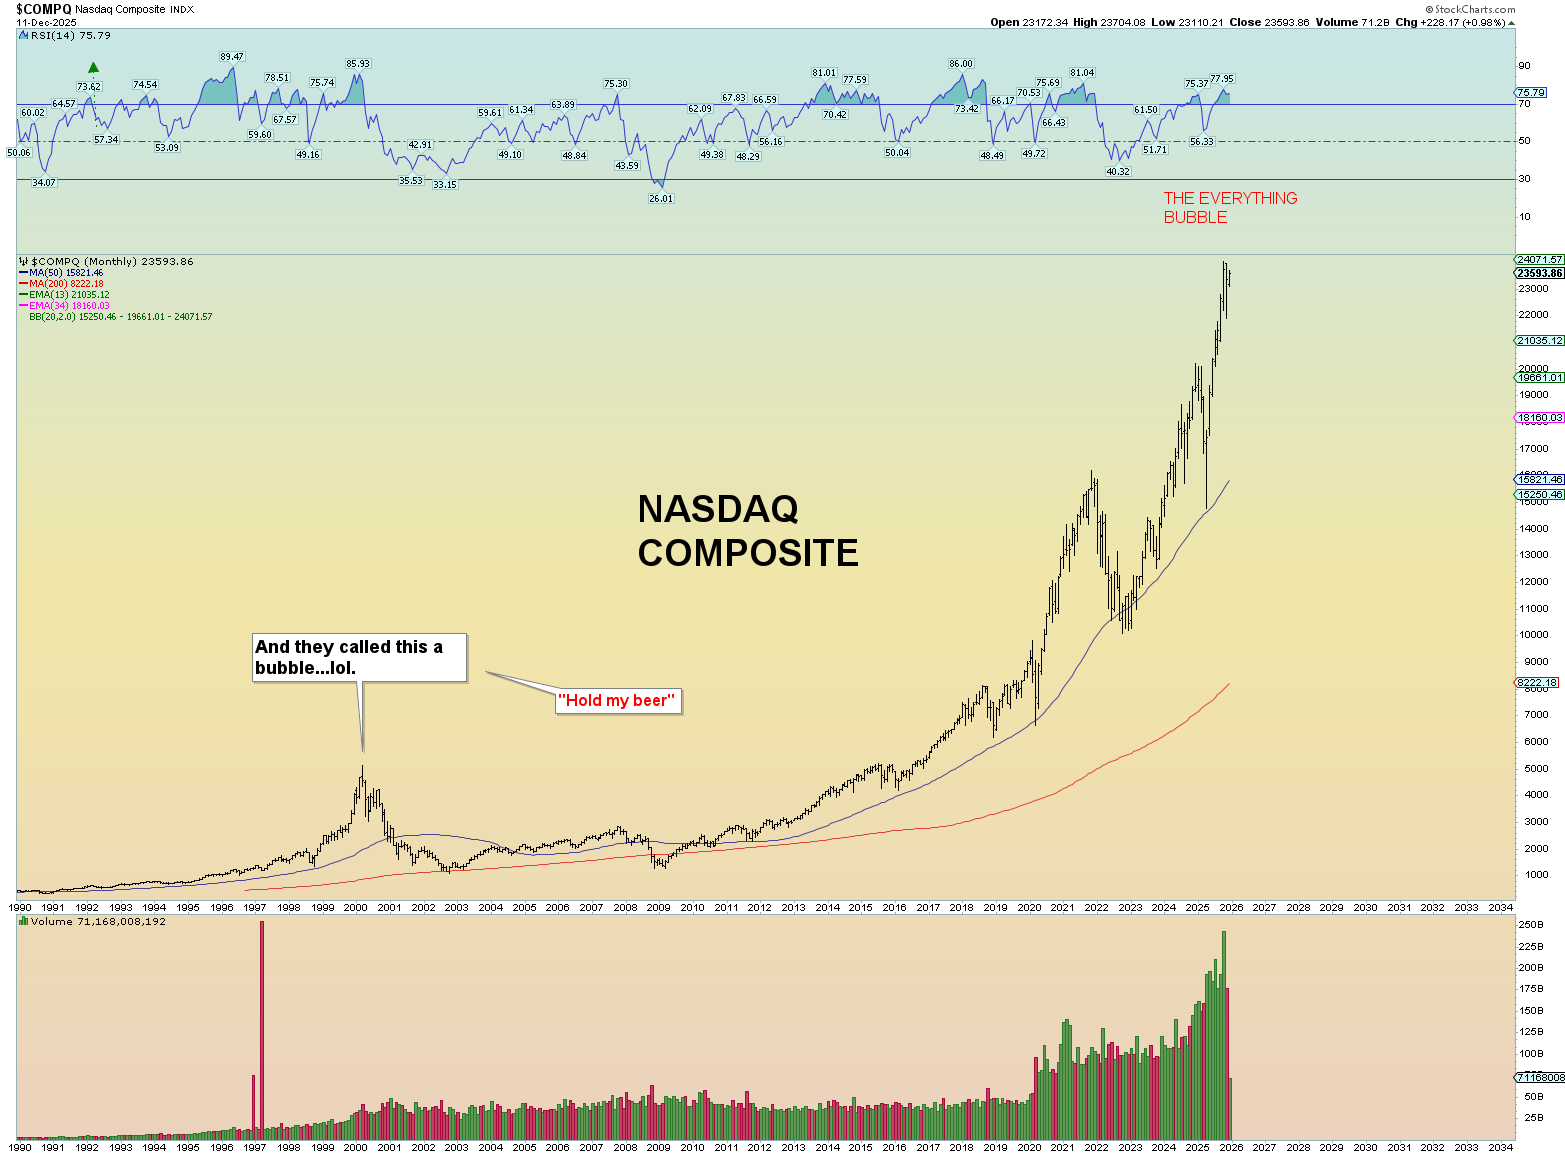
The Nasdaq (nor the SPX for that matter) did not confirm new highs.
BONUS CHART:
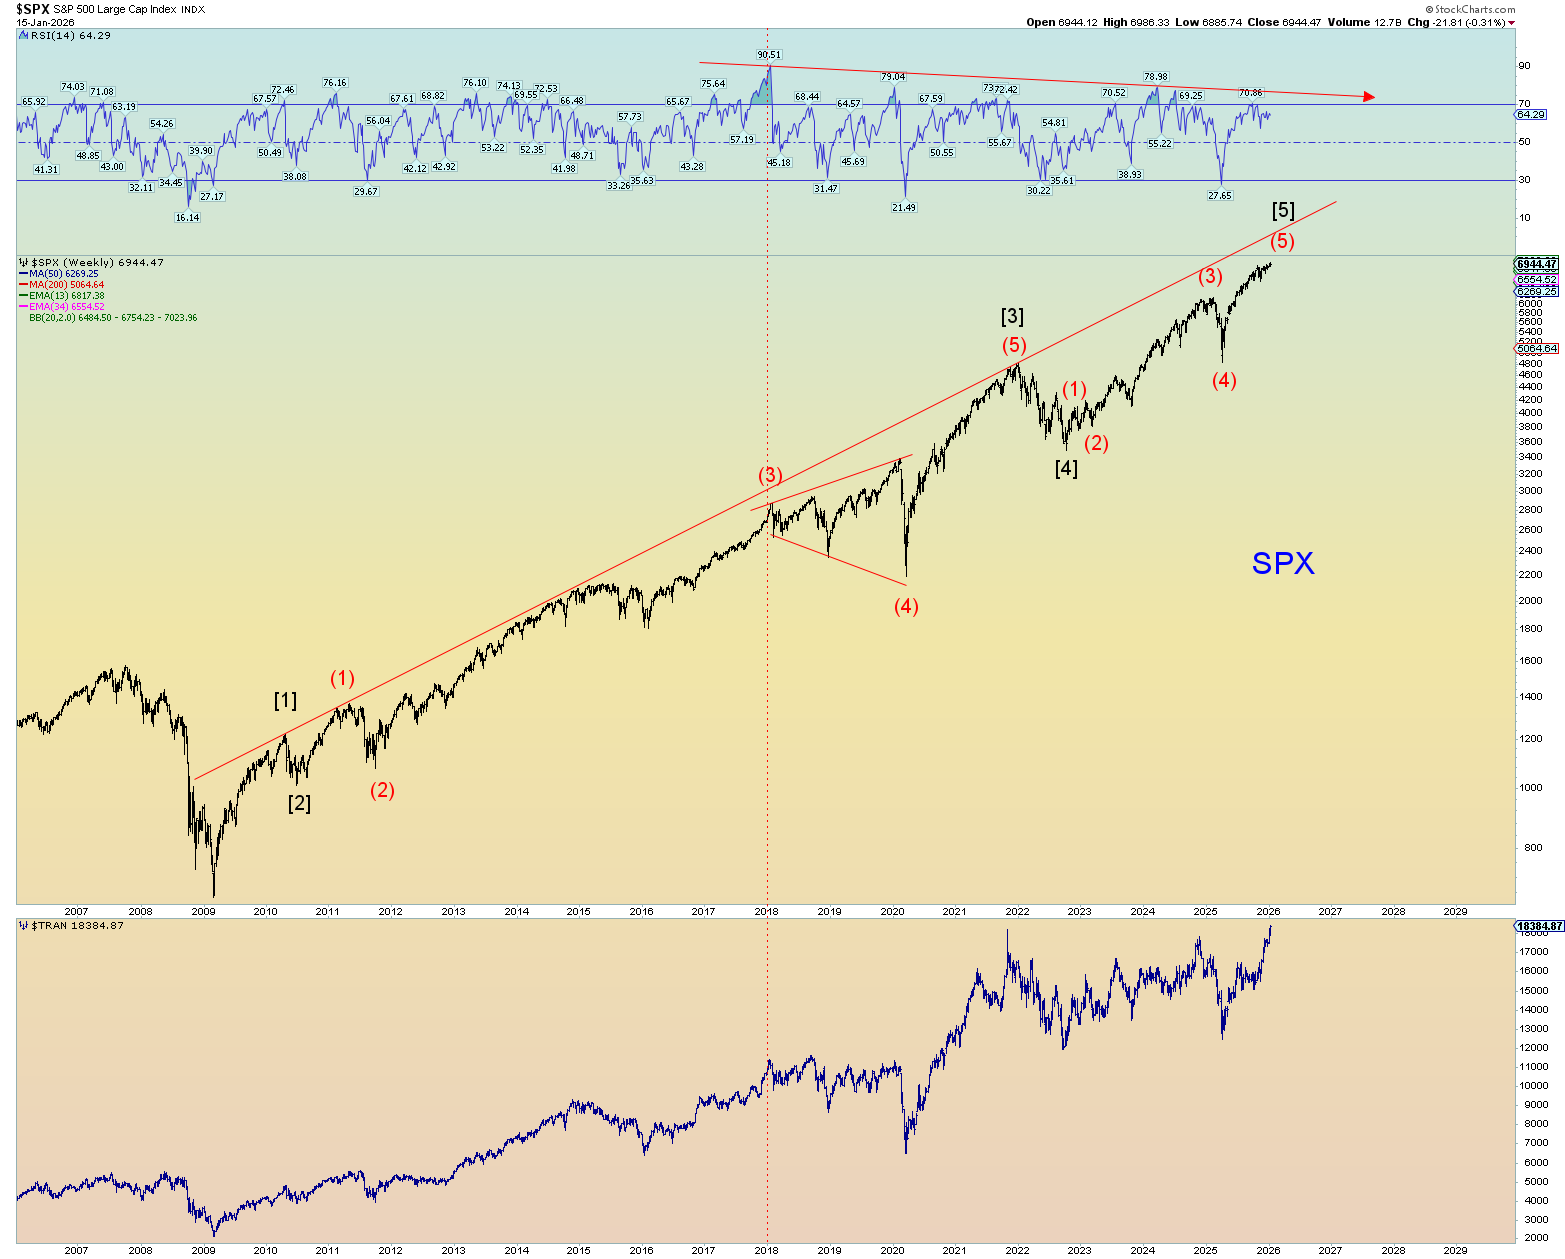
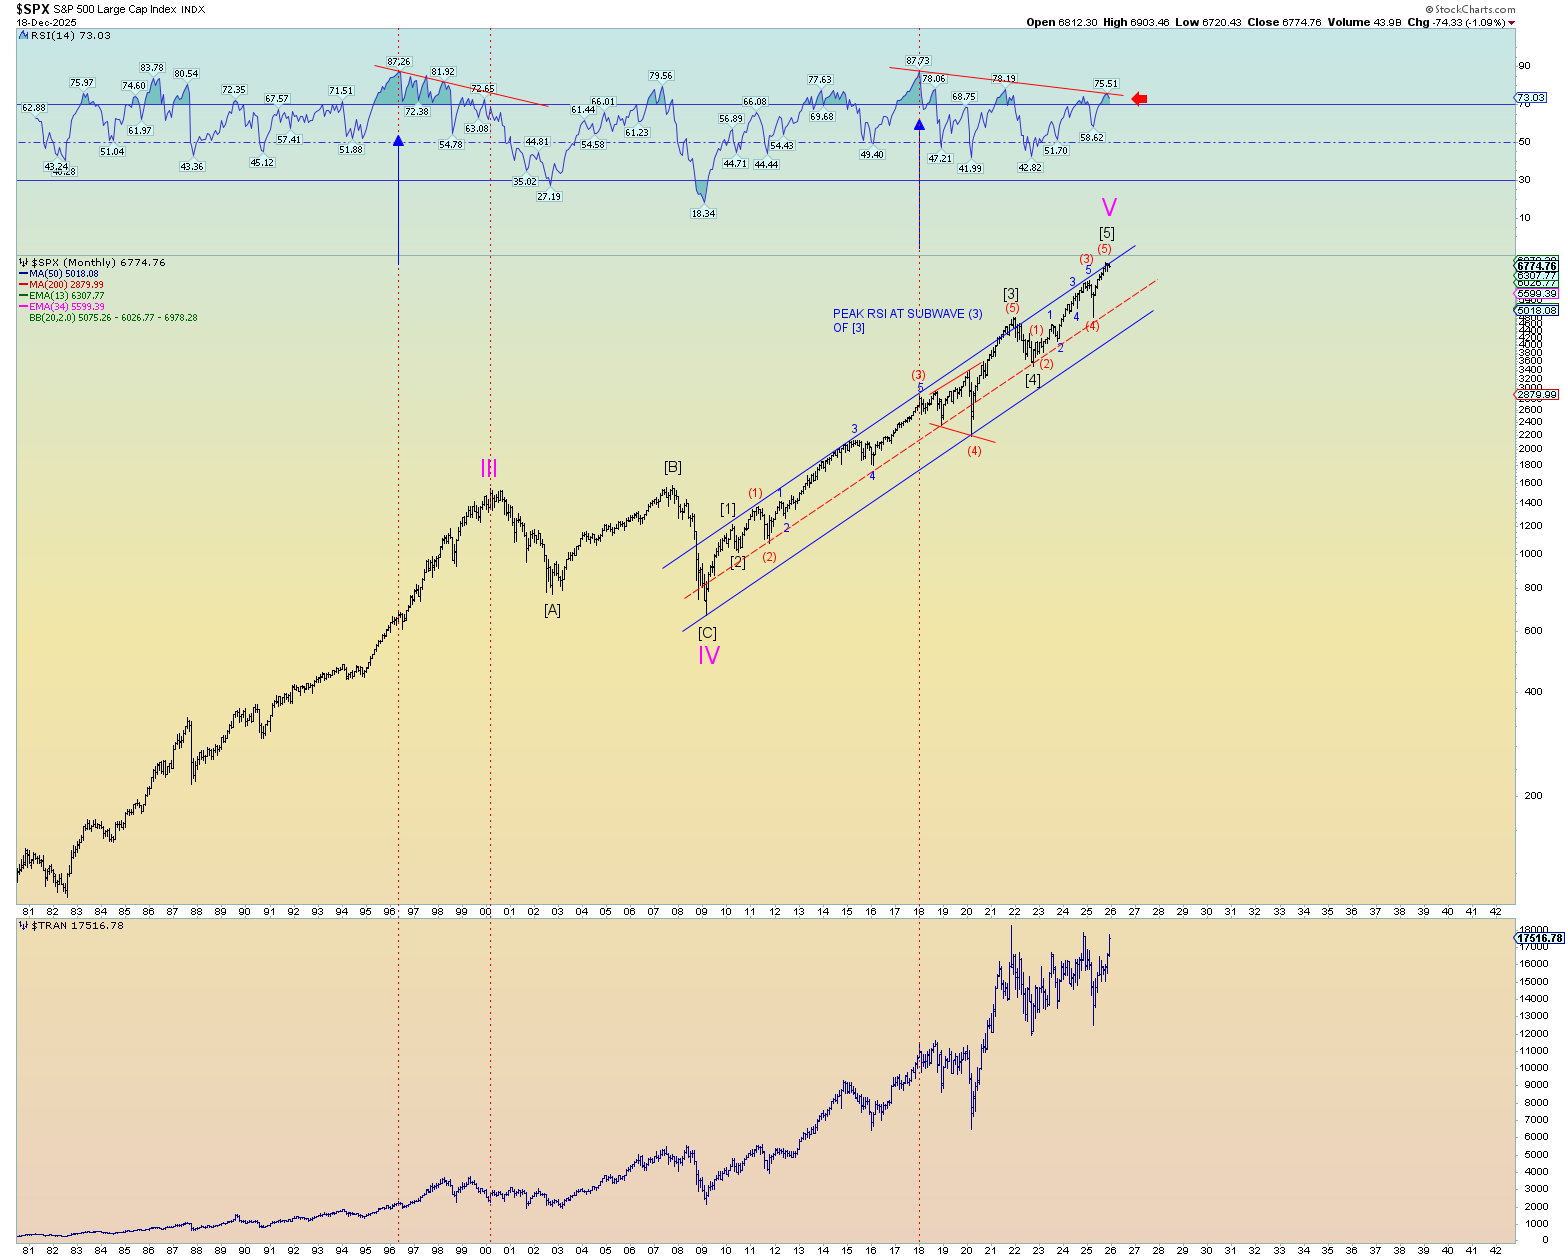
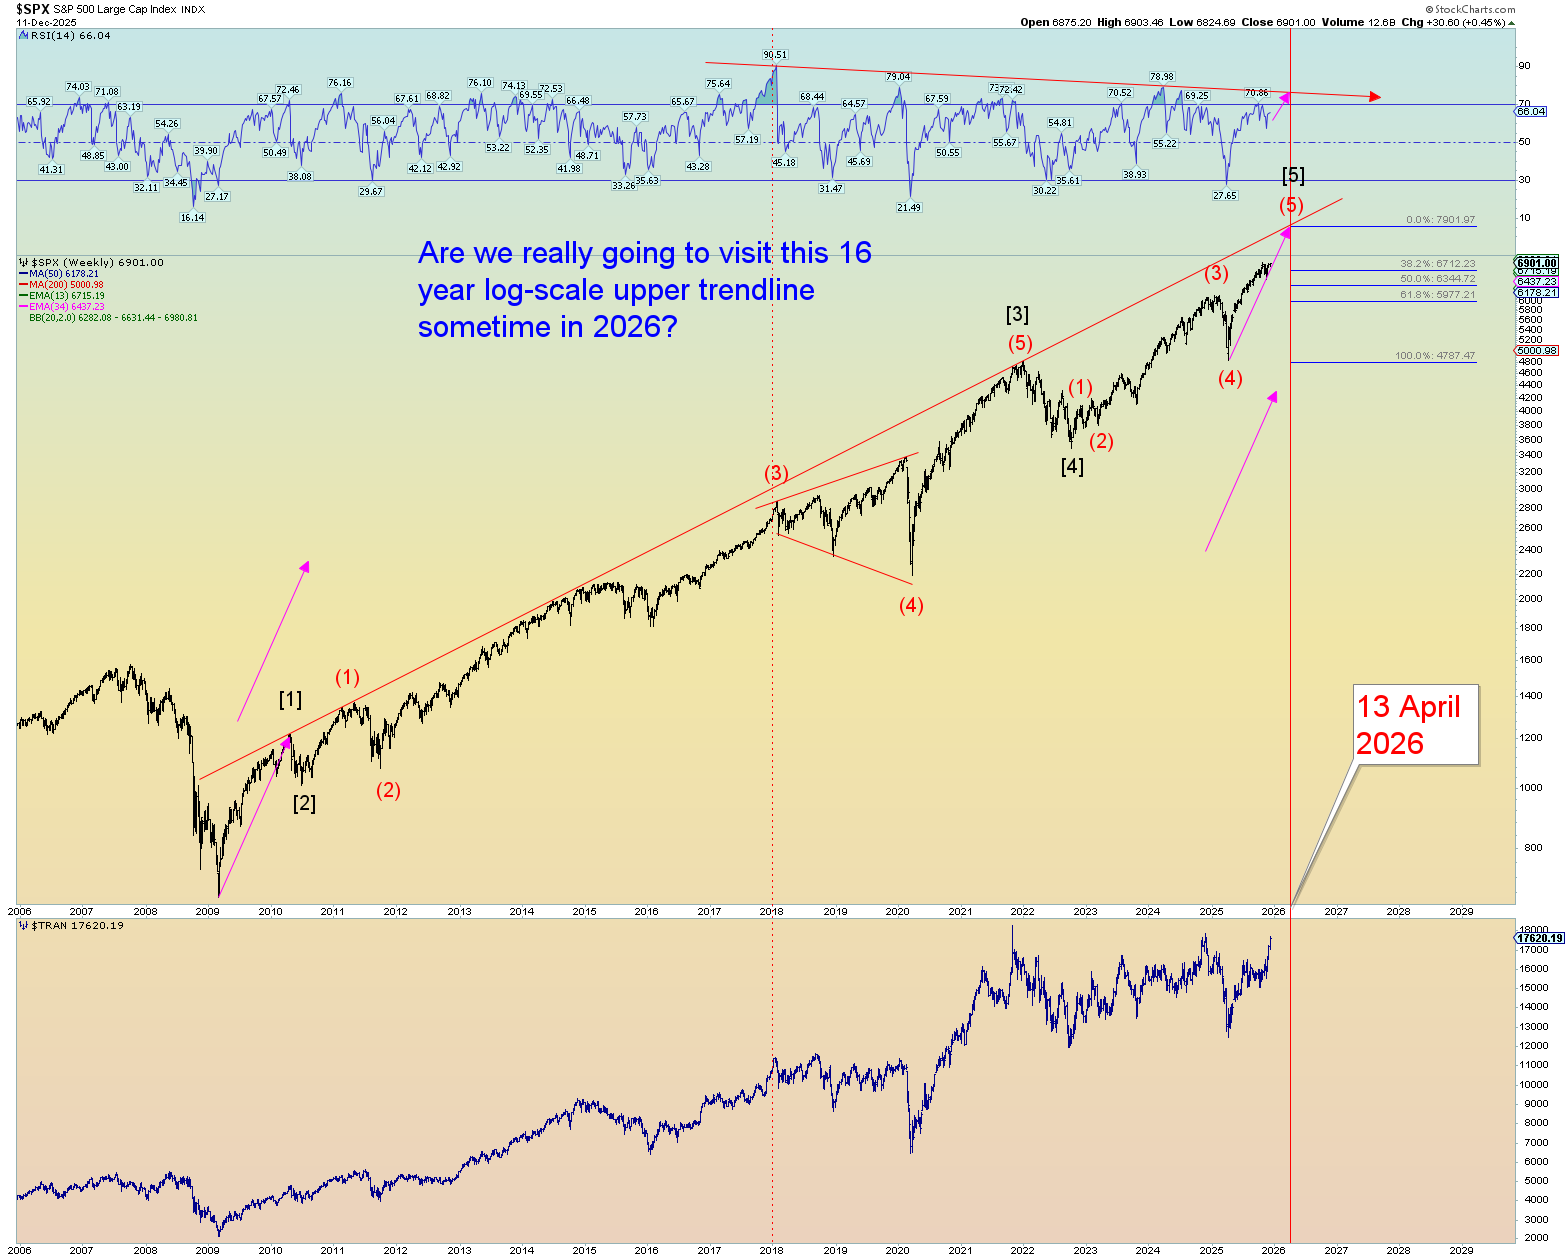
This chart below – and I use the SPX so everyone can relate, as it makes such nice trendlines – shows, in log scale, the long term upper trendline that has been seemingly out of reach for the last few years. Yet, if the market is ever working toward this upper trendline, I feel it would have to be within the next 4-7 months.
Otherwise, it’s just a ghost target never reached which could very well be the case since many, if not most times, wave “fives” do not reach this upper trendline.
Yet it was on my heart as an example that if this wretched world is reaching peak financial exuberance and bubble behavior, an April 13th, 2026, target of approximately 7900 SPX would be another 13% rise from today’s peak. This would obviously be a hyper-focus on all things “AI” and perhaps a perceived sense of “loosey goosey” Fed monetary policy that they just announced today and is surely to come in some form or another. But that will be an illusion. The irony is that the higher the market goes, the lesser influence the Fed has controlling it.
I mean don’t you guys watch monster movies?
If this would occur, the likely scenario that I have always adhered to is that the end of the global financial system as we know it would actually be strengthened in argument. Yet if we head that way, we would be all like boiling frogs in a pot unable to sense just how insane things had become.
I have shown the purple line sharp “angle of advance” which would largely match the beginning of this manic phase from the depths of hell (666) of the 2009 low.
Anyways, I have a hard time believing this is what may actually happen, yet if it did, I would be ecstatic, and it would be very exciting to see play out. The final bubble in all things.
So yeah, we might have another 5 grueling months where all things are pain in life.
A loss of 300-400 SPX points would probably confirm the primary count that I have been posting (as far as squiggles) is the case in hand and would make this chart just an allusion that the algorithms fail to fulfill. Because that is all it is about anymore, turning on the machines and letting the software take control. Where have we seen this before? Turn Those Machines Back On!!!
But yeah, I almost hope this scenario would happen. Let’s just keep blowing the bubble higher and higher at the pace that it began in 2009 – 2010. But the primary counts are super OK, and sentiment is super high. A large downturn coming very soon seems to be the best bet for now.
It could be a leading diagonal triangle followed by a deep and sharp price retrace. I like this option, although it is a reach. One can argue we did have a 5 wave move down although clearly not in an impulse form.
We’ve had the biggest price correction since April. Therefore, the top ALTERNATE count is shown as thus. We have a potential head and shoulders pattern forming over the last 6 weeks or so. The DJIA has made new all-time highs and obviously the NASDAQ and SPX have diverged.