This is probably the best count. It doesn’t violate any Elliott Wave rules. It appears another pop to a new high is coming.
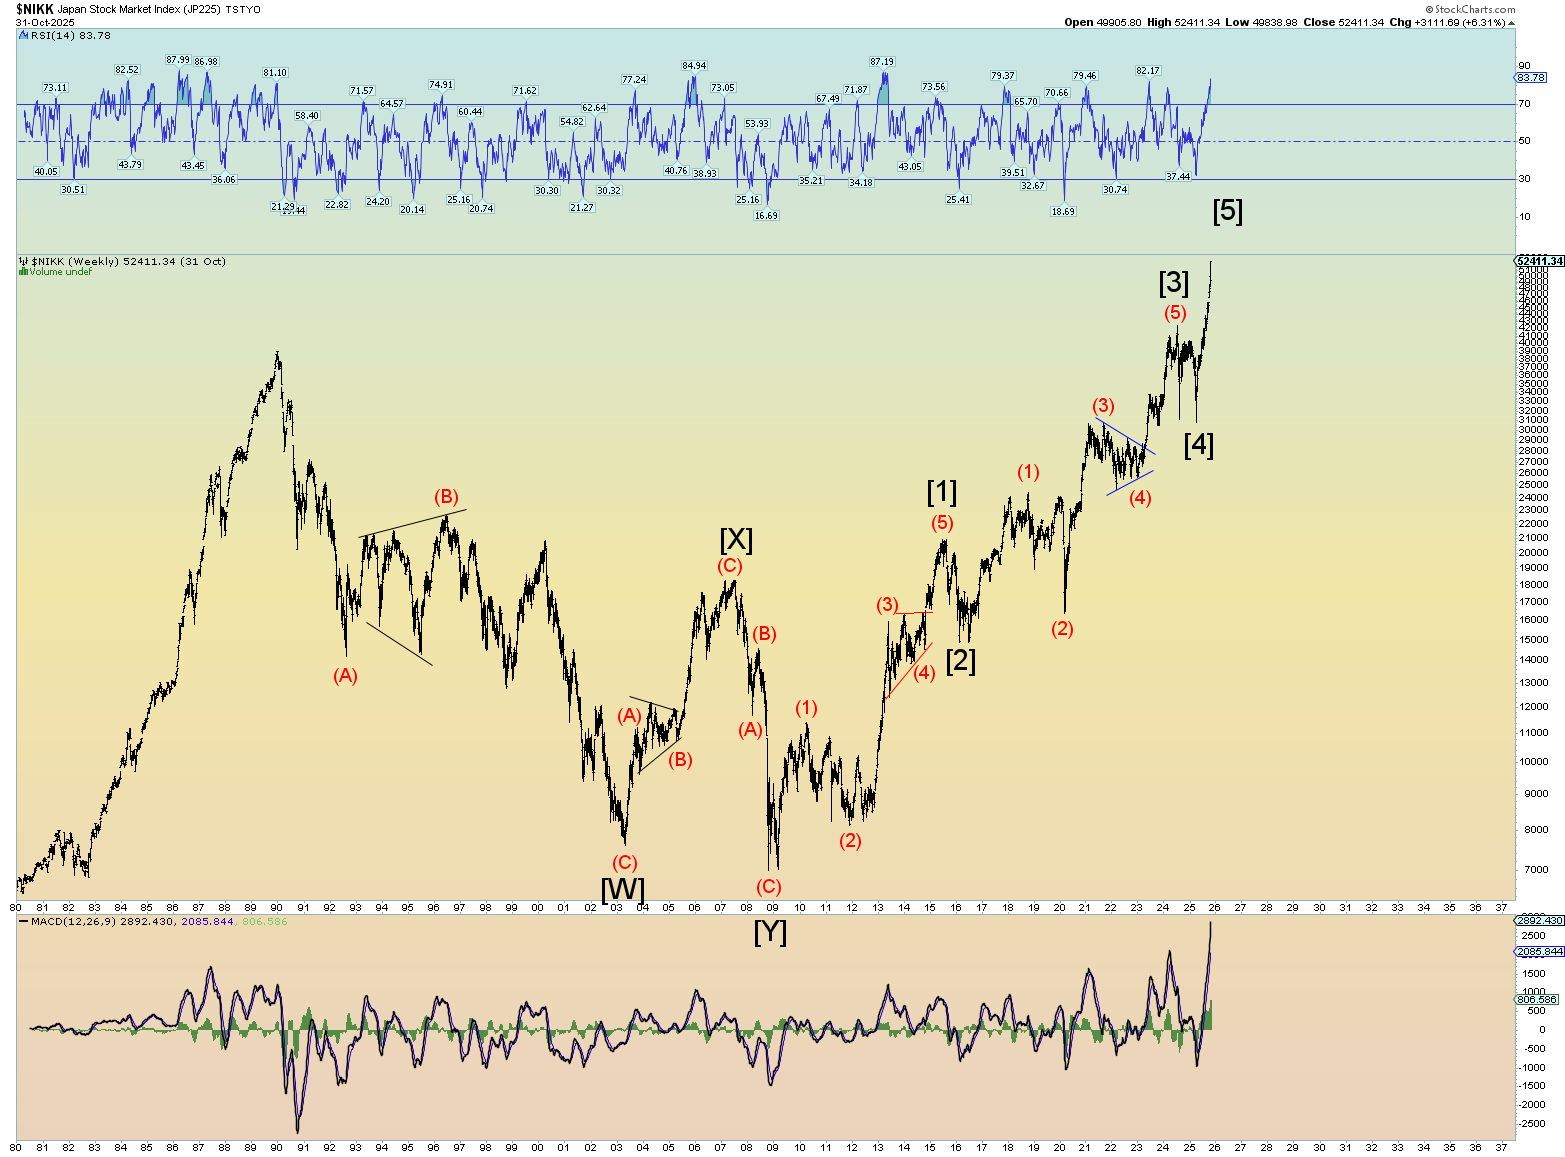
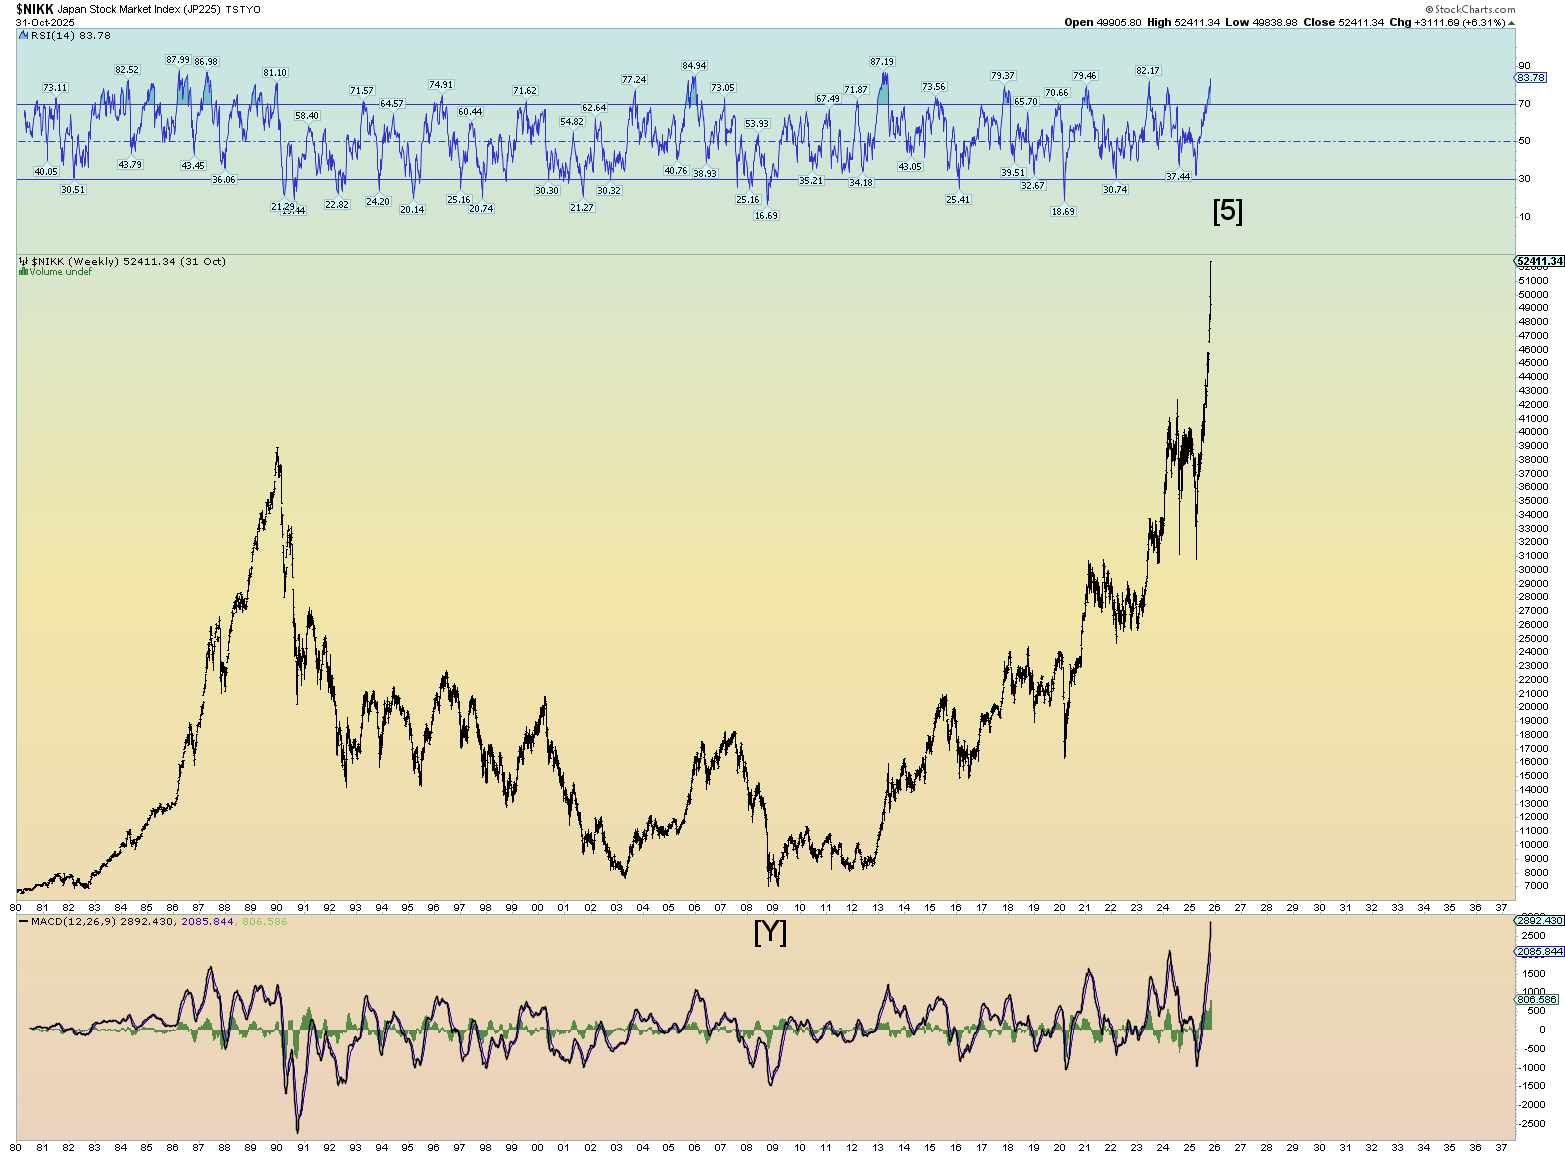
Check out the Nikkei. It has some awesome wave counts. This is of course log scale:
Check out arithmetic scale. Just insane!
This is probably the best count. It doesn’t violate any Elliott Wave rules. It appears another pop to a new high is coming.
Check out the Nikkei. It has some awesome wave counts. This is of course log scale:
Check out arithmetic scale. Just insane!
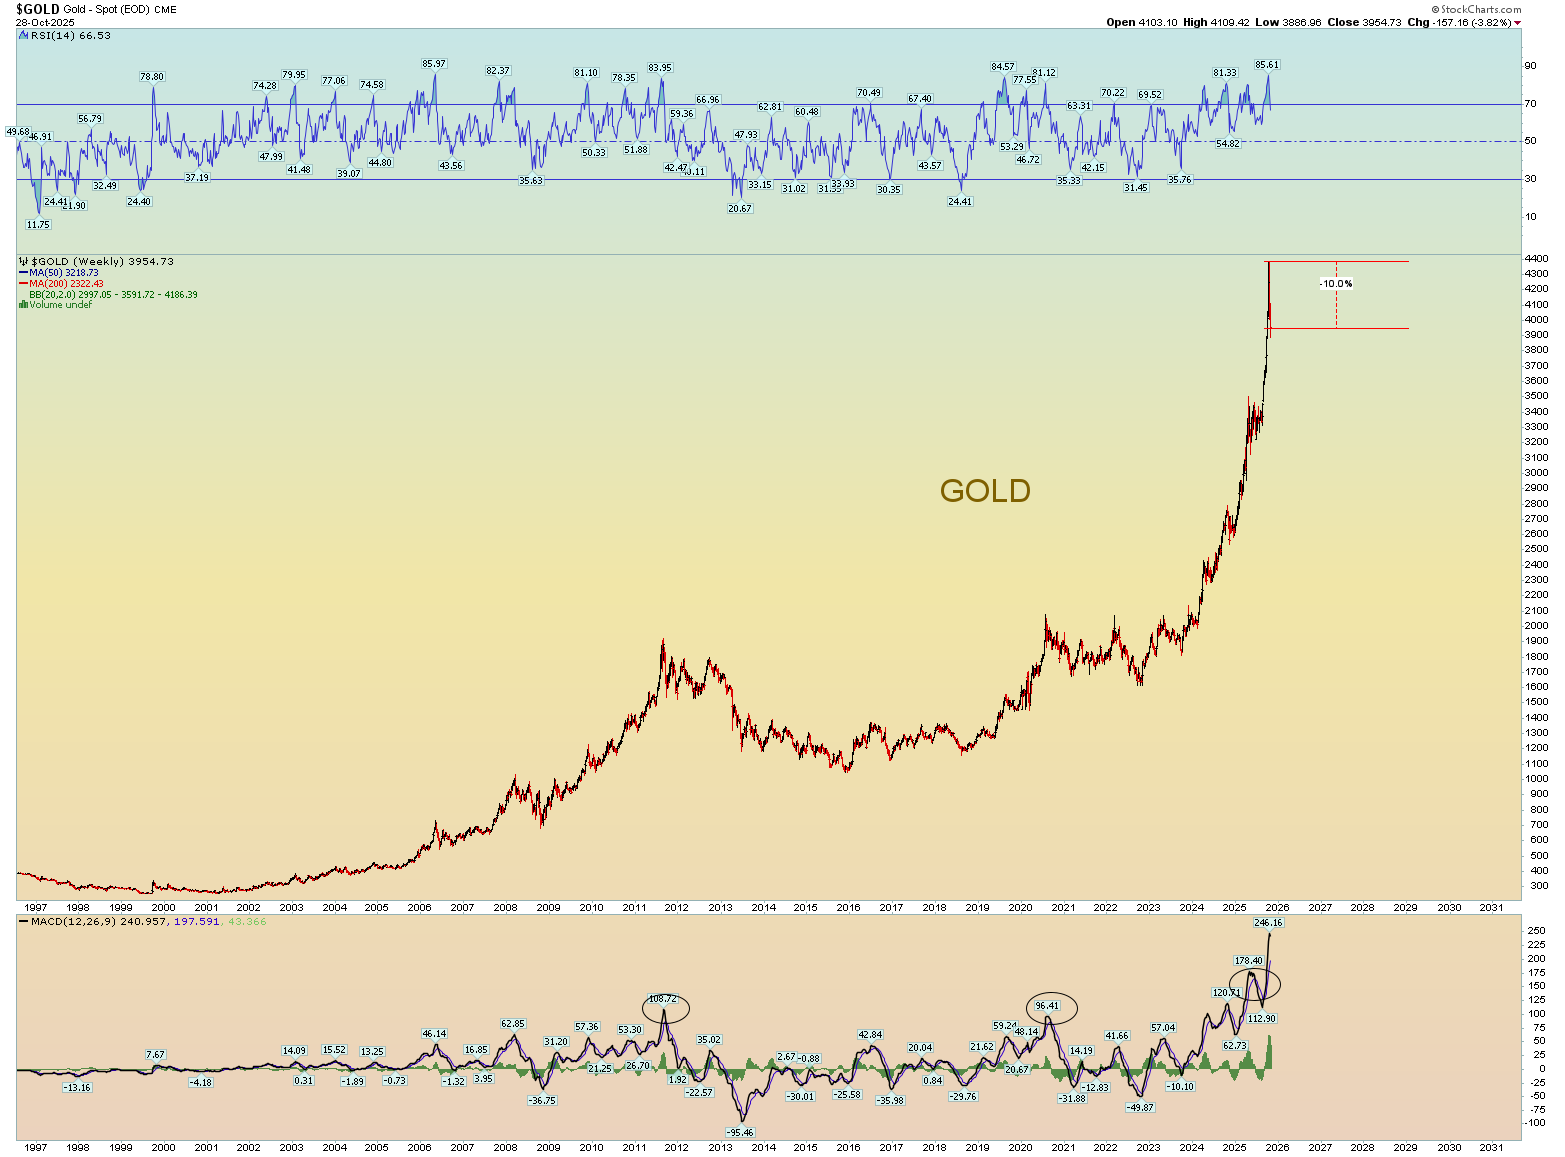
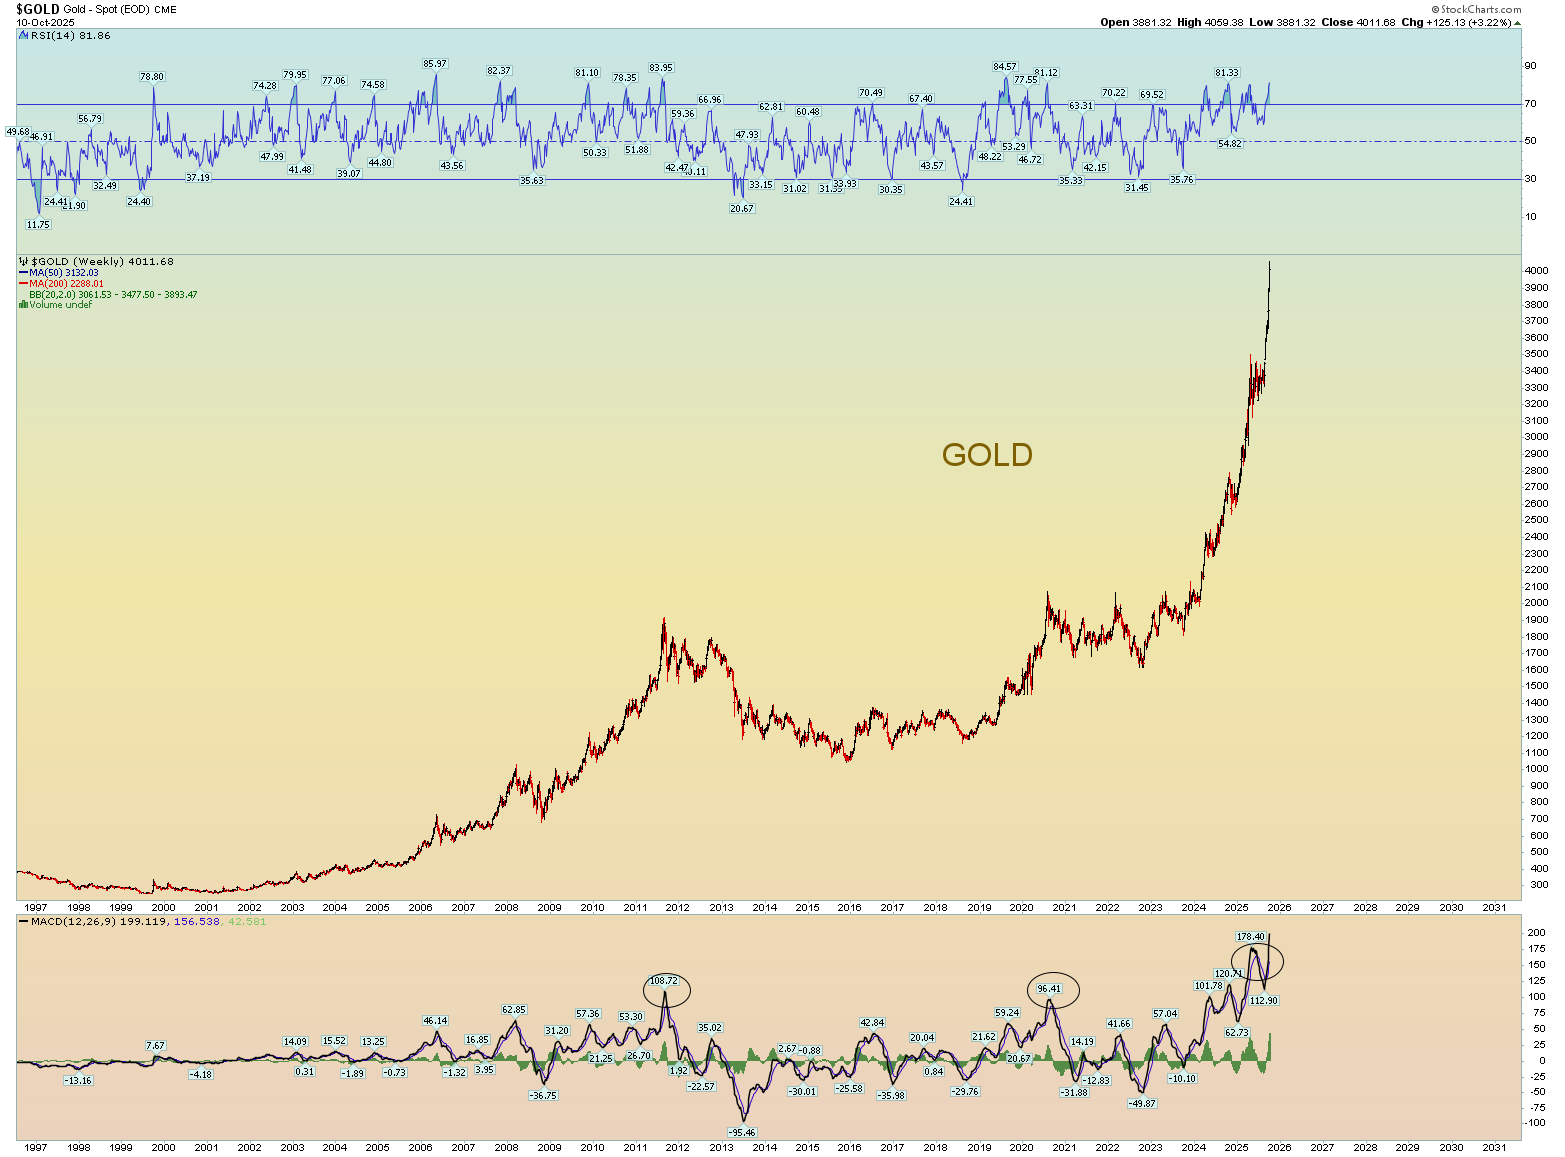
Gold went parabolic. The aftermath resulted in a 10% loss (at the least).
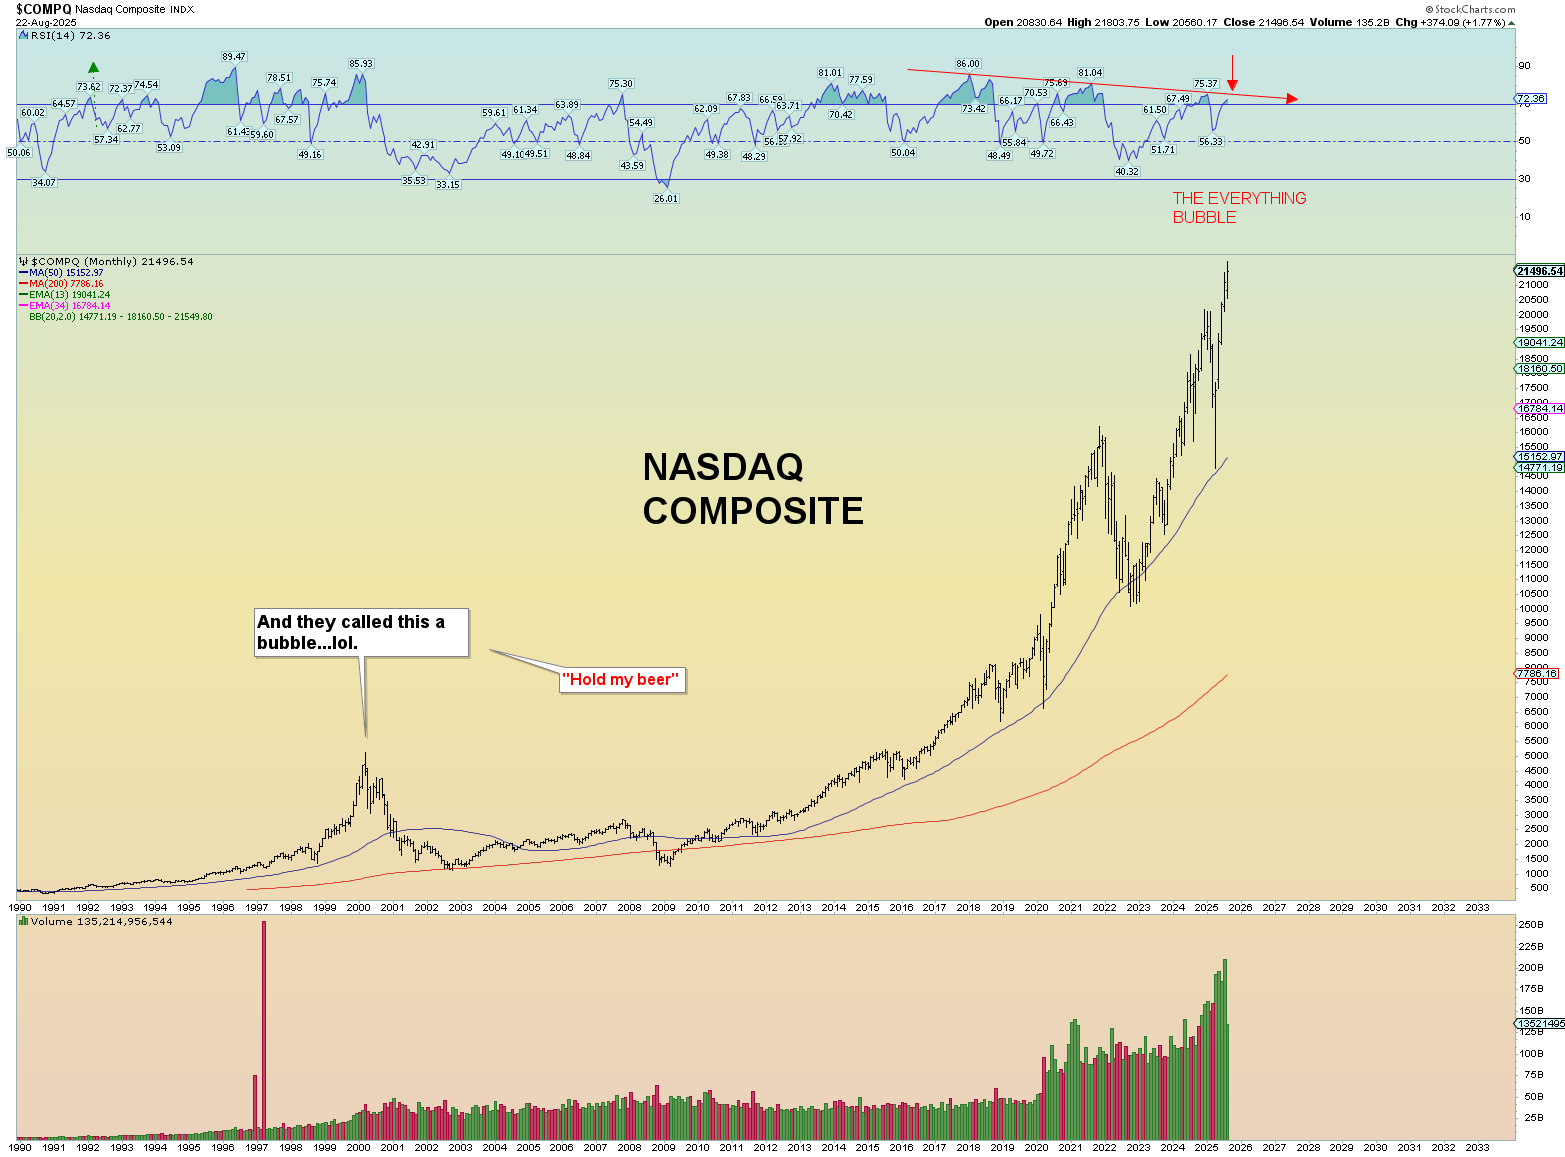
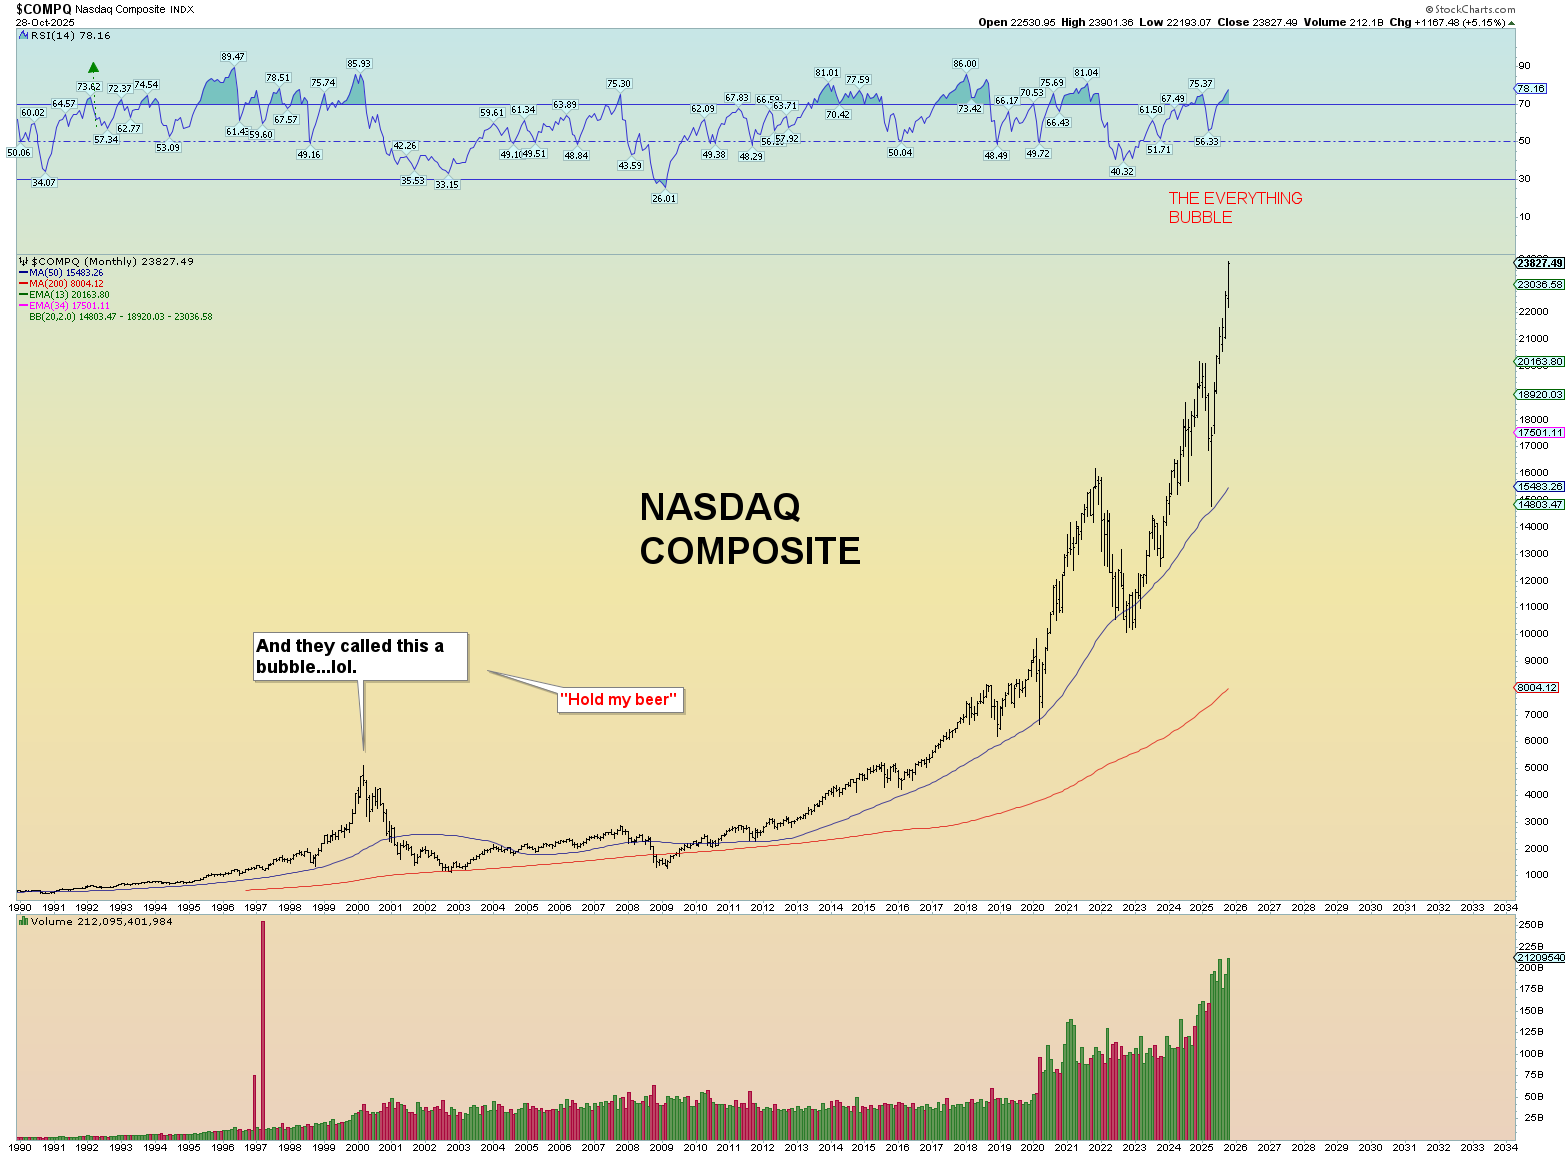
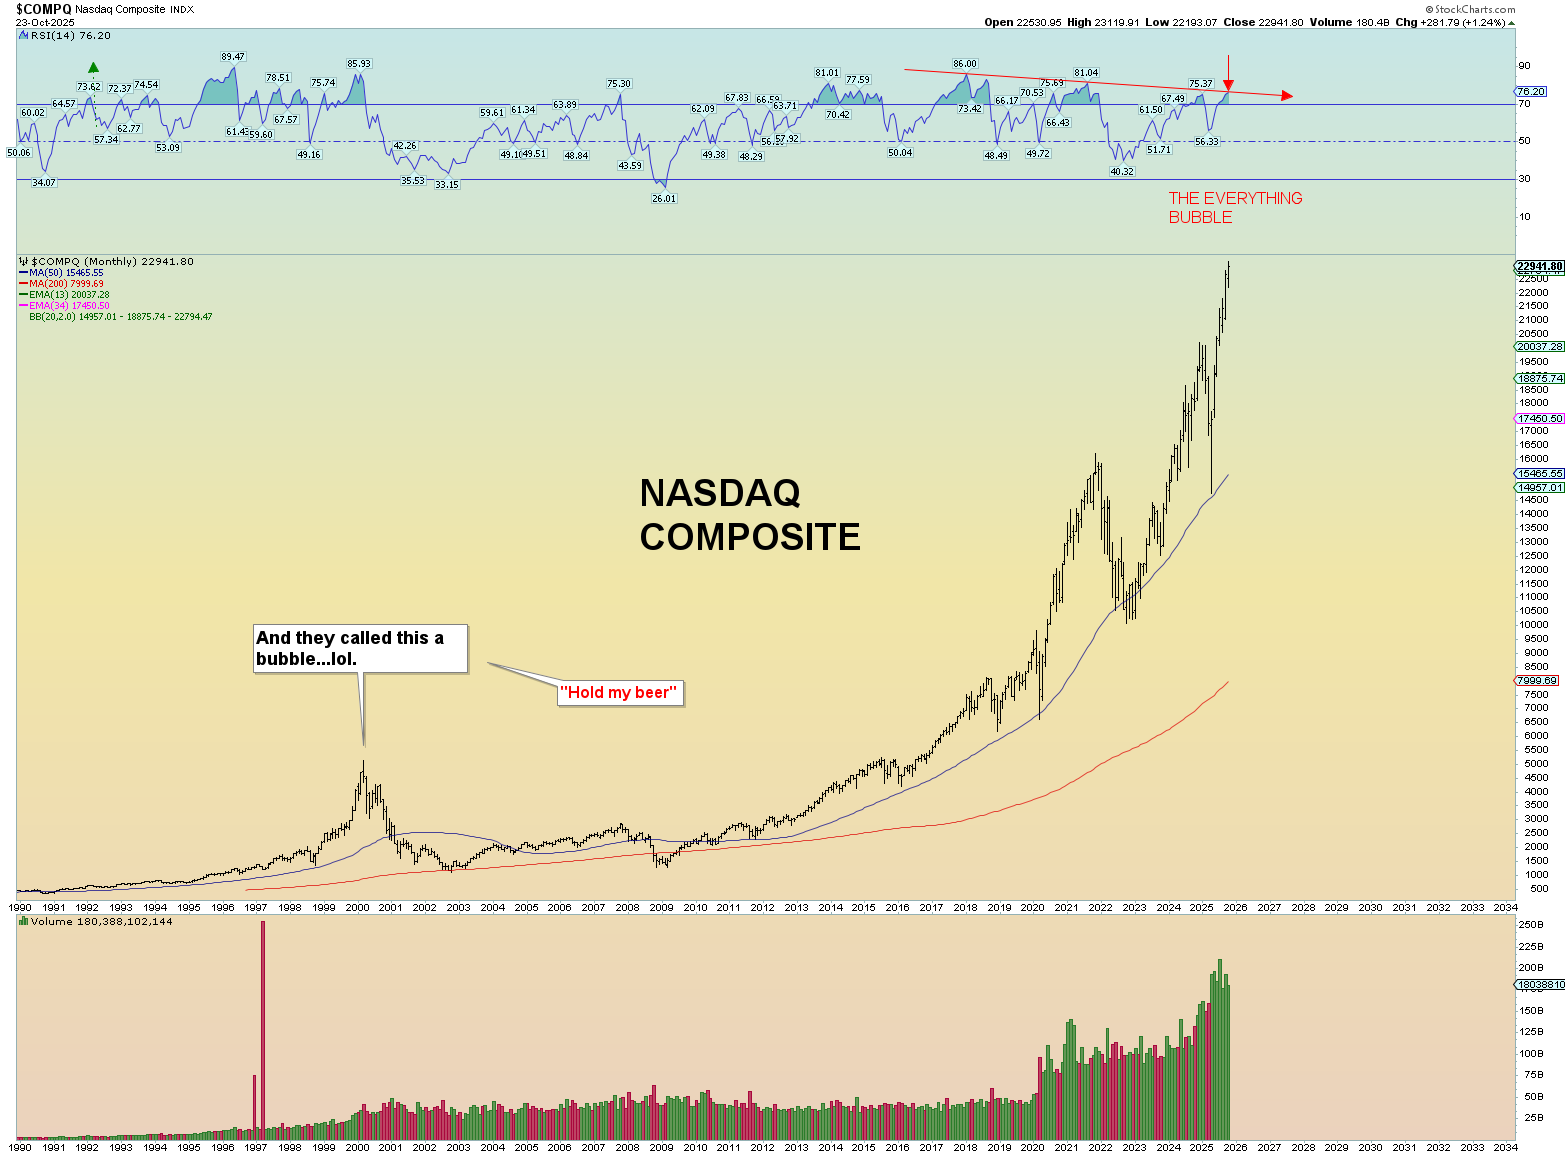
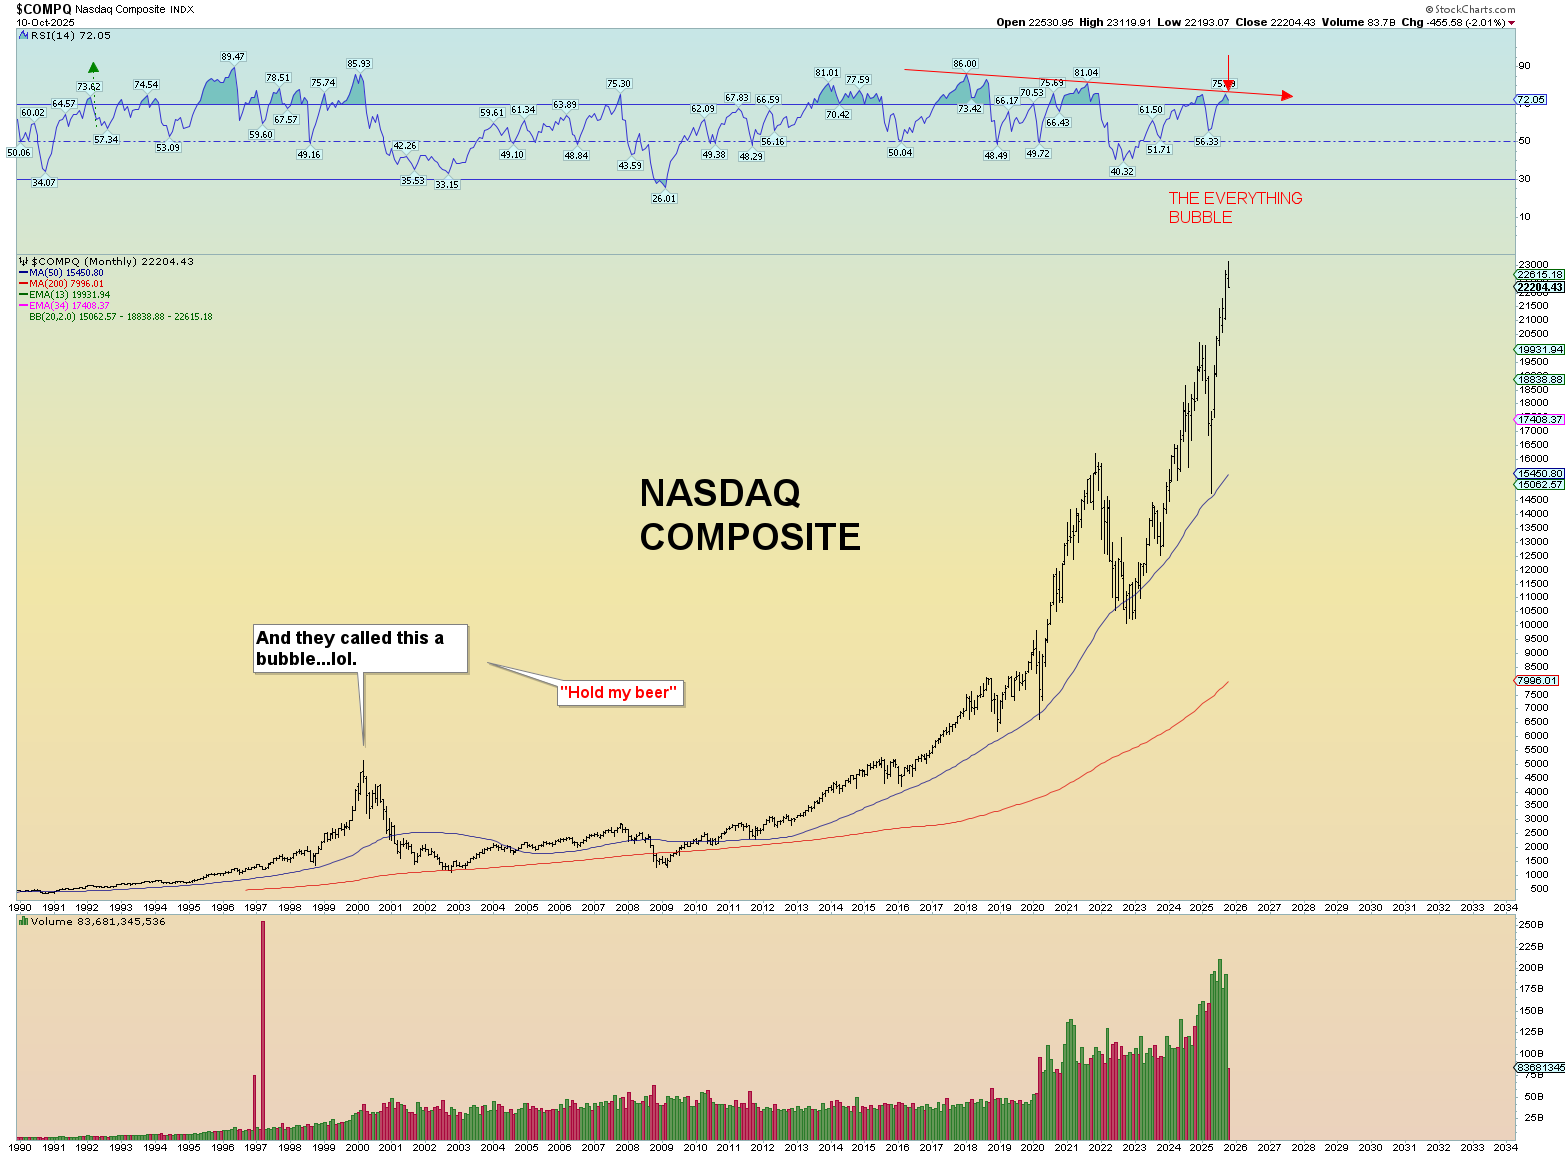
The NASDAQ is seemingly also going “parabolic”. A resulting collapse in price of at least 10% is predicted. But from the peak price point where that occurs has not yet been determined. But the more it goes up without pause, the more likelihood that a subsequent price collapse will occur. In other words, if you are one who is rooting for an epic price collapse, then you should be rooting for first a parabolic rise which seems to be happening. The recent parabolic rise is not long term bullish, but bearish is the argument. Getting the whole world convinced on the same side of the trade at the same time.
See what they do, not what they may say. It’s been overwhelmingly one-sided to the upside concerning equities.
Possible squiggle count:
Possible ending diagonal triangle

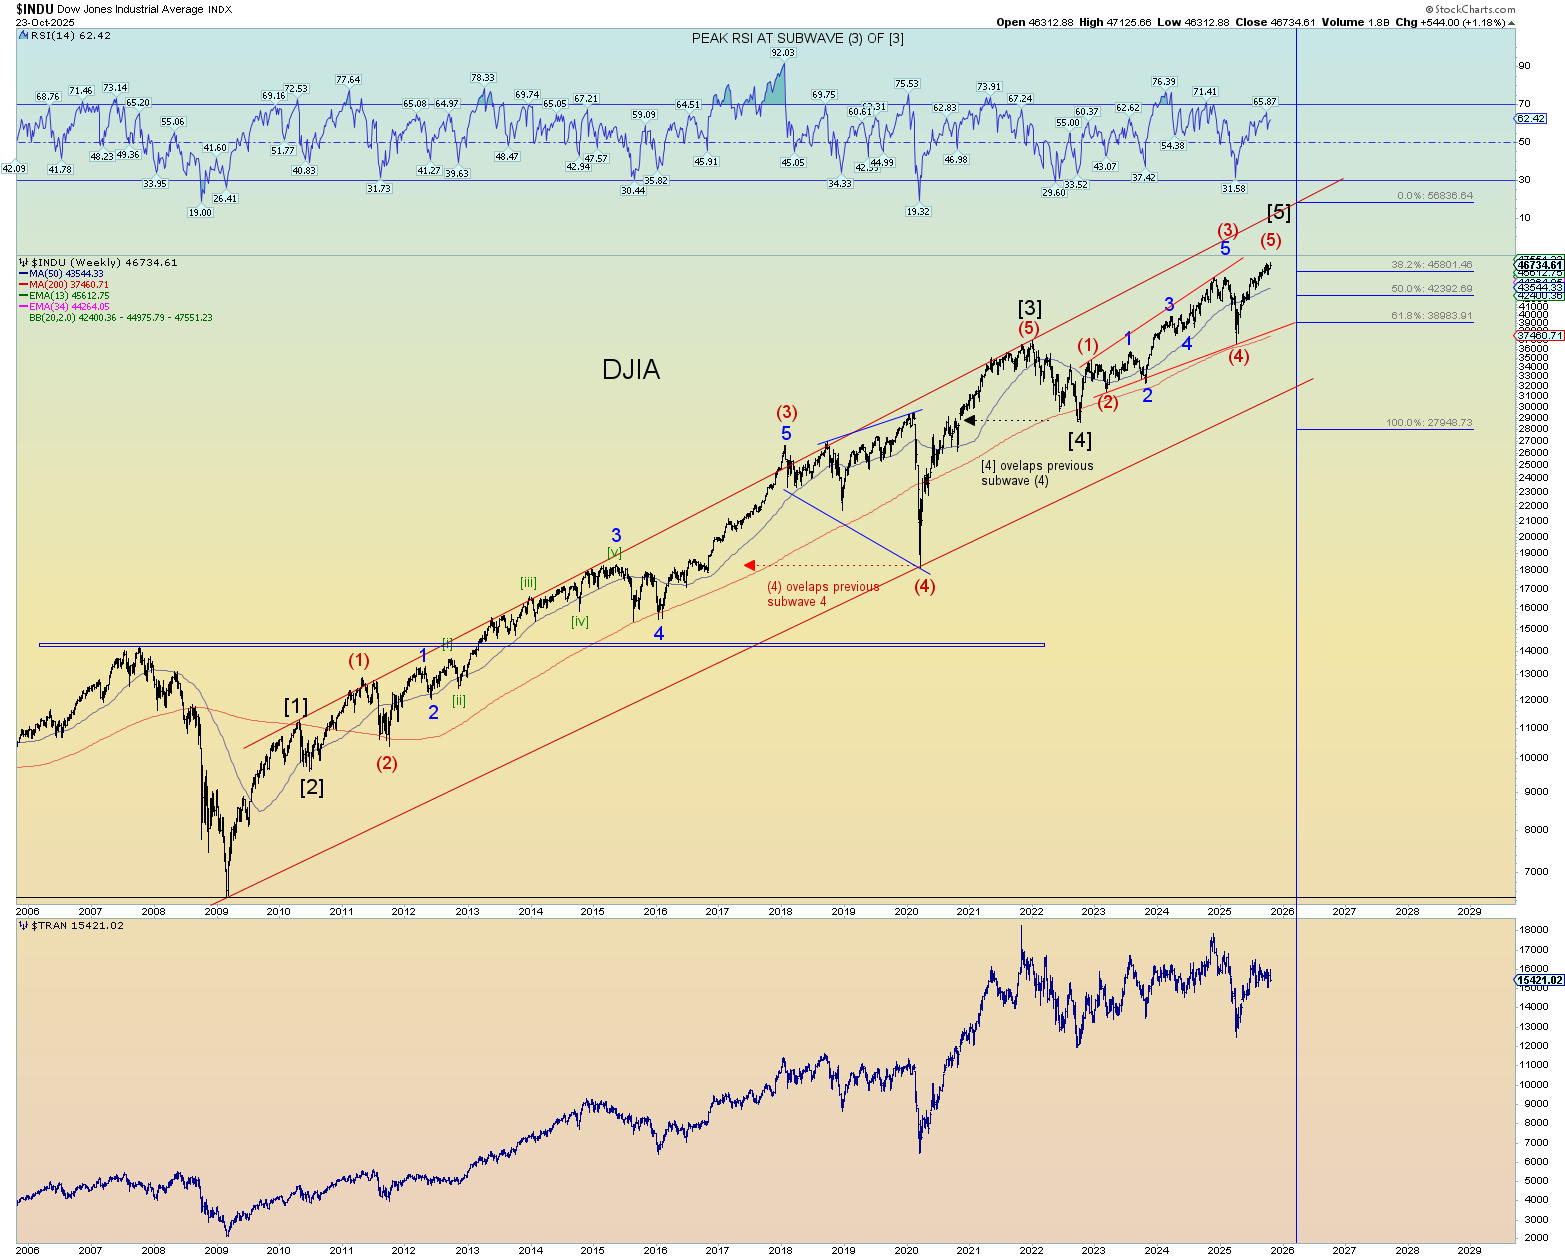
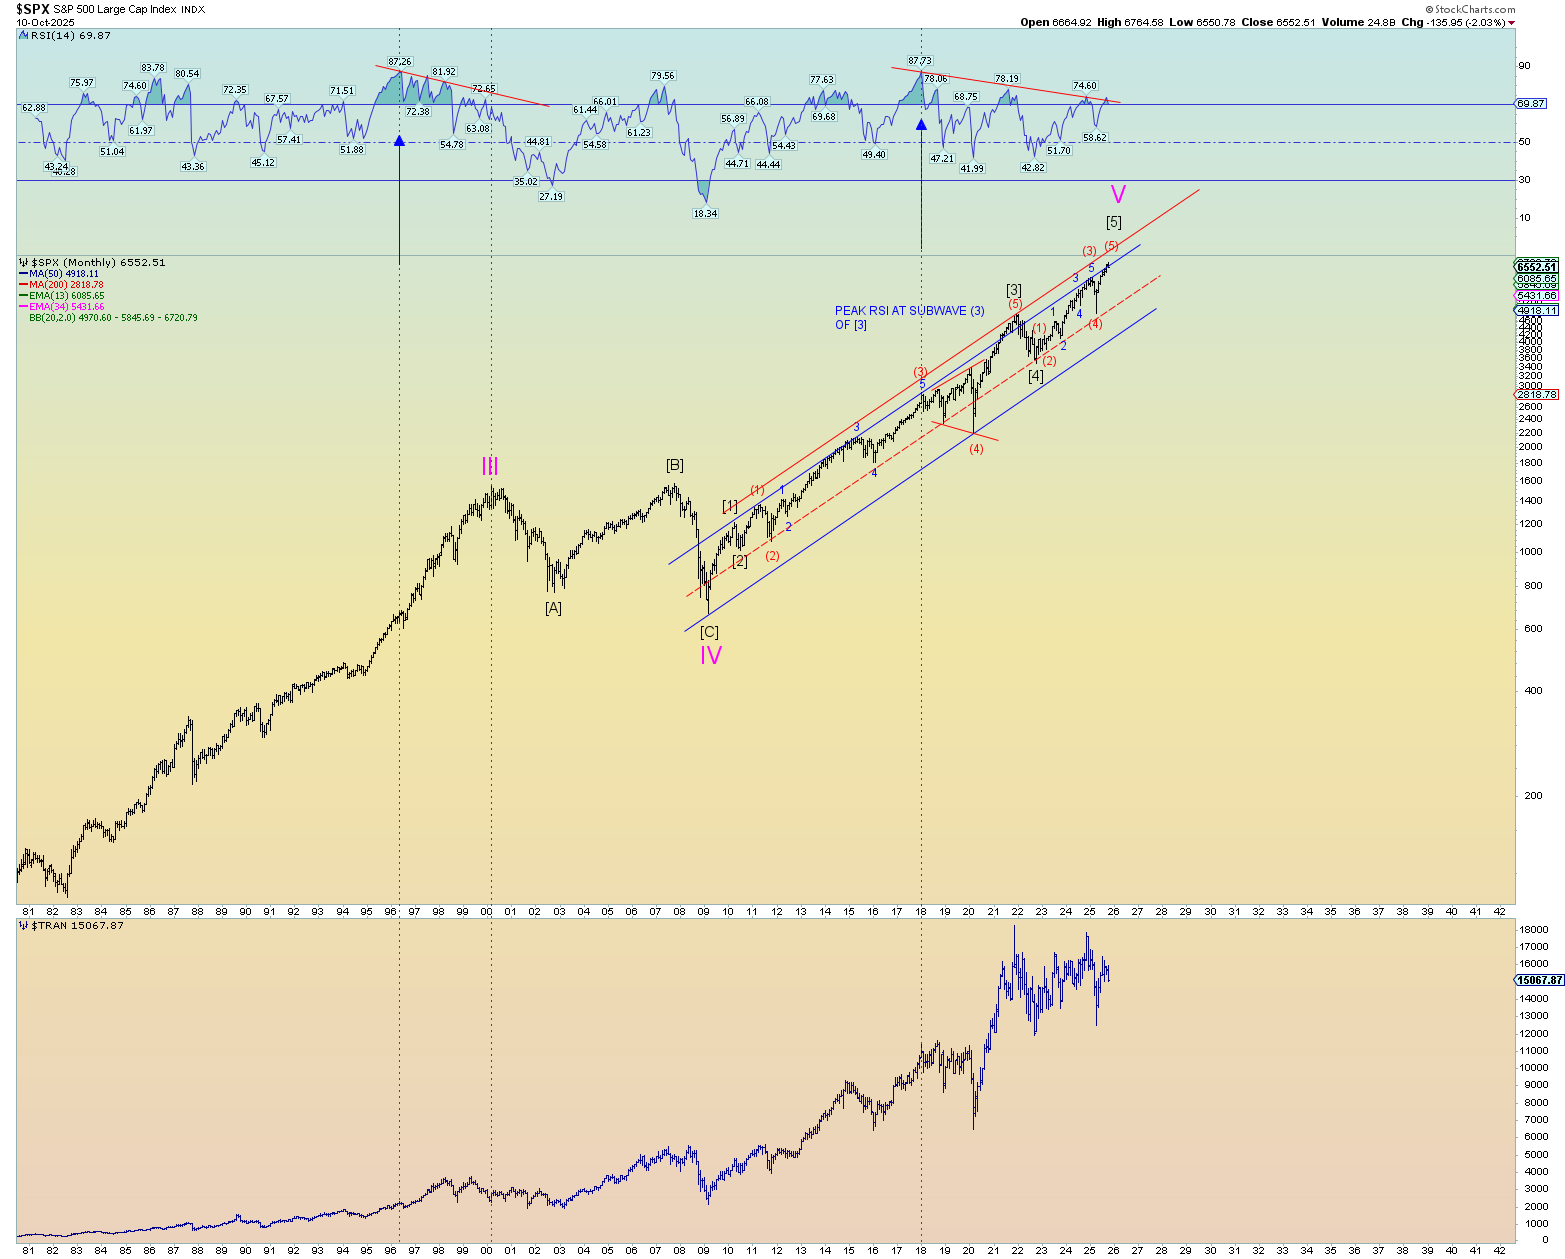
This count looks reasonable yes?
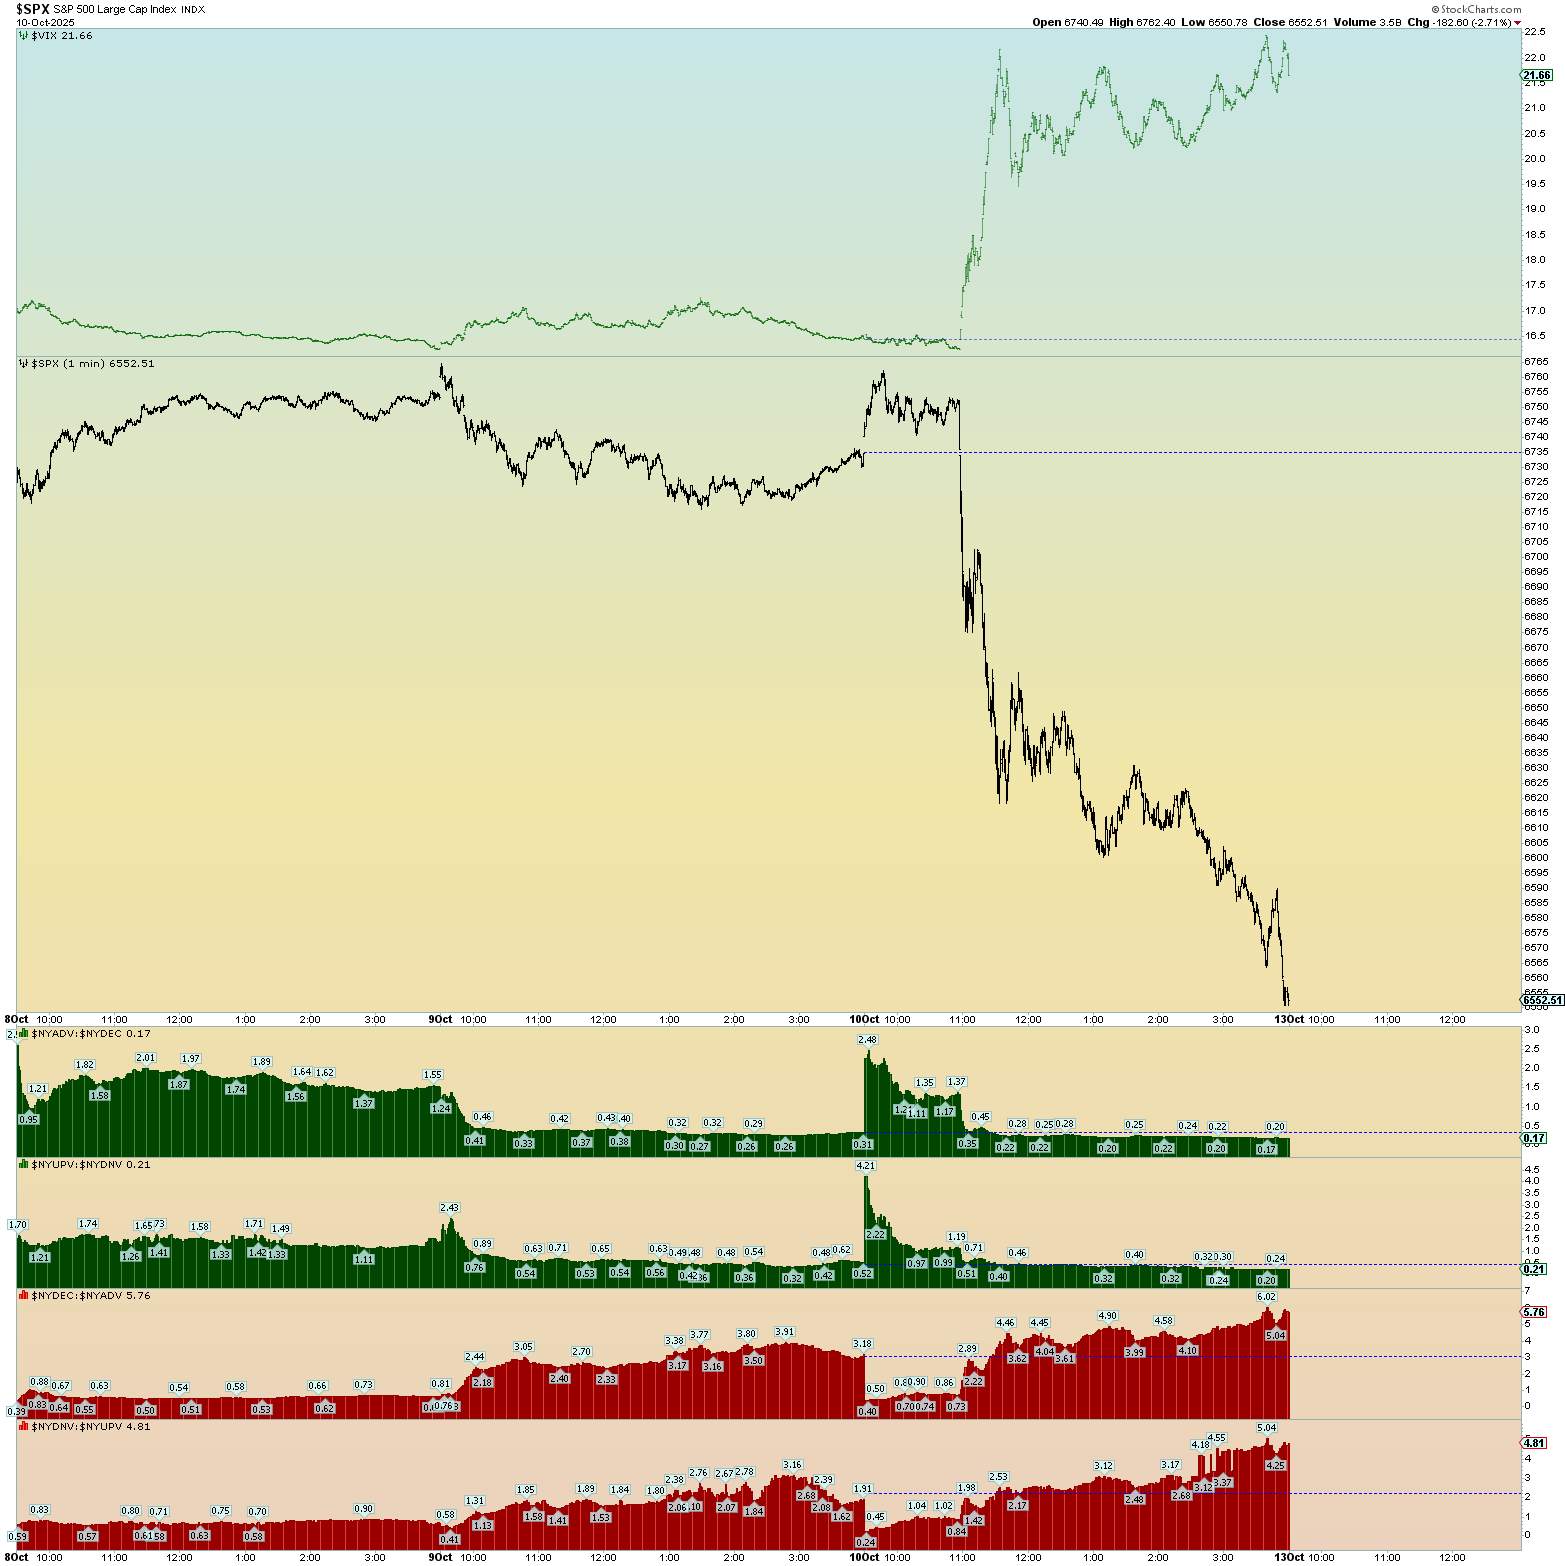
From the opening high of 9 October, its counts well as a 5-wave impulse down.
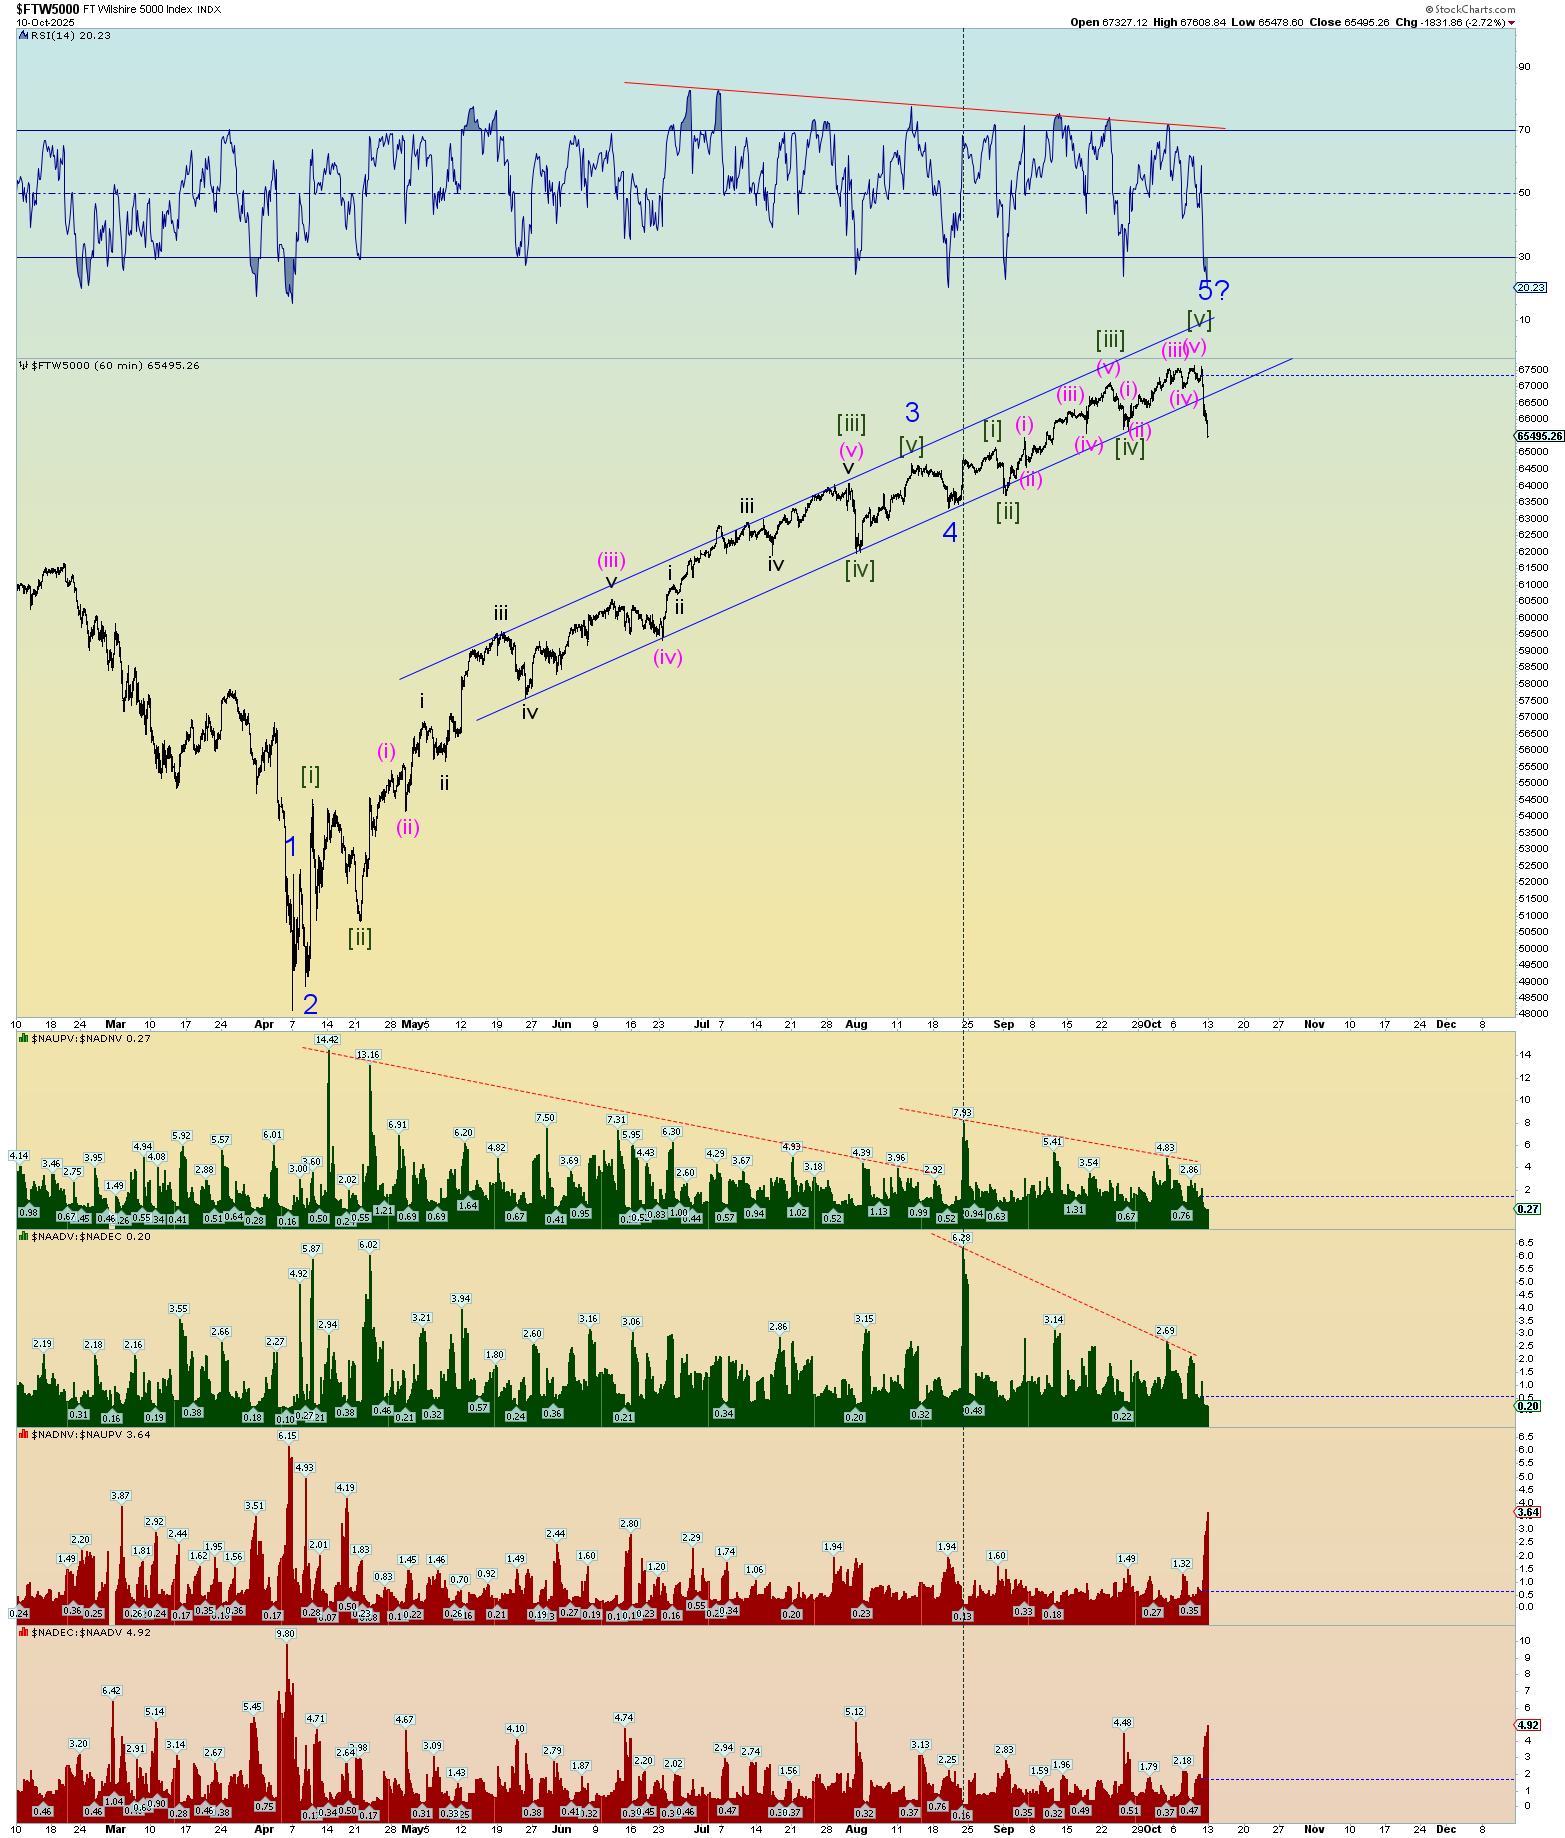
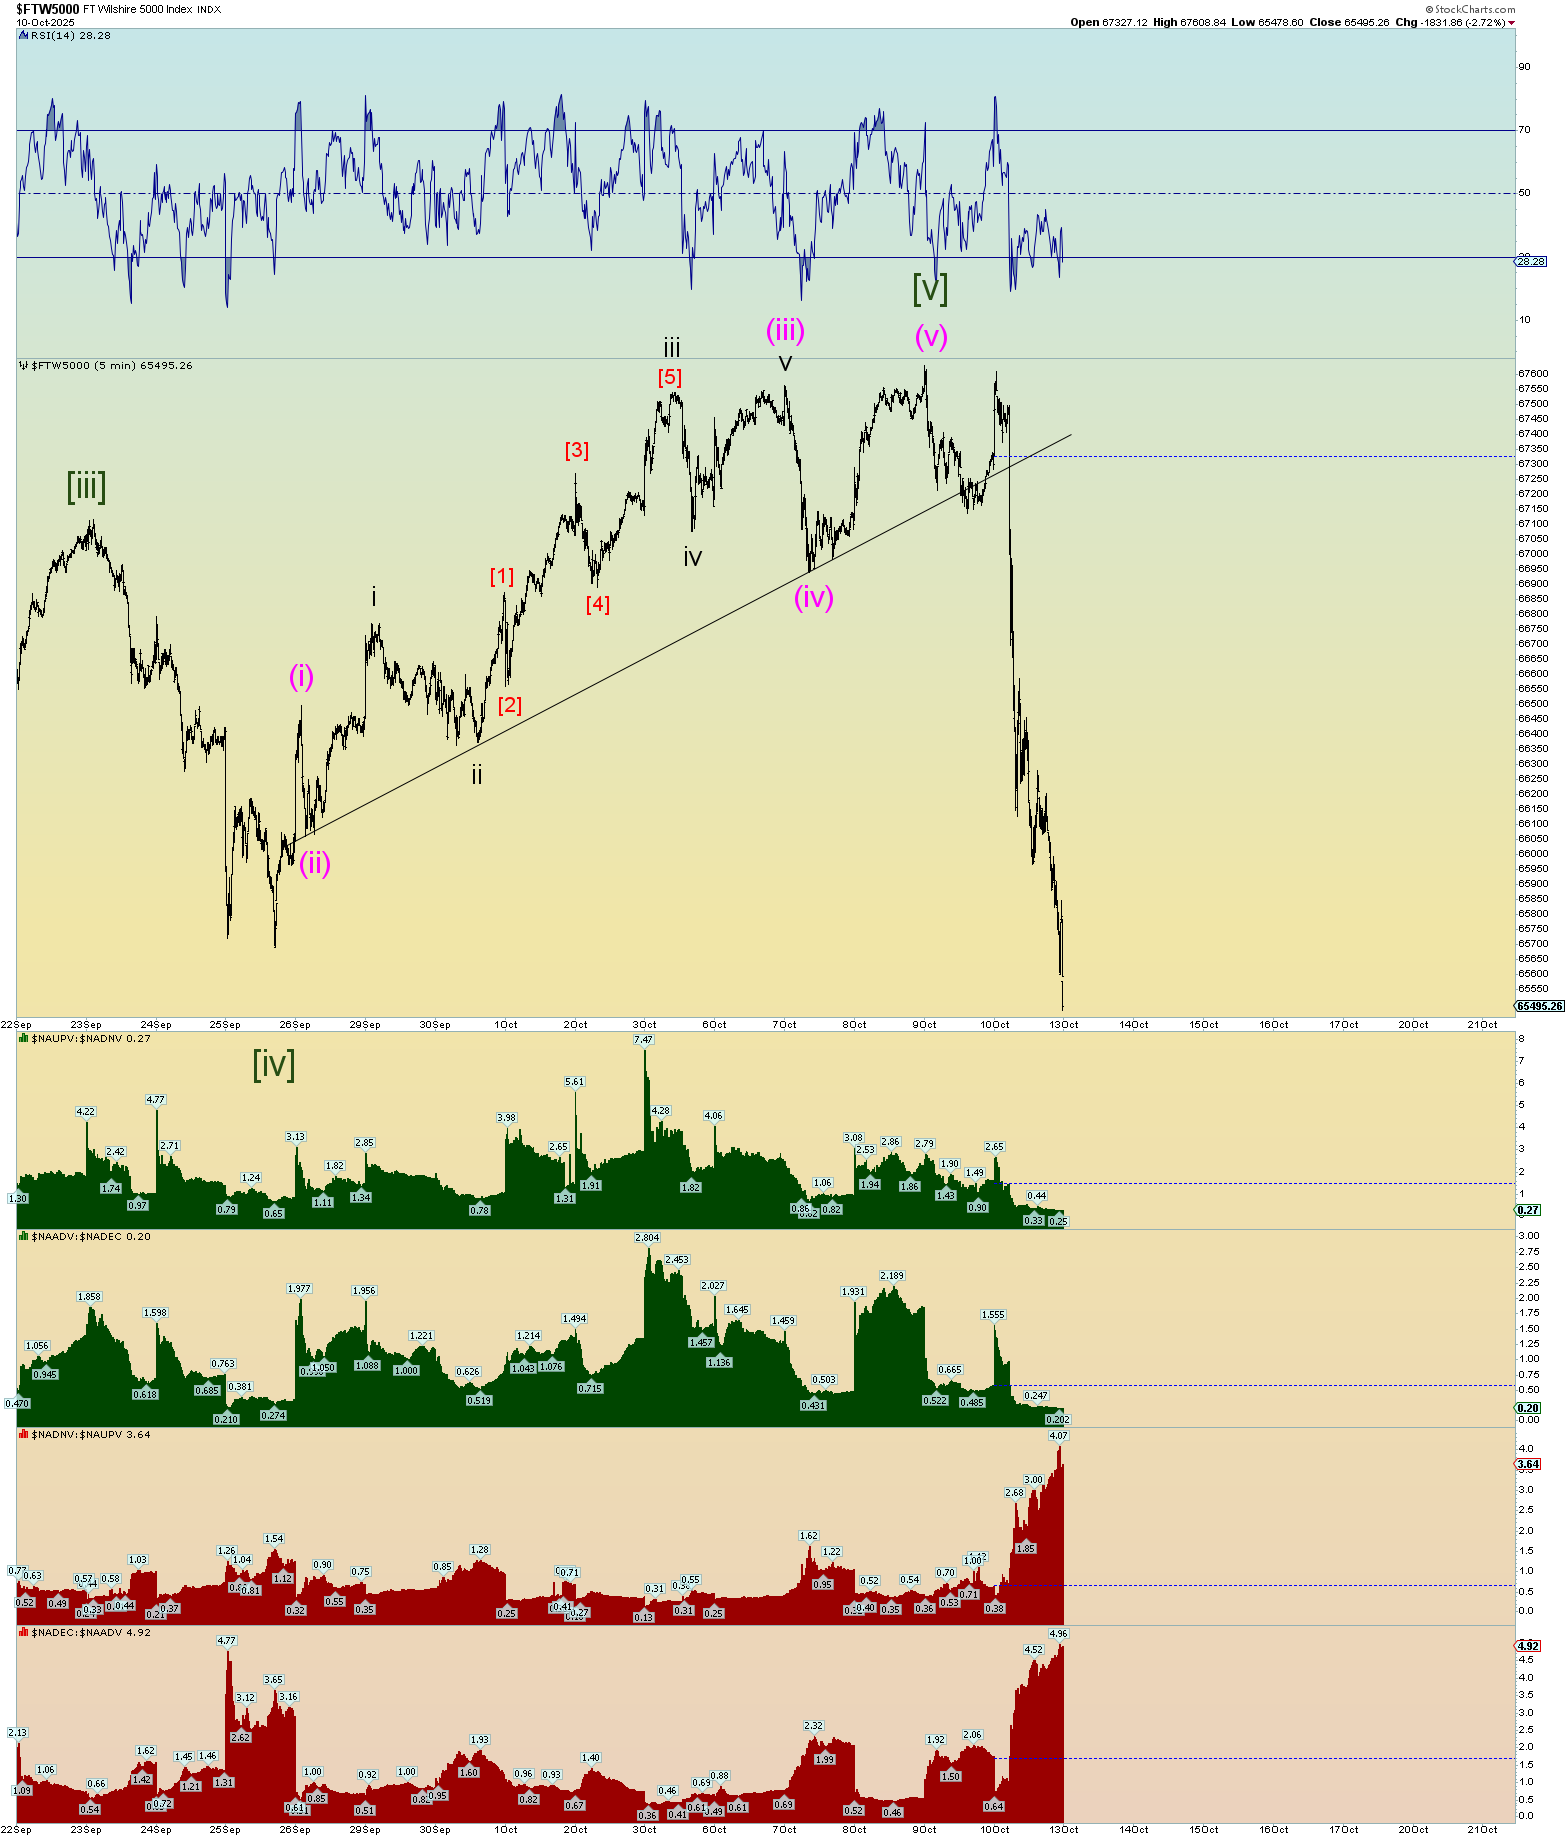
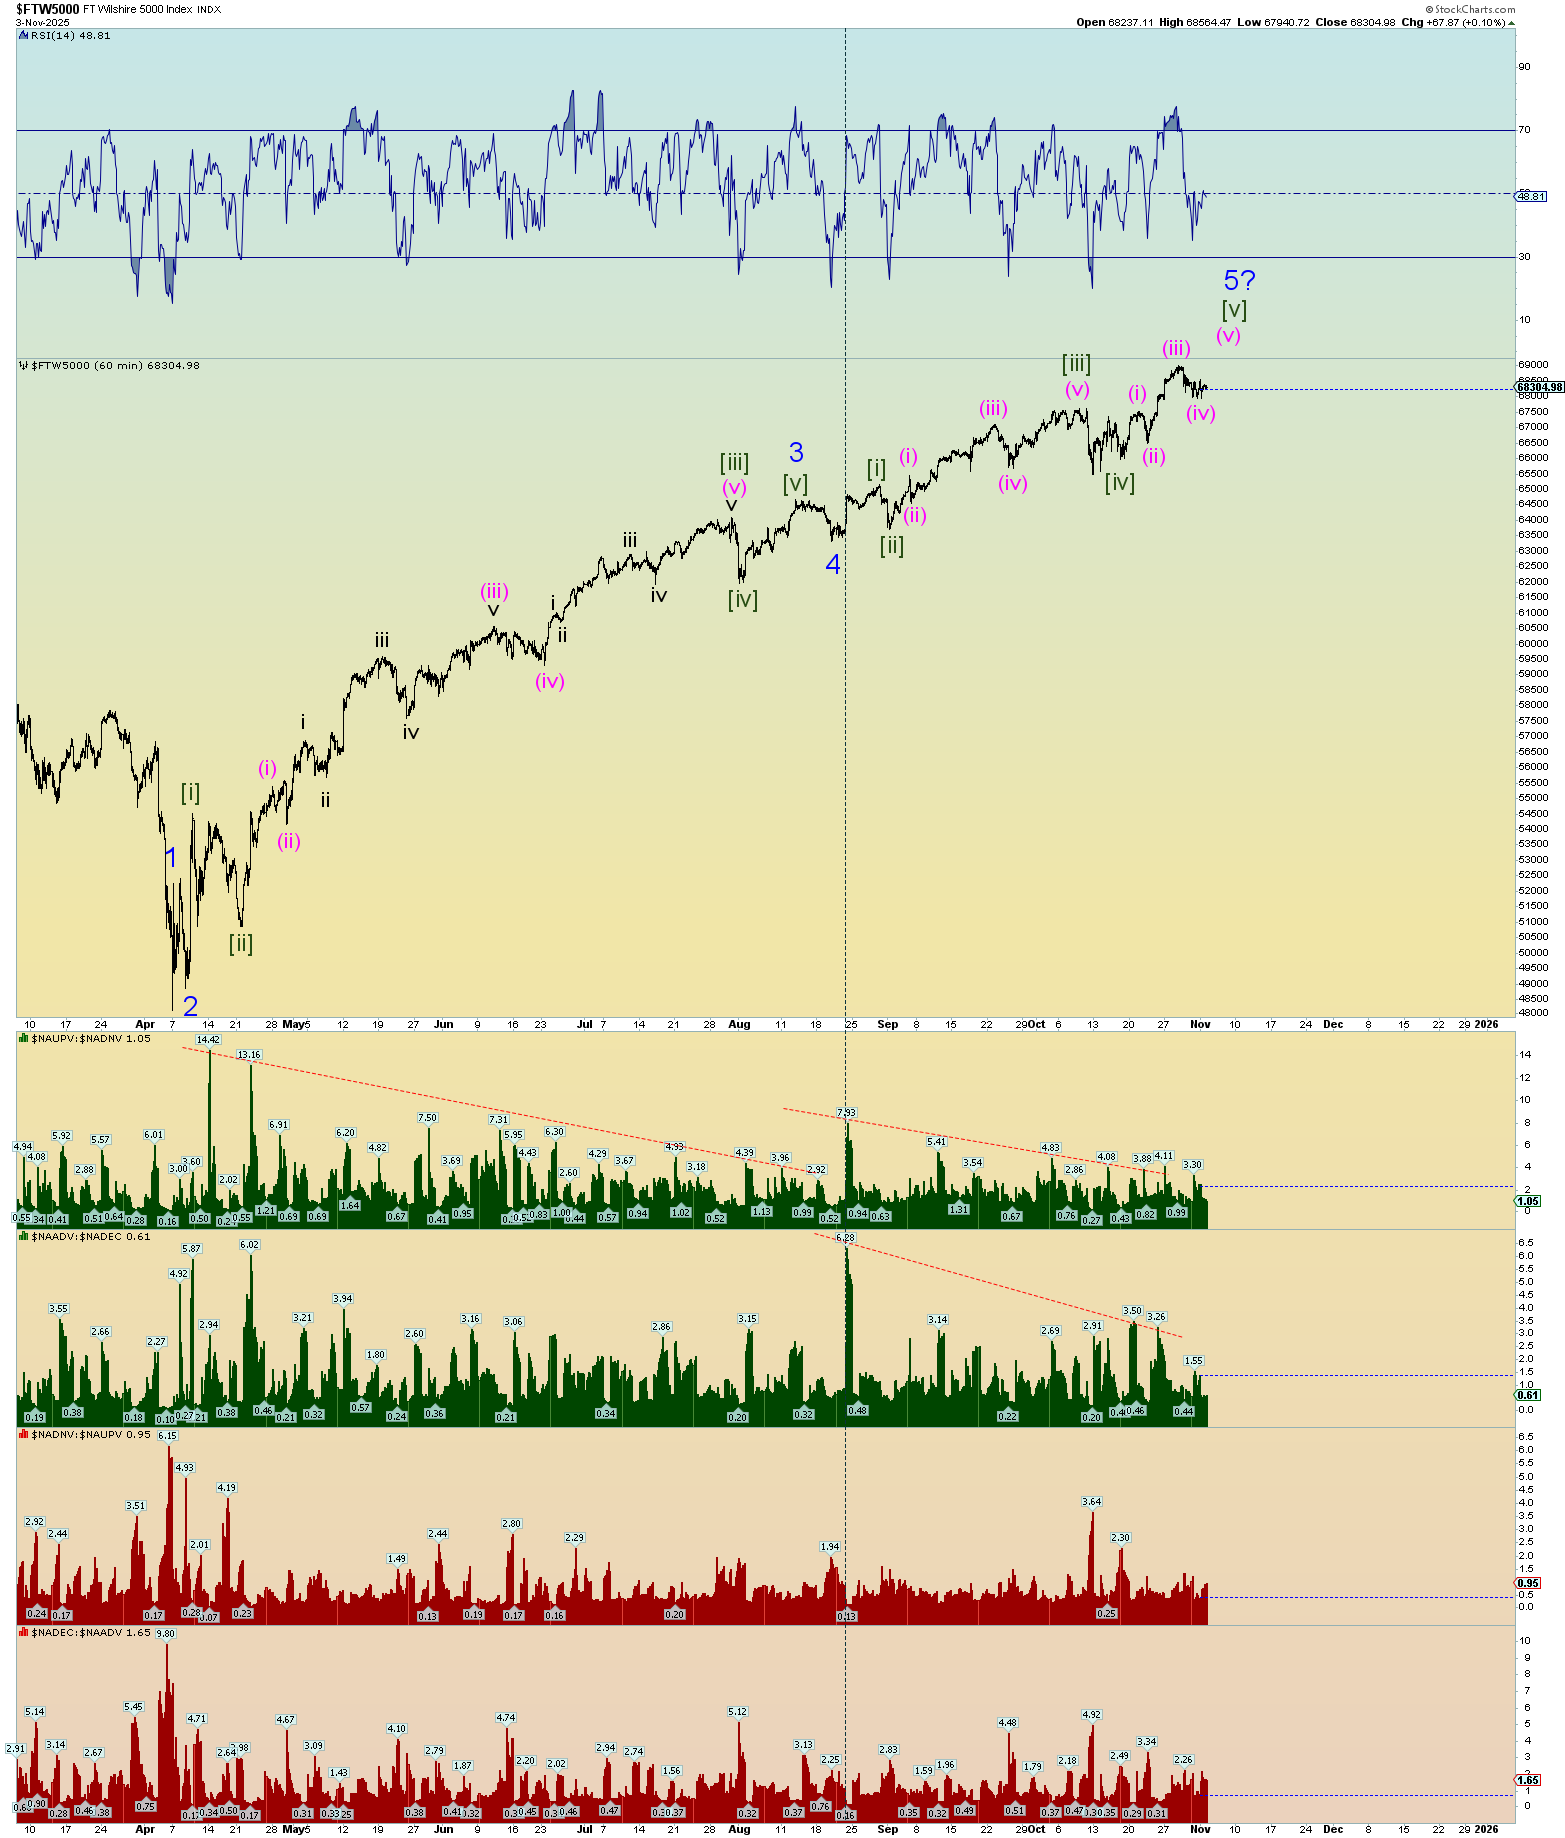
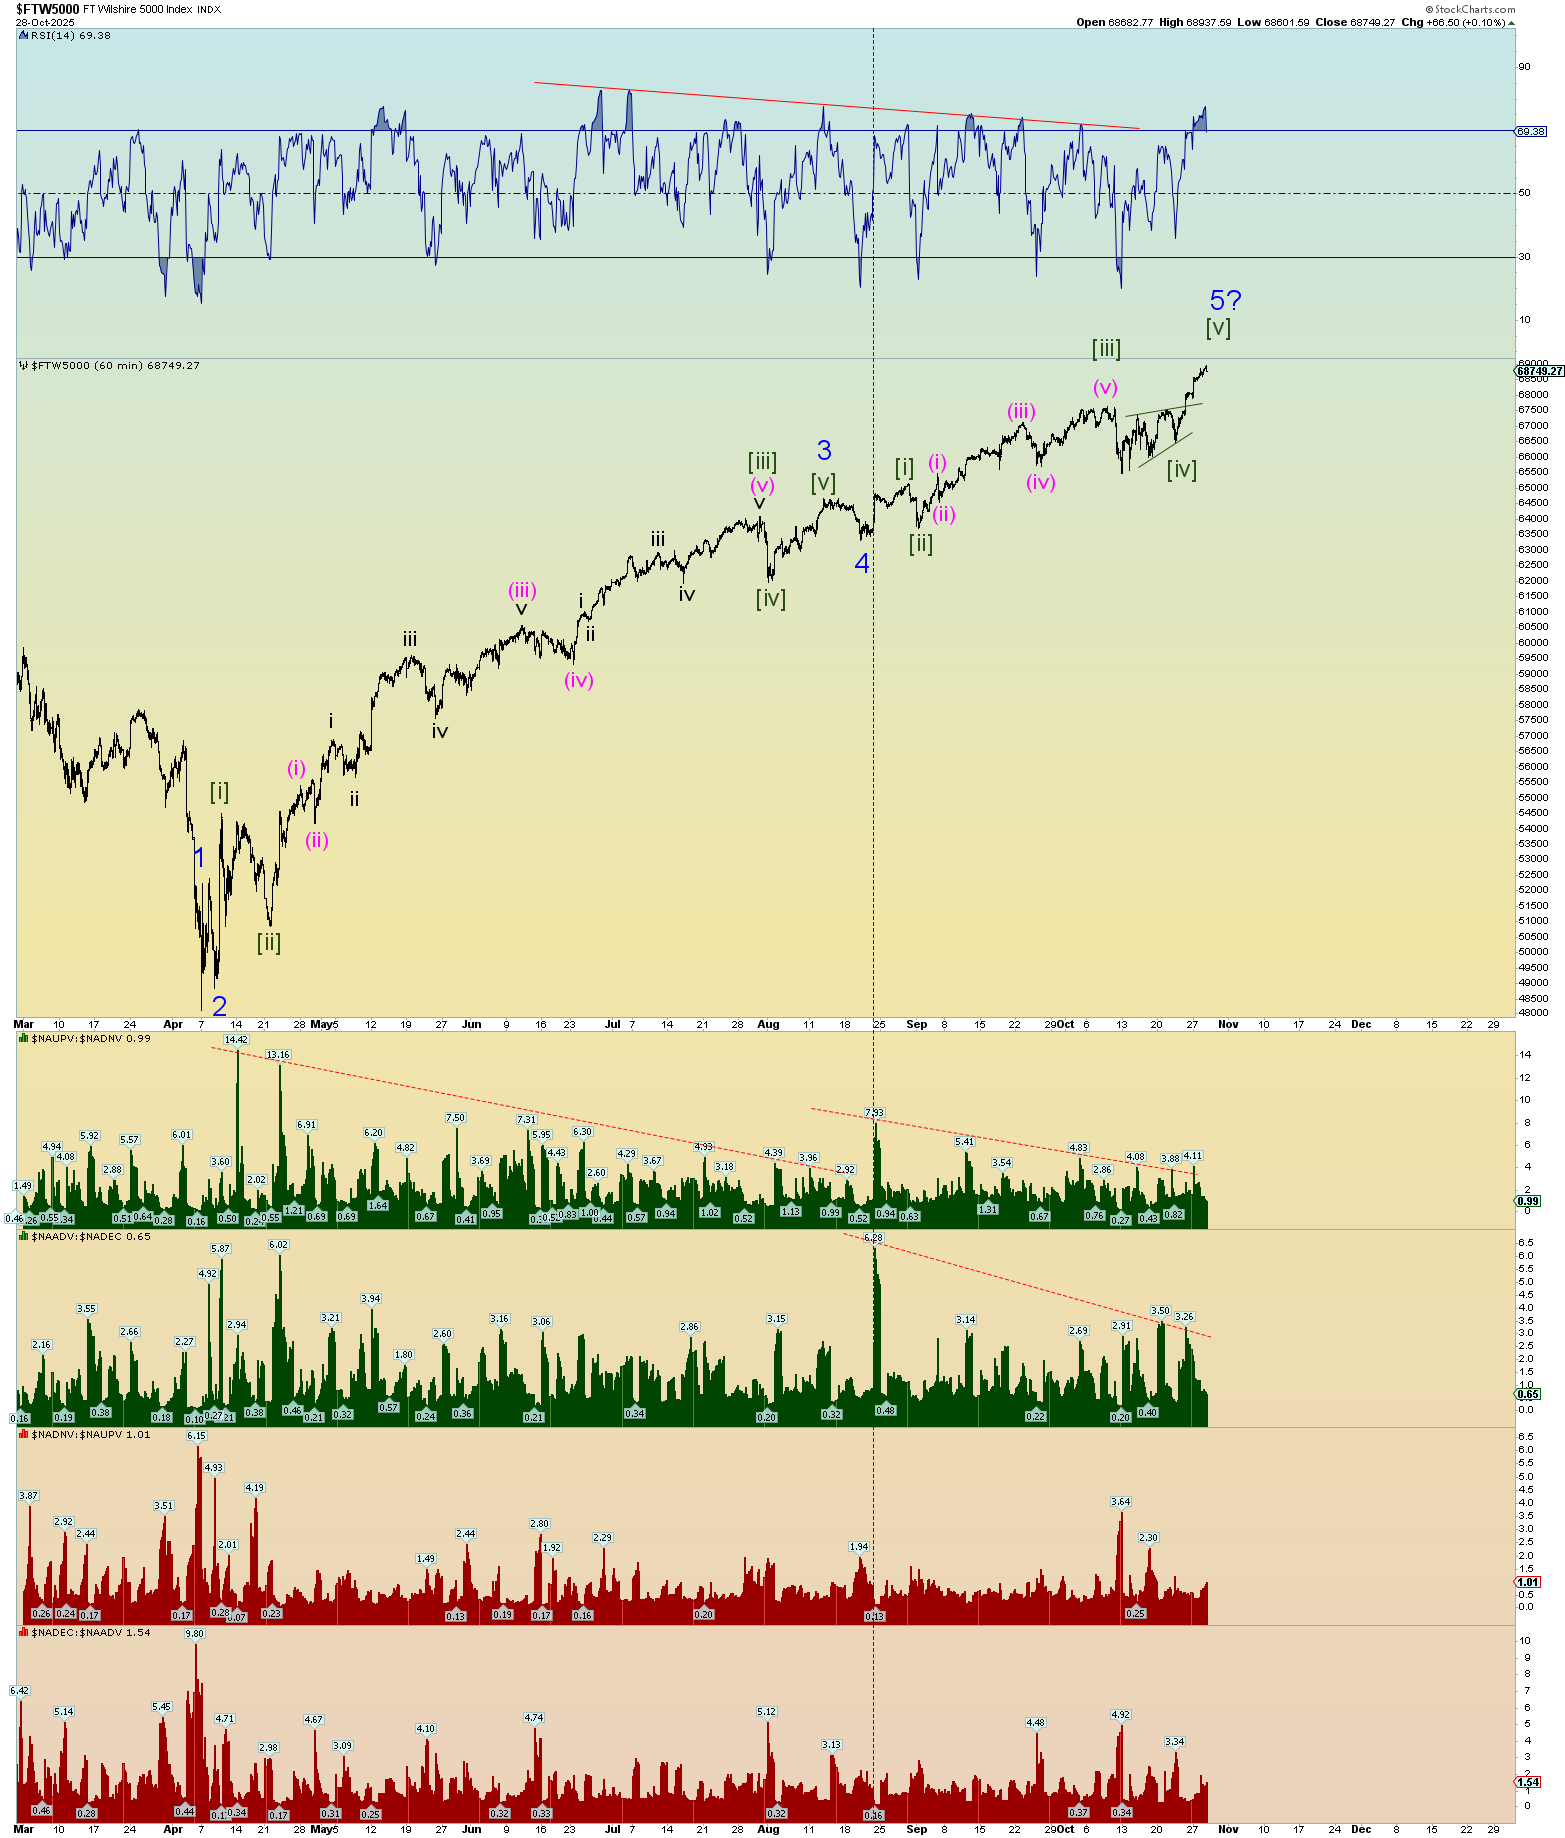
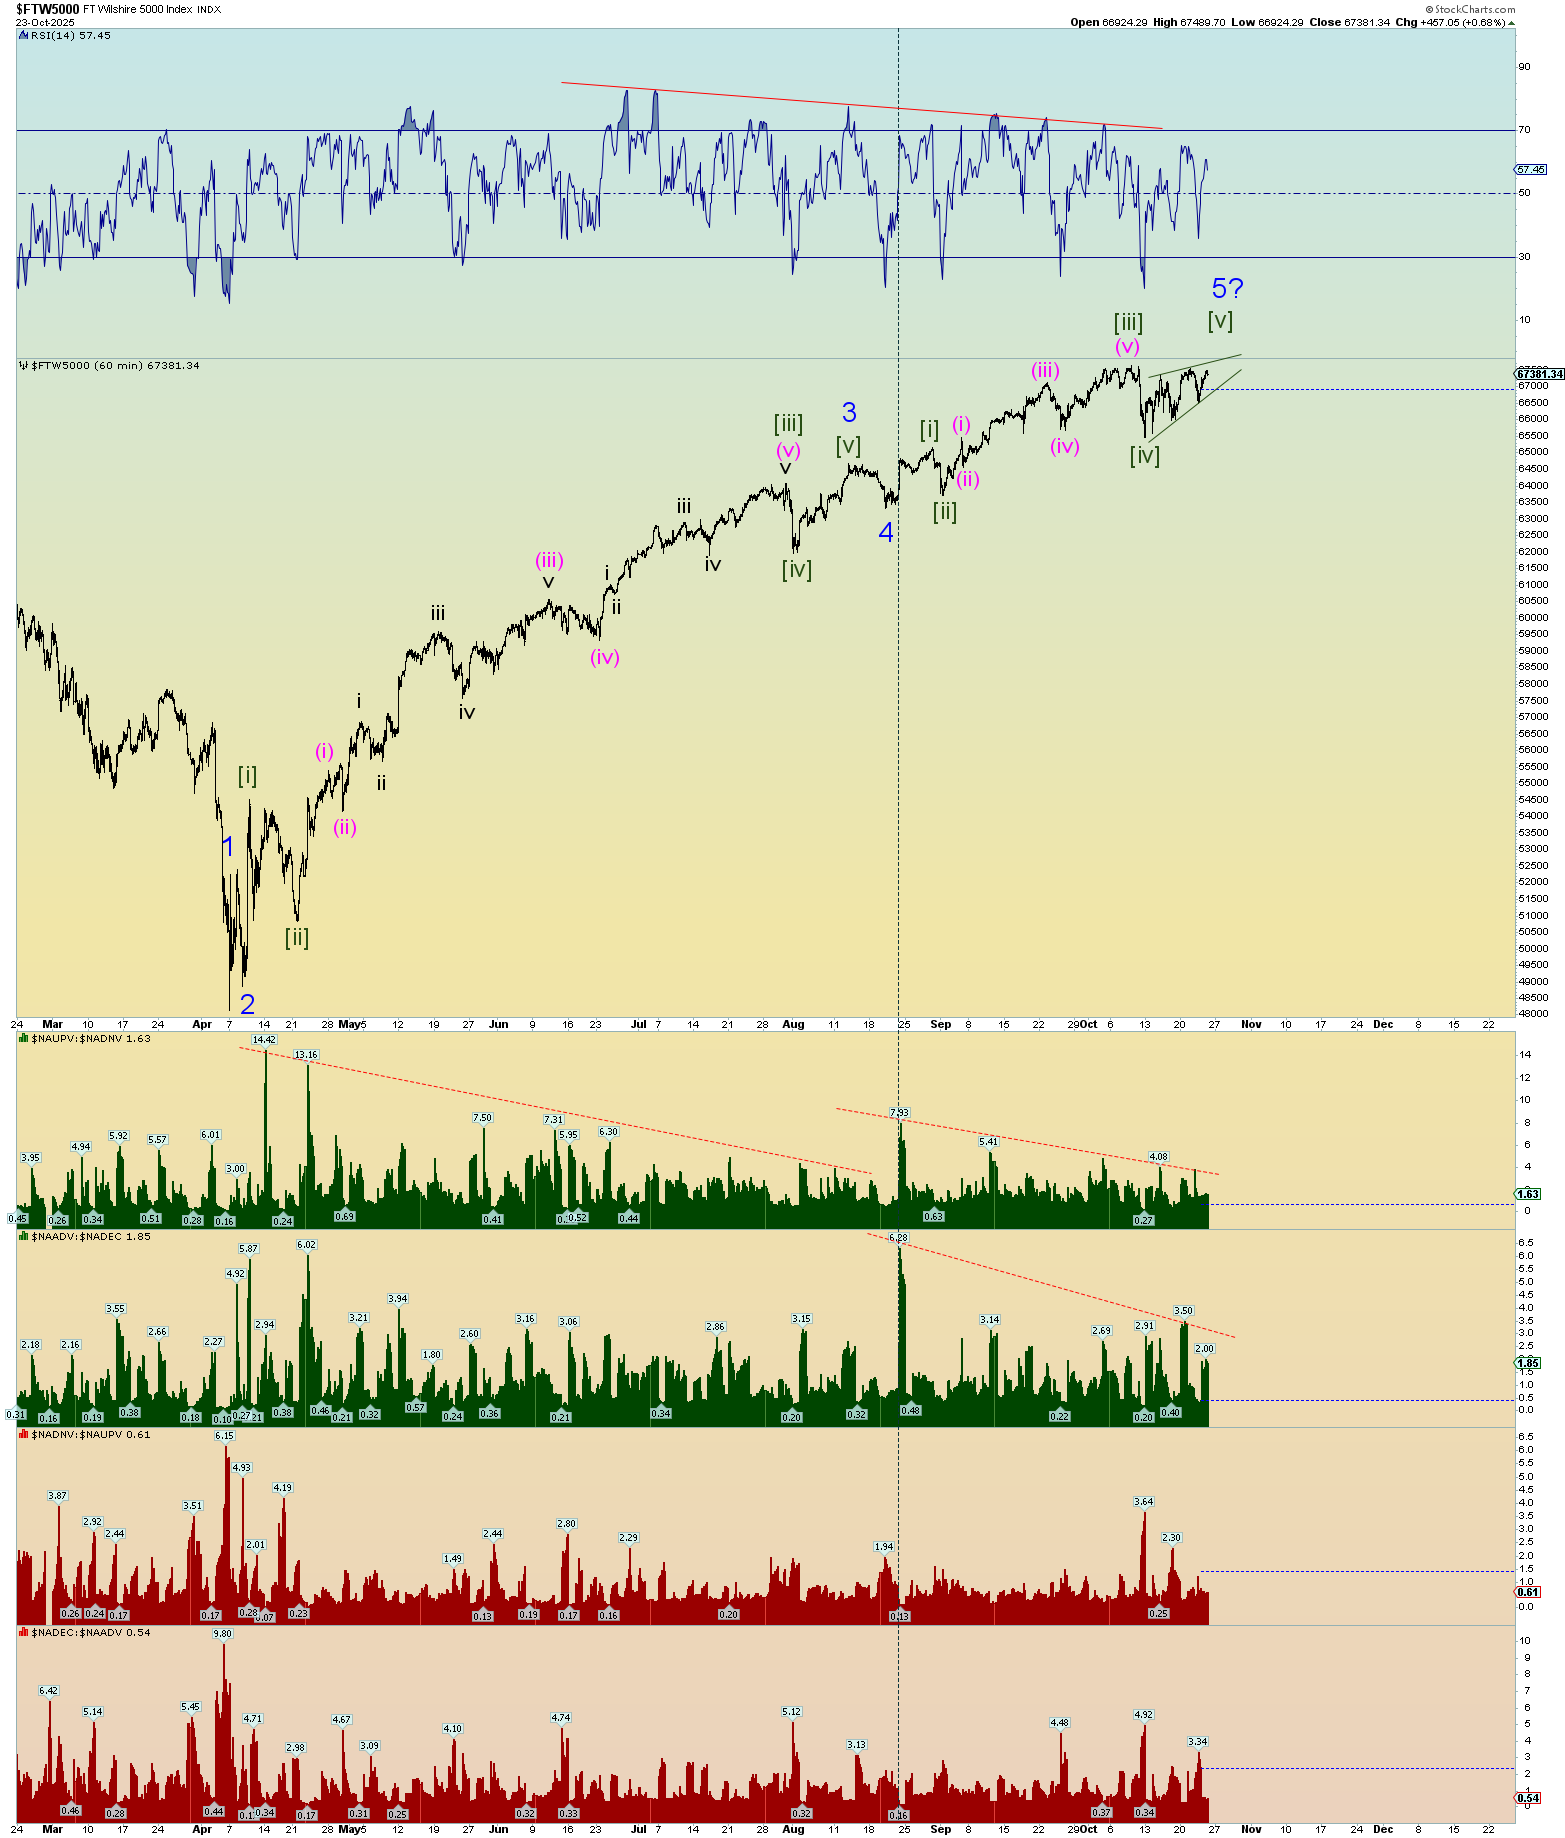
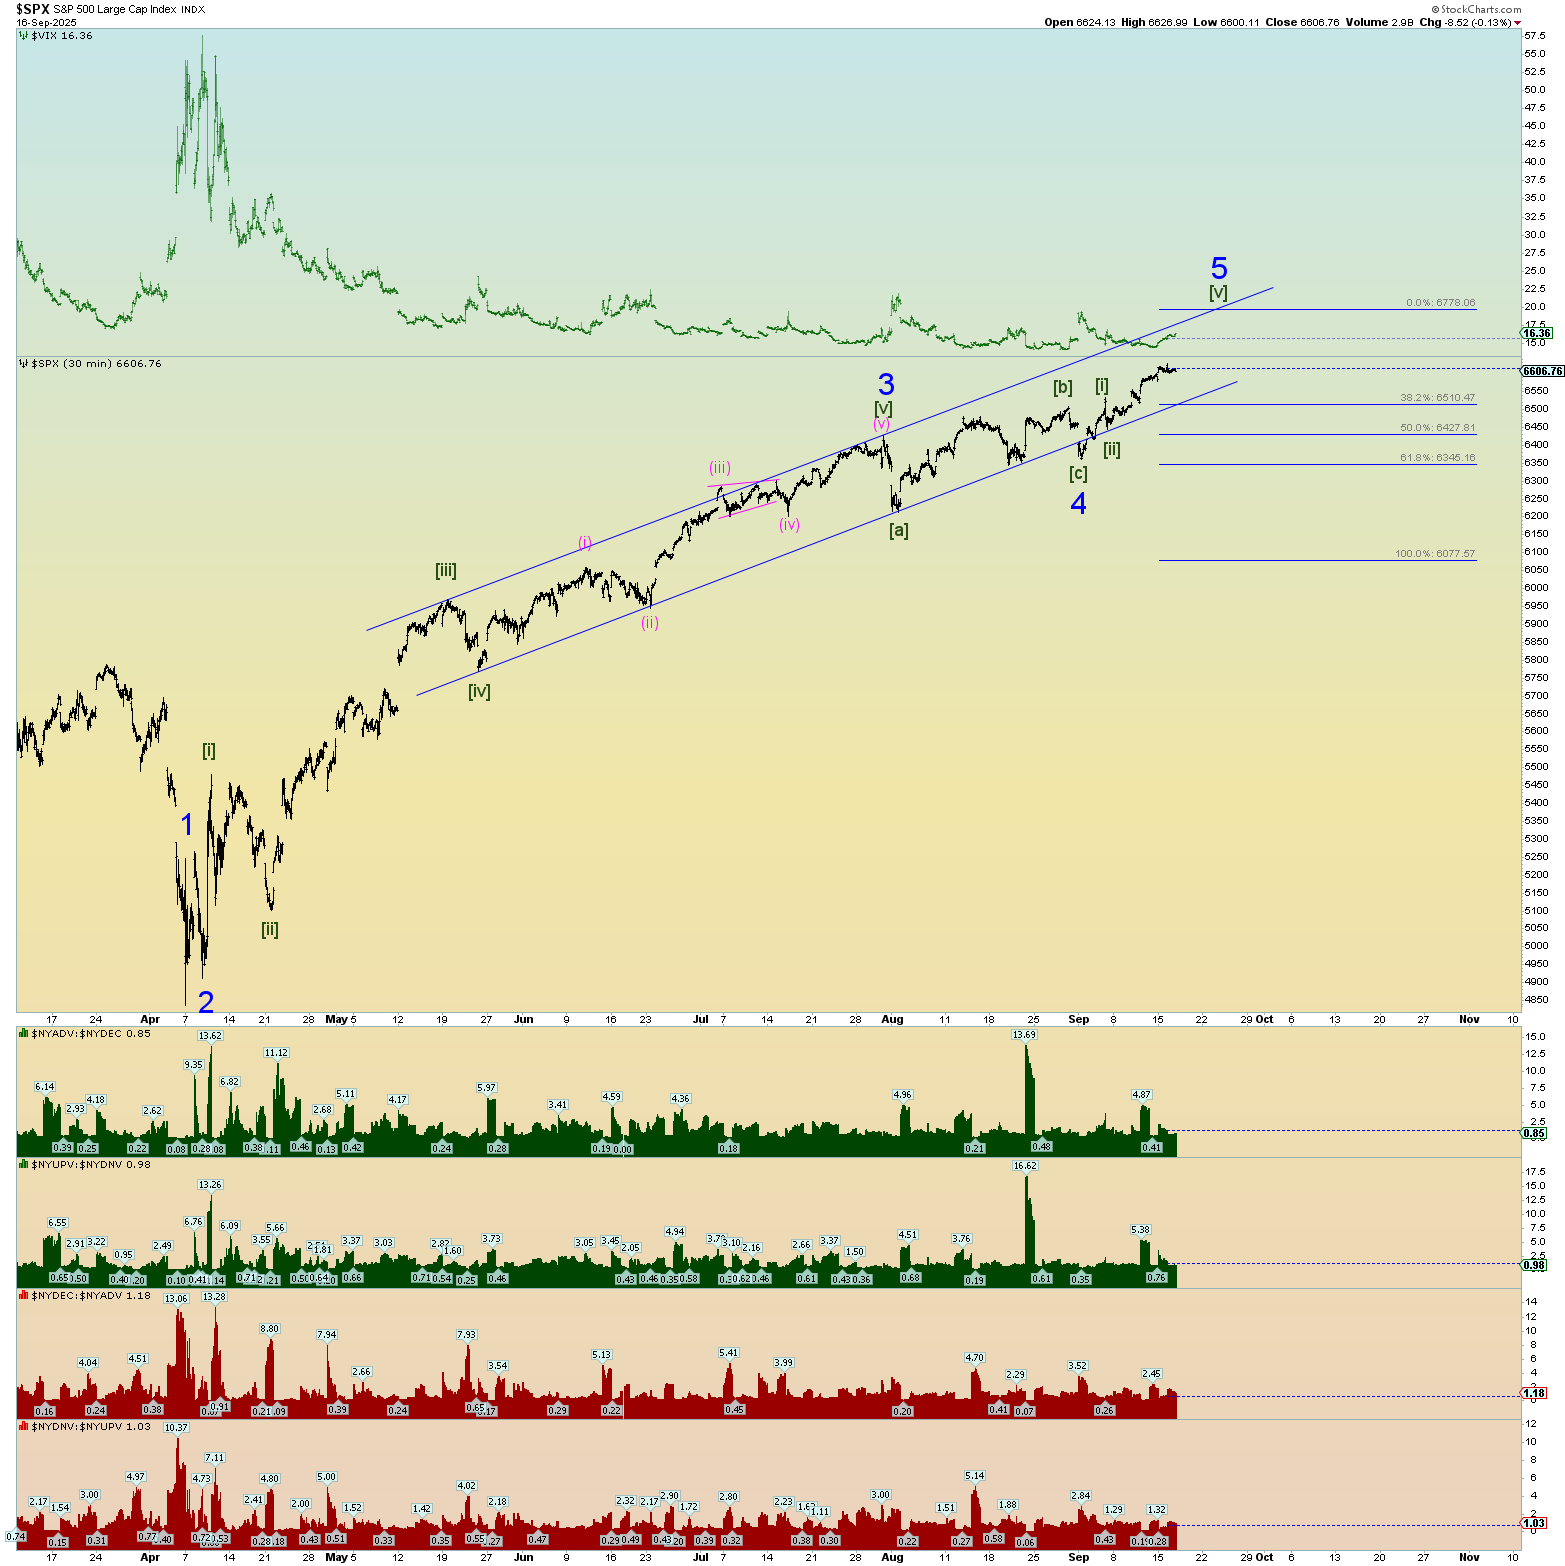
The following chart uses the Wilshire 5000, a better indicator of waves in my opinion, for the squiggle count since the April 2025 lows. Just looking at things objectively concerning the “best” count, the following chart is perhaps where the market stands as of today.
Please note the big “push” in later August to kickoff Minor wave 5. The channel has been obeyed. But objectively, the wave count points to yet another high coming.

And speaking of the Wilshire 5000, this of course is the index used in the “Buffett Indicator”. The Buffett Indicator: Market Cap to GDP – Updated Chart | LongtermTrends
Warren Buffett once warned that anything over 200% was a danger zone. We are in record territory.

So, Friday the S&P 500 gave lip service to “666” by finishing at 6664.36. Today, it’s corresponding ETF, the once very popular “SPY” finished today at 666.74. Additionally, the INDU finished at 46,381.54 which is within .0003% of a perfect Fibonacci sequence number of 46,368. Also, giving lip service to that number.
These are curious times. Symbolism is rampant it seems. Trump speaking tomorrow at the UN on the Jewish New Year, Rosh Hoshana. The 80th general assembly session of the founding of the United Nations, the very organization that “birthed” the founding of modern “Israel”.
The “Jews” that truly believe in their version of the “Messiah”, aka the Antichrist, believes this is the year it may be happening:
Statement About the U.N.’s Declaration of the Palestinian State
The NVIDIA announcement today of supporting Open AI to the tune of $100B is total bullshit. The “AI bubble” is no longer hiding, it’s in plain sight.
Nvida Stock Surges After Announcing $100 Billion OpenAI Investment | ZeroHedge
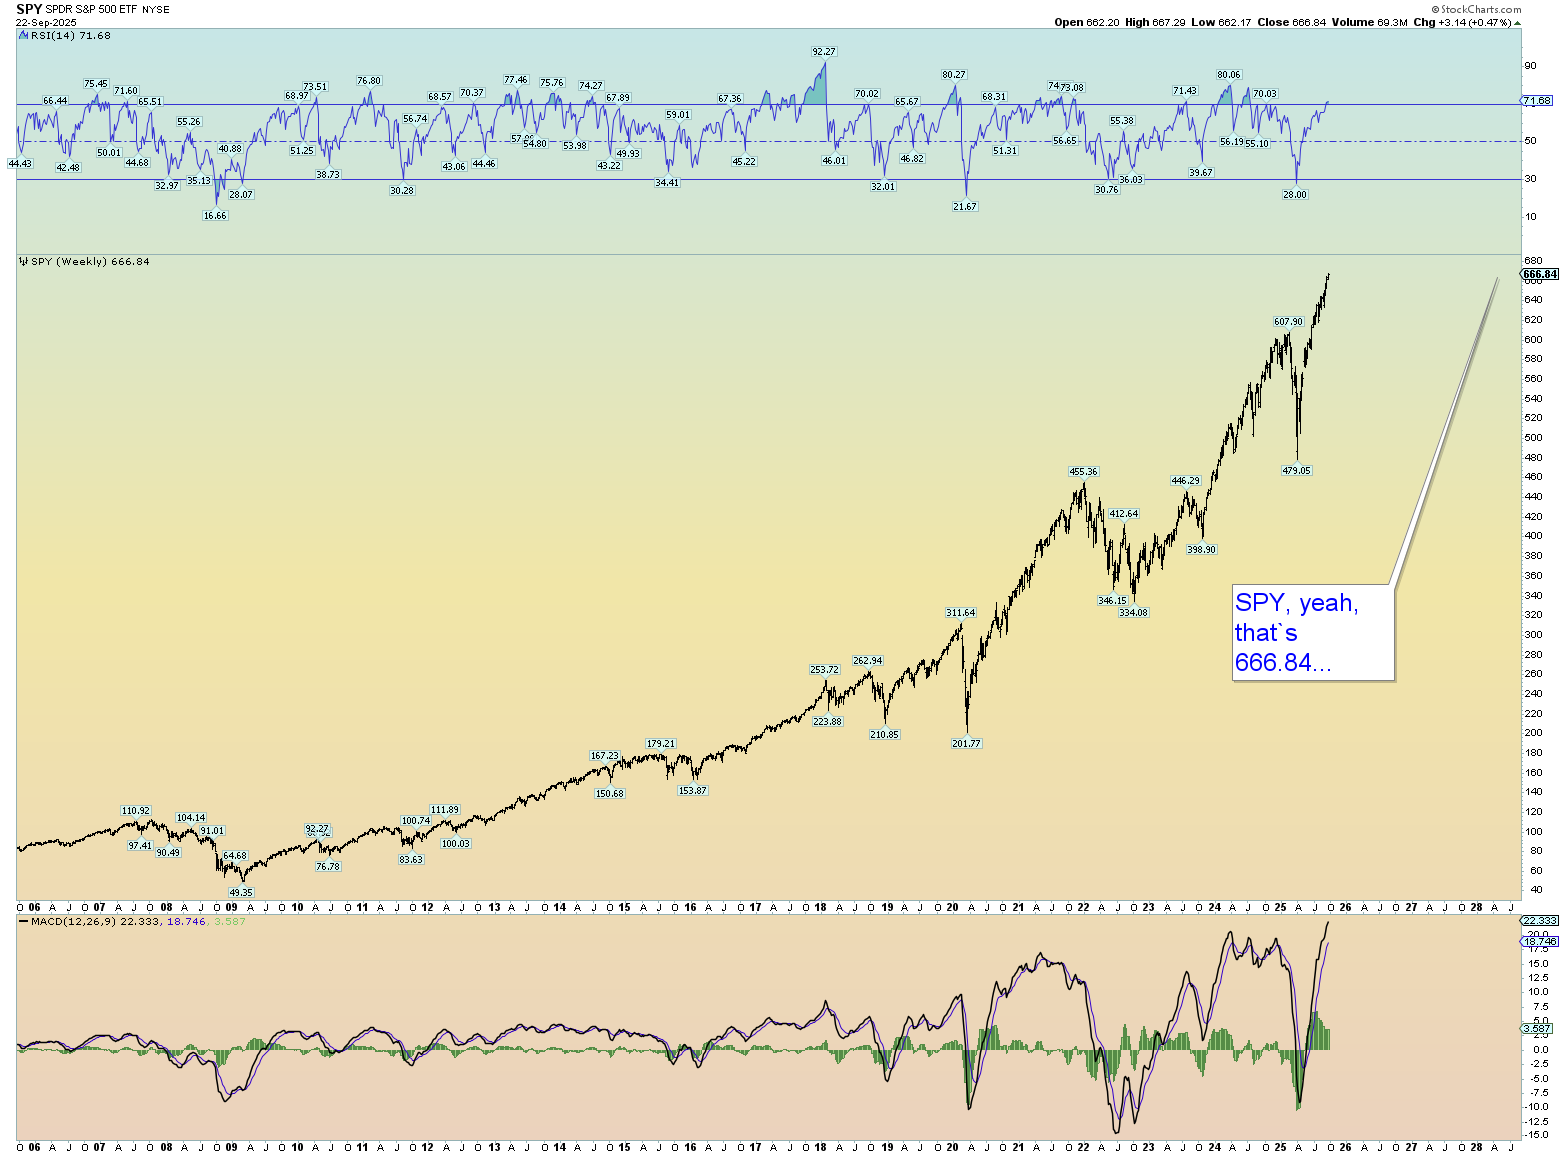
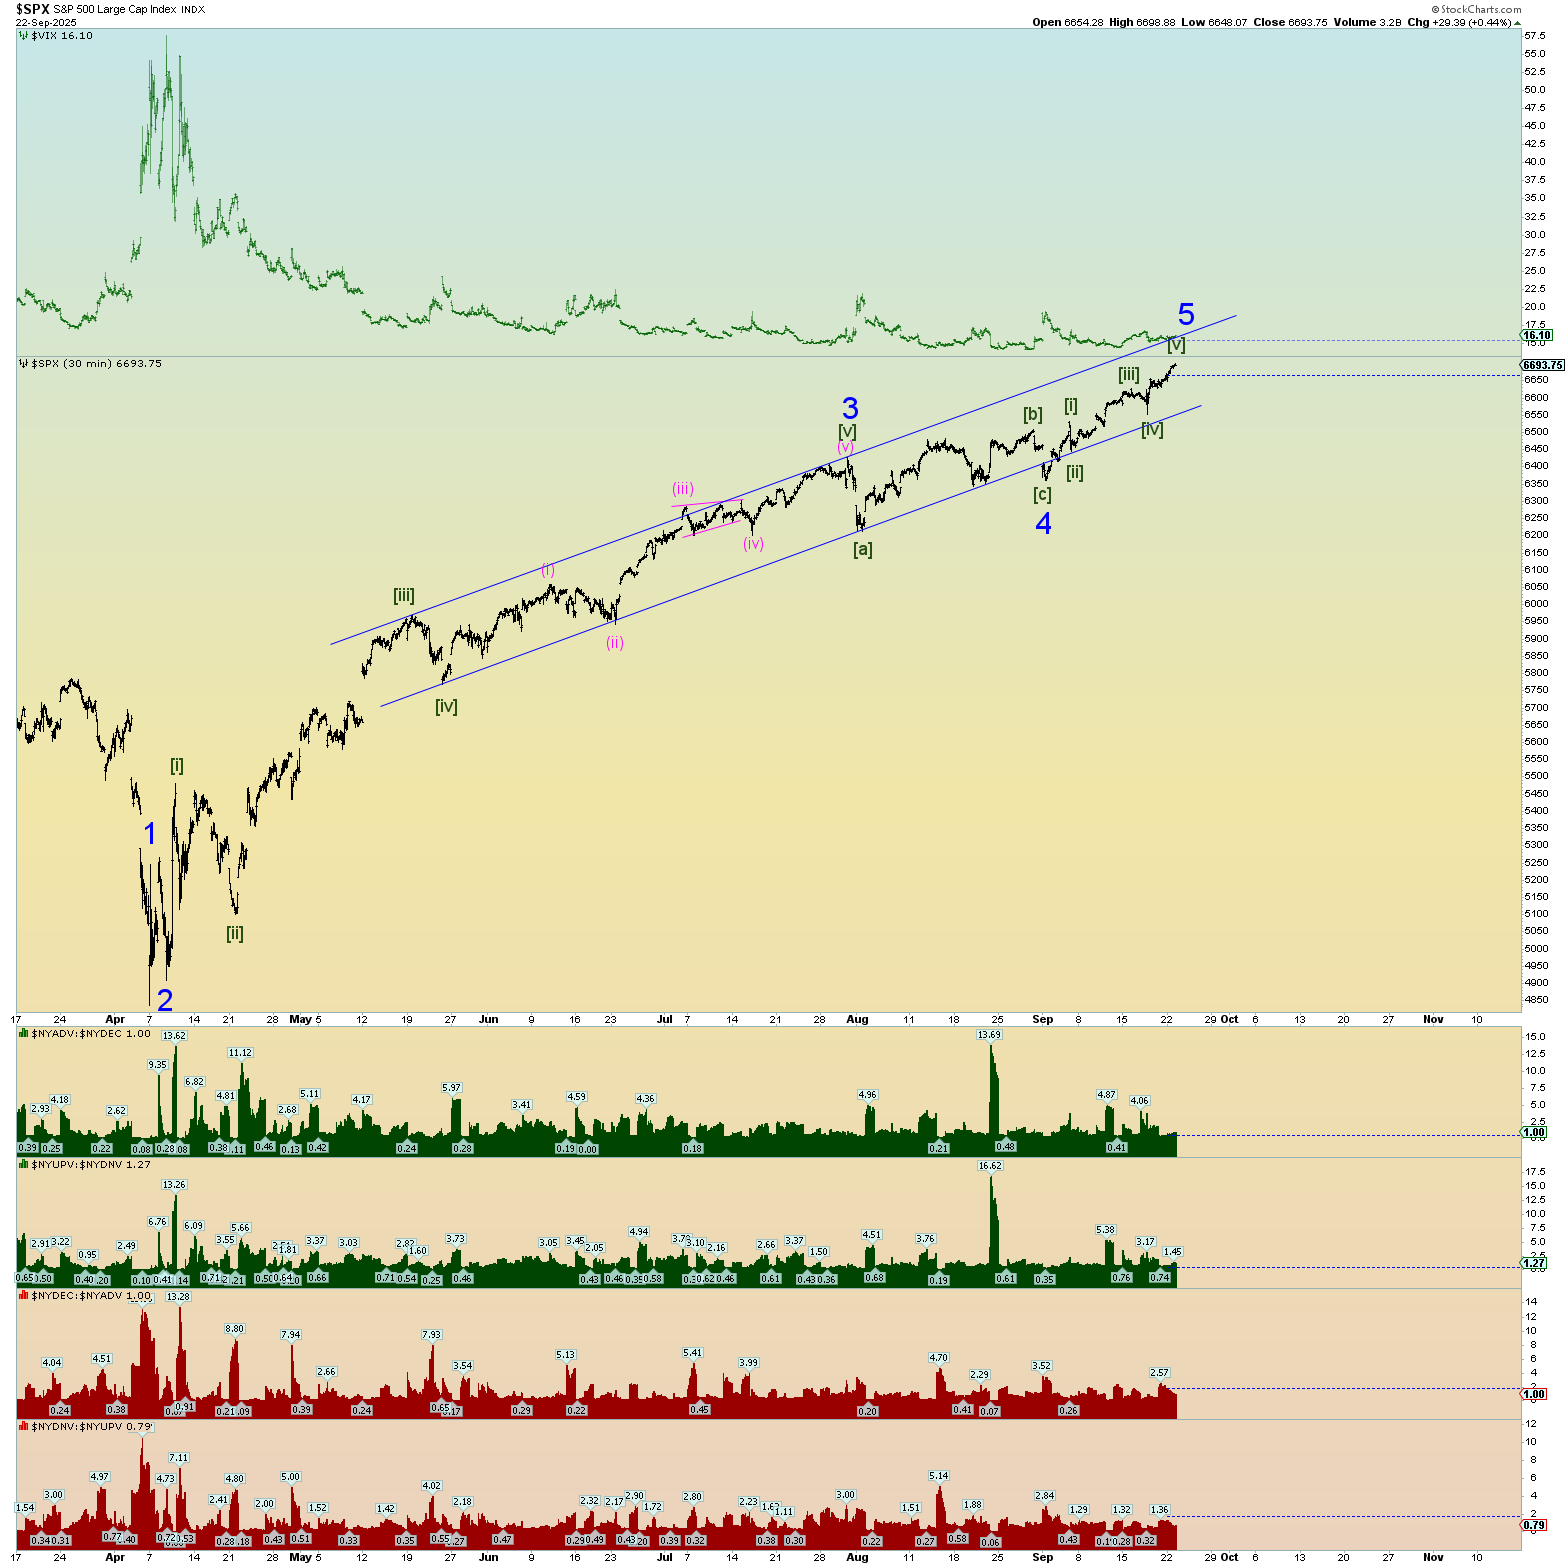
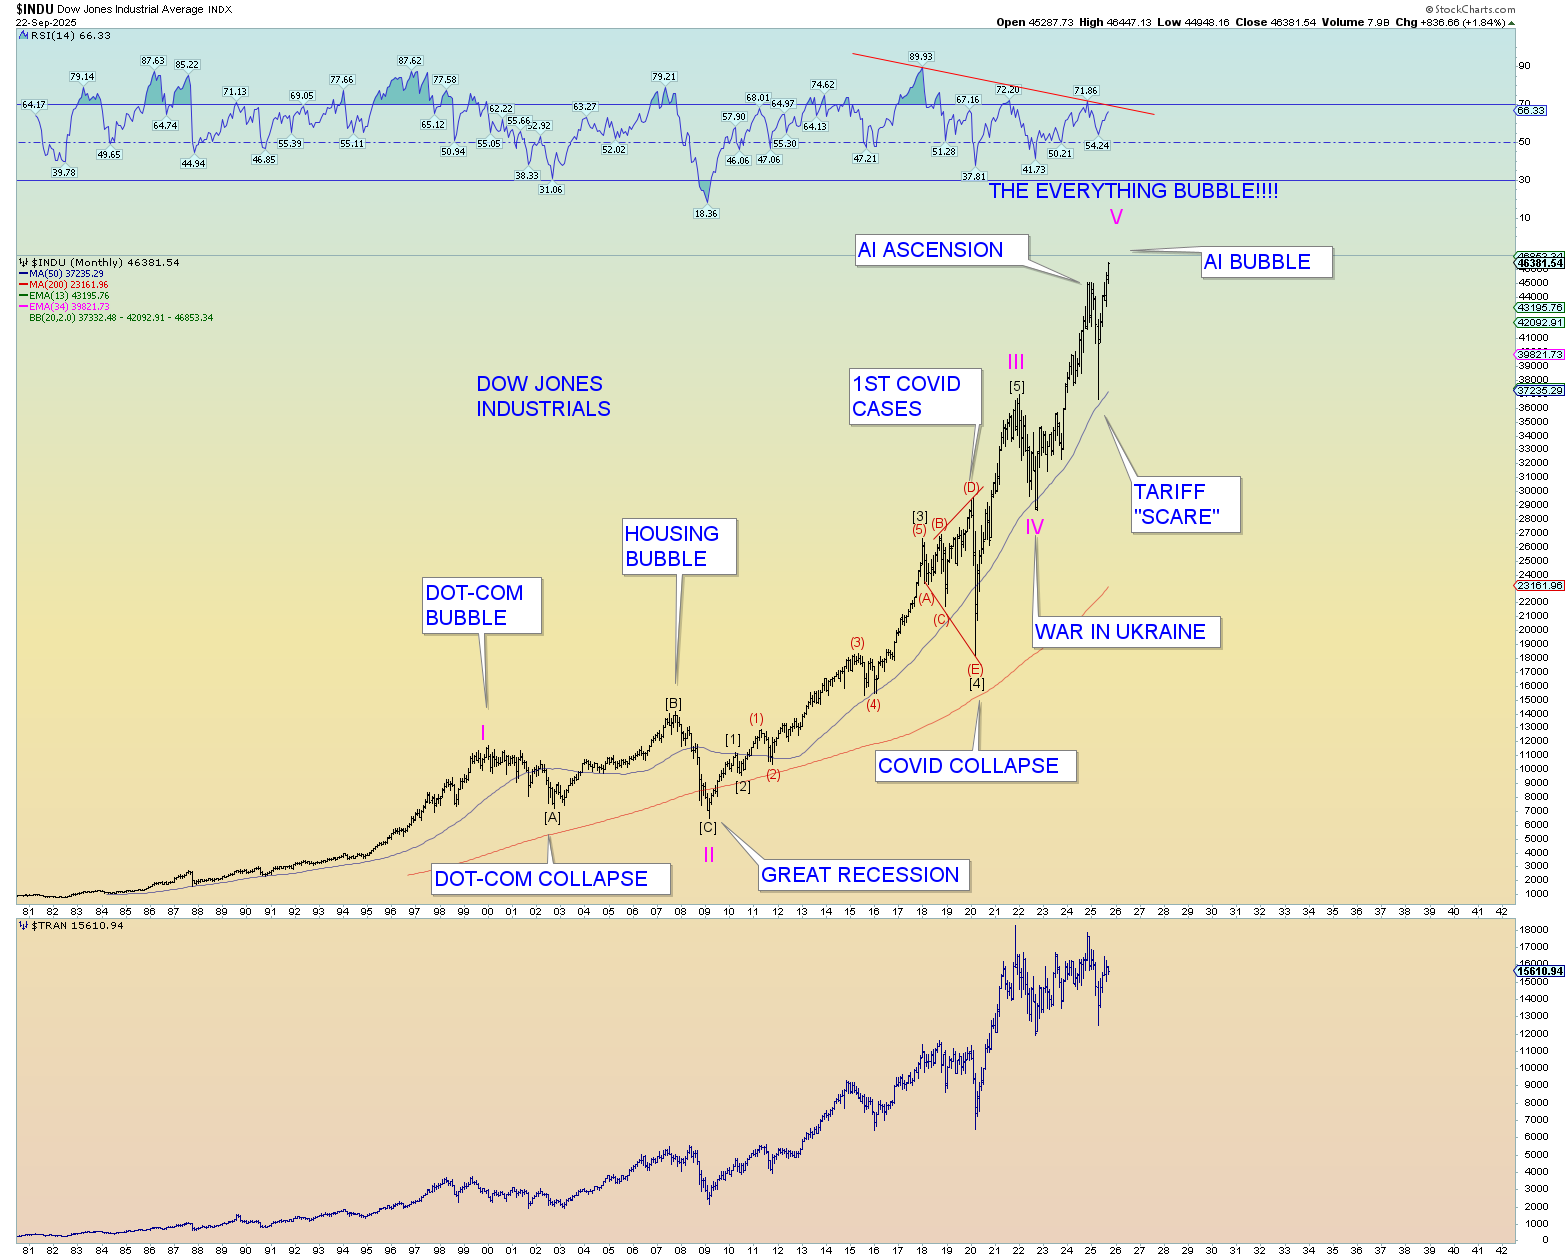
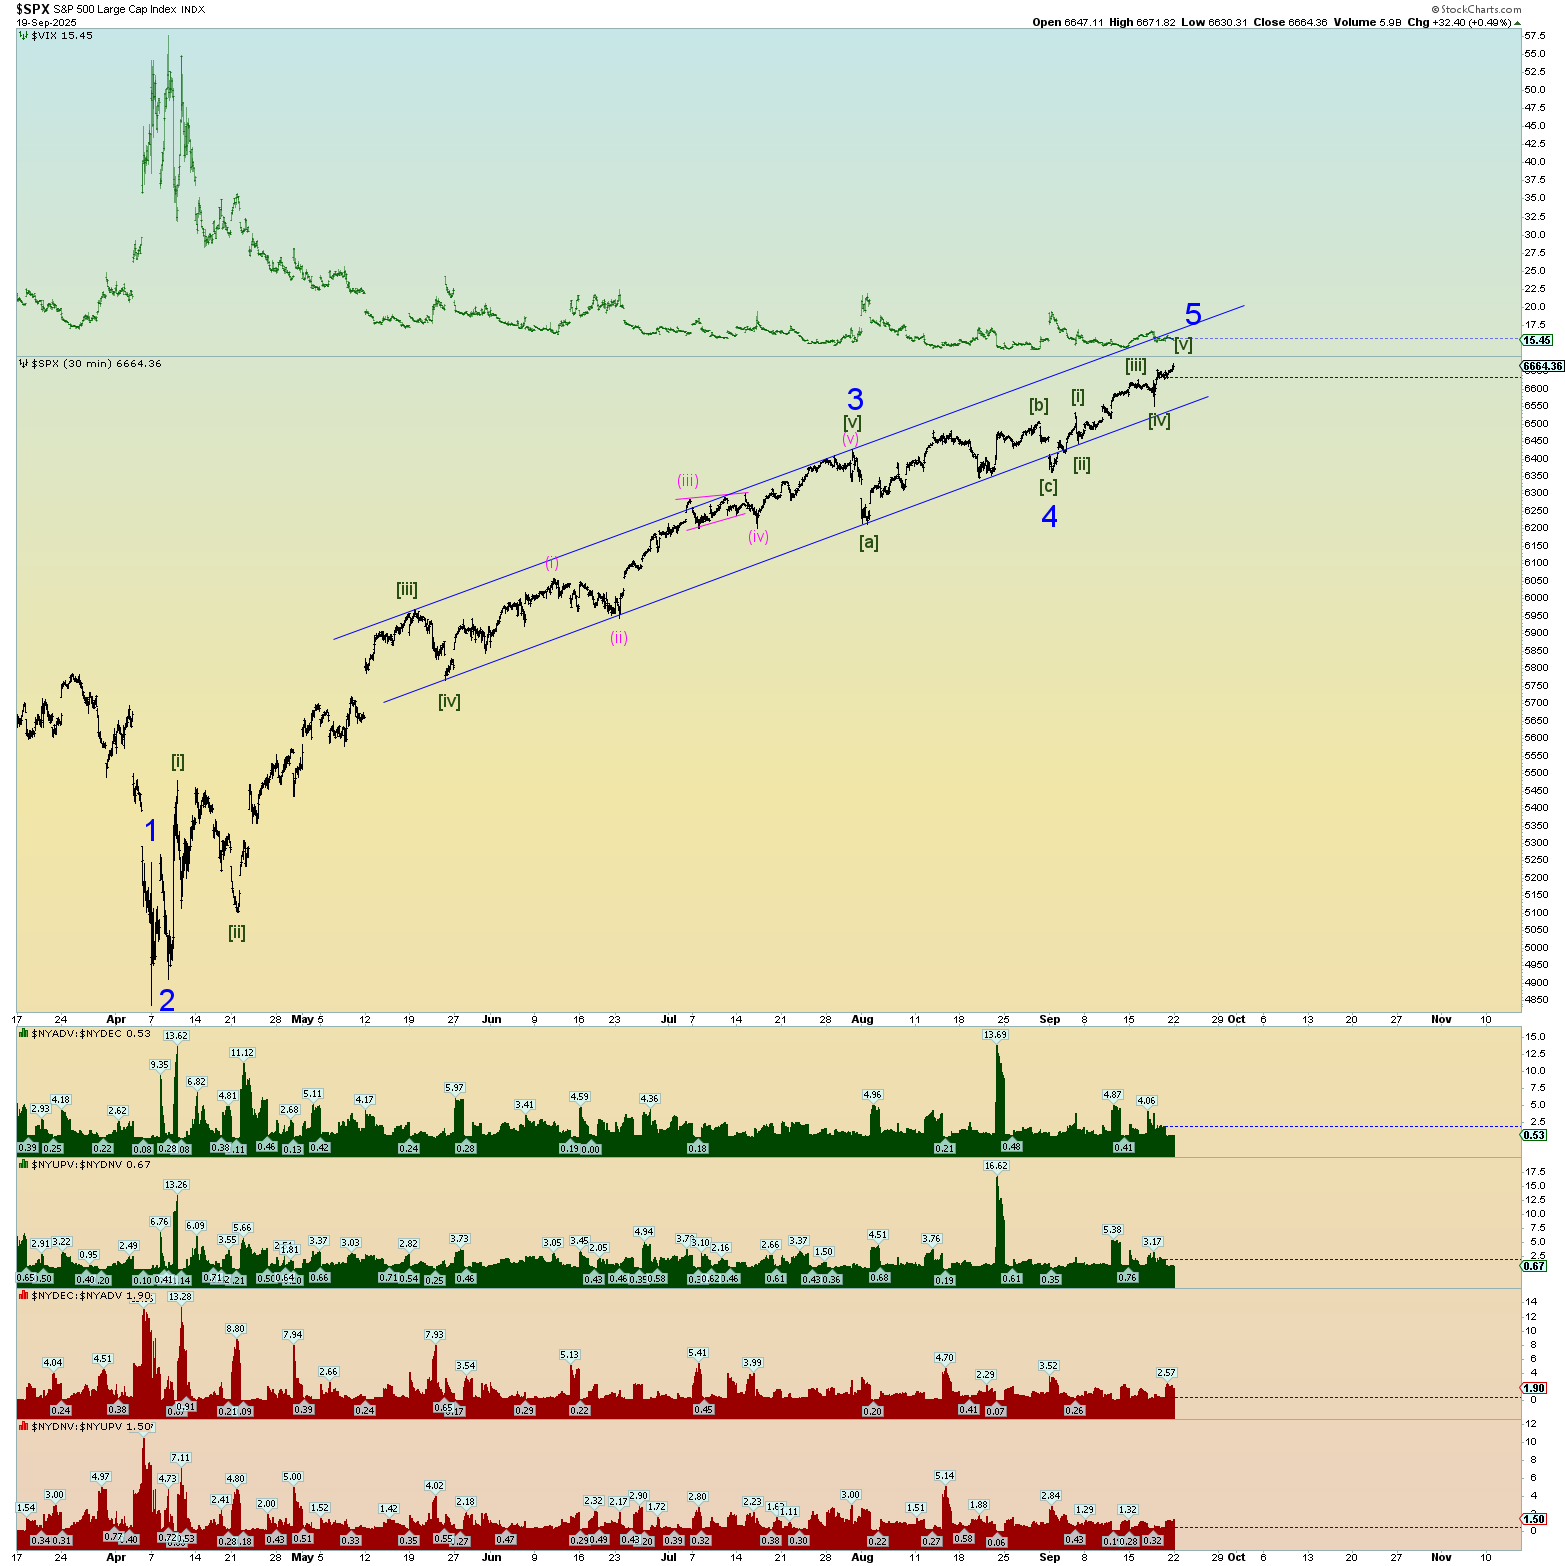
A day late, but finally both the DJIA (24th Fibonacci sequence #: 46,368 – intraday high of 46,396) and SPX (6666.66) hit the targets predicted on this blog back on 22 August, and on the same day which was also suggested. In fact, Friday’s close the SPX finished at 6664.36. Remember the 2010 intraday low was 666.79.
The squiggle count supports a top and certainly has enough waves to be considered complete.
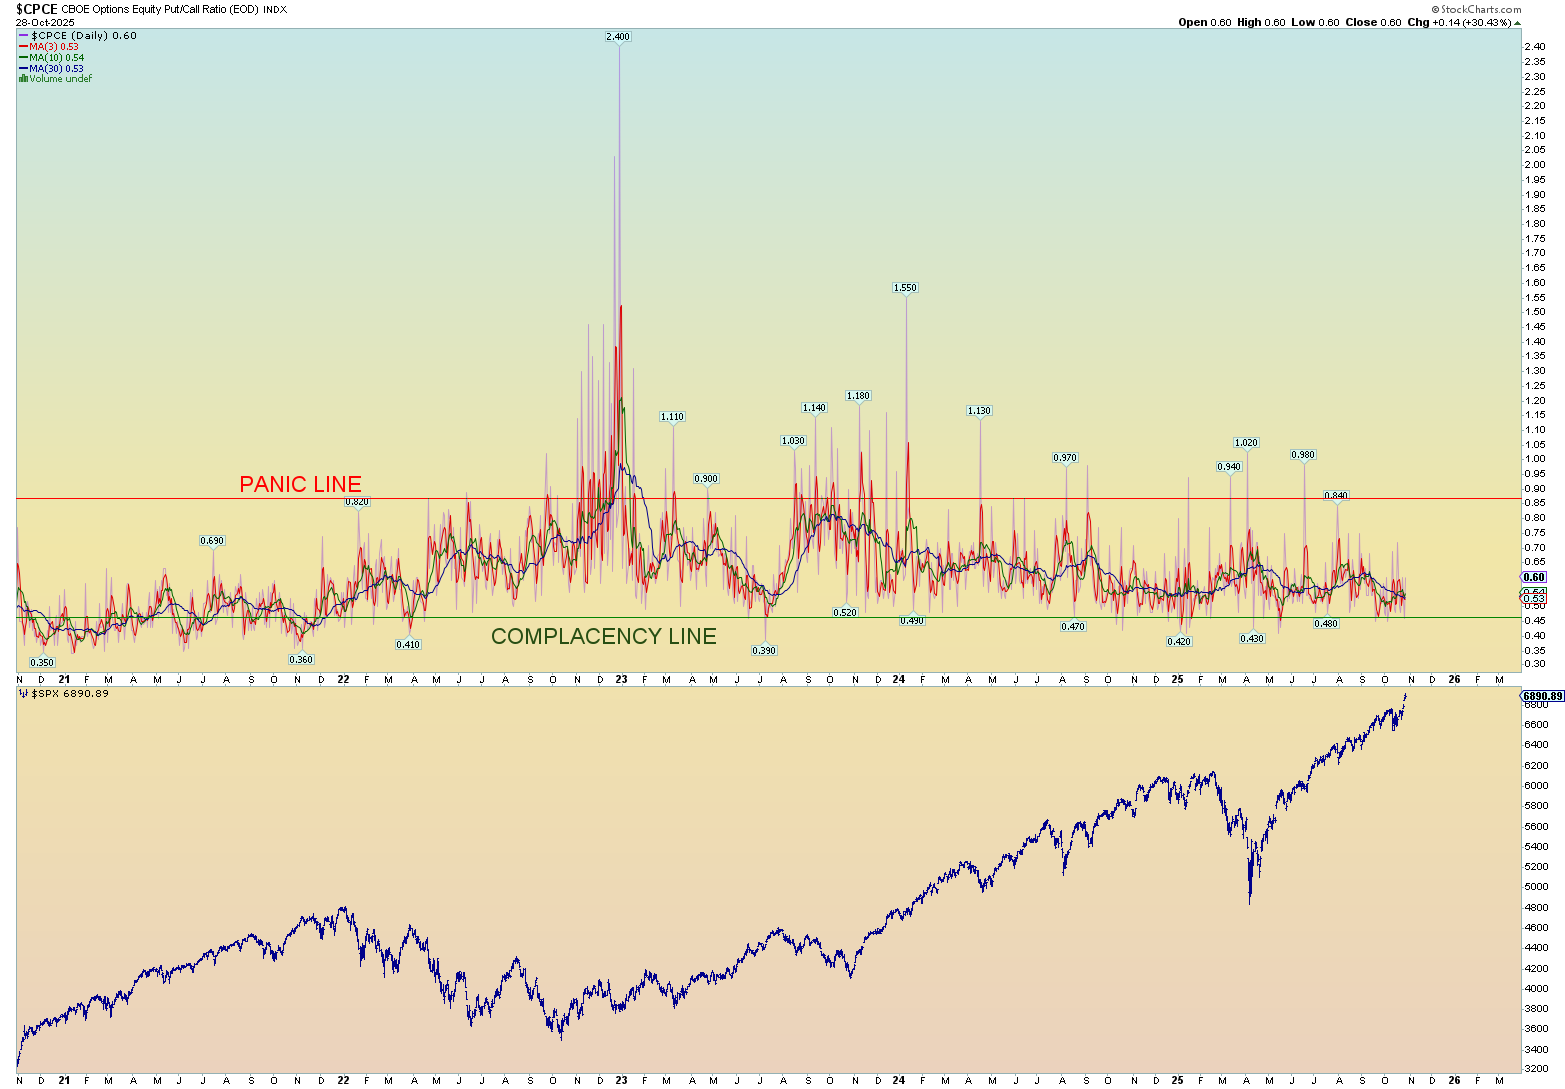
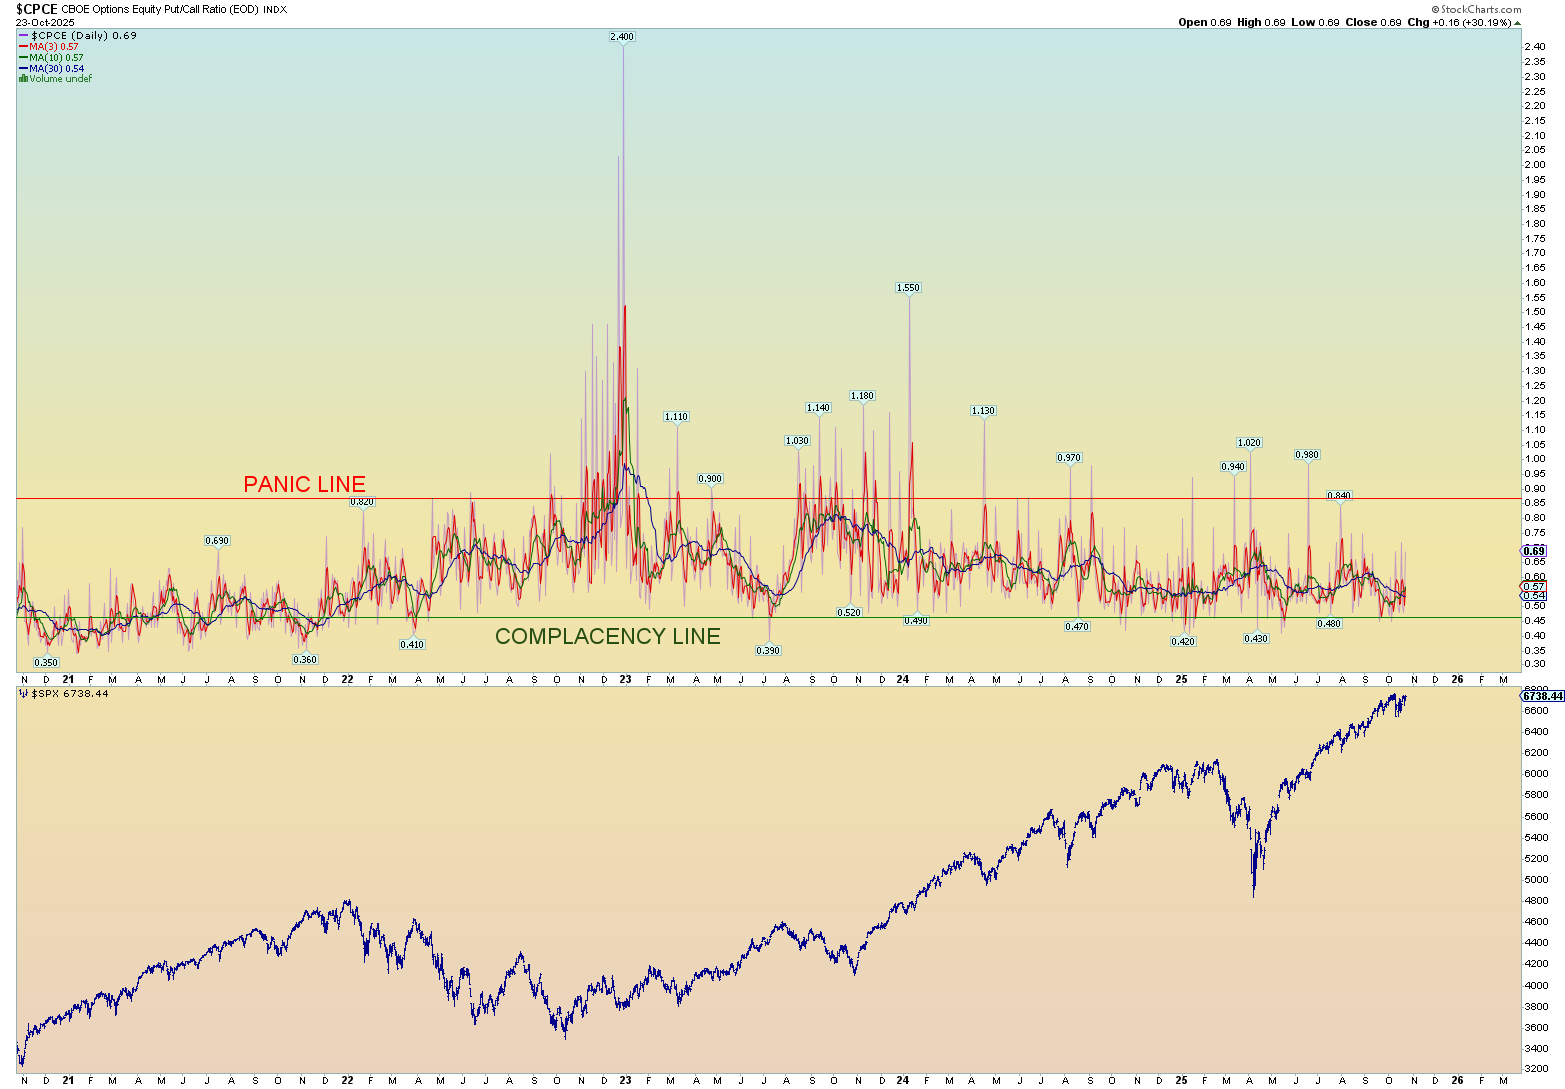
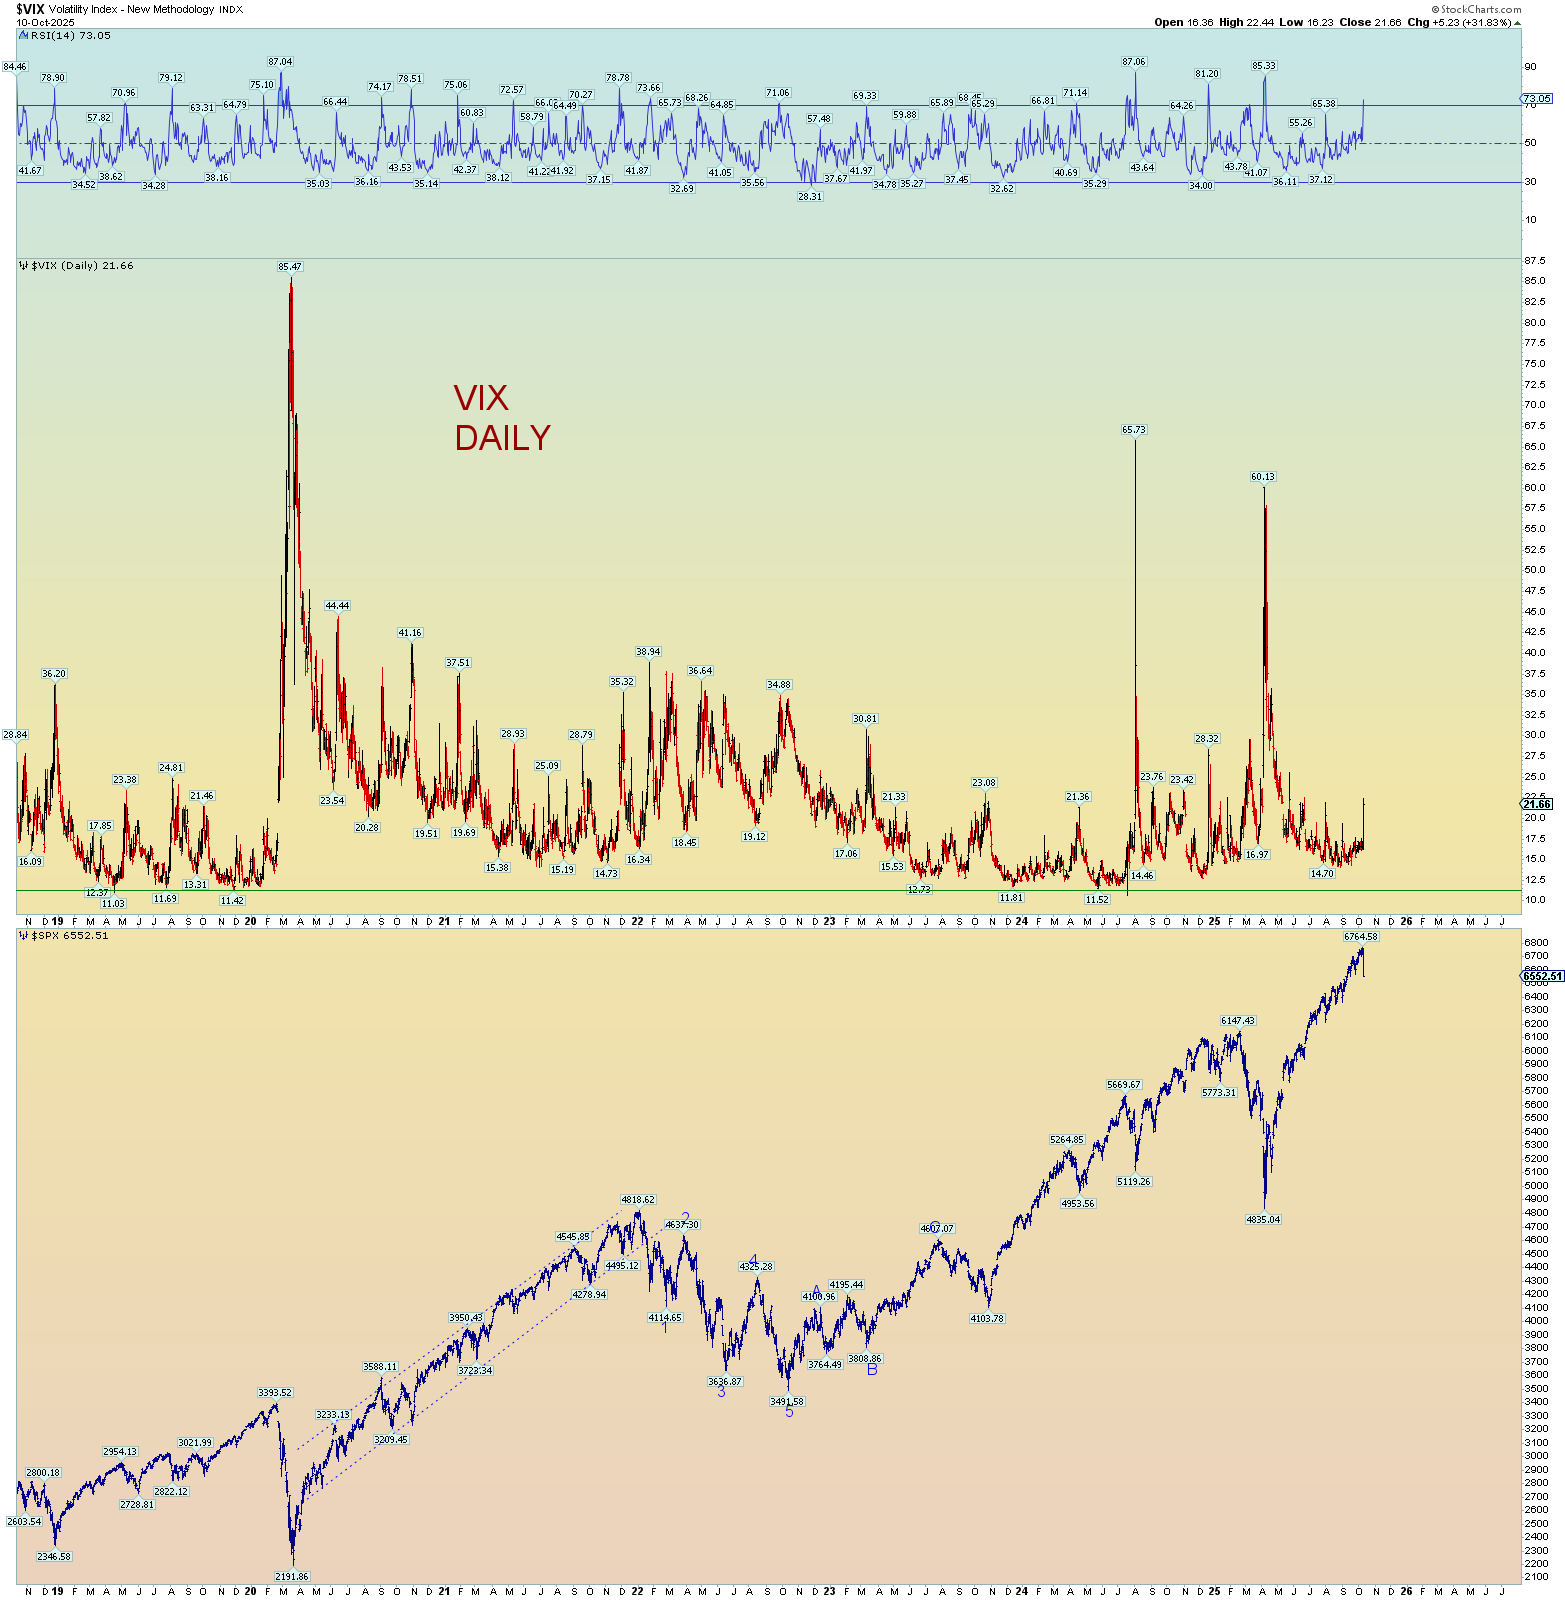
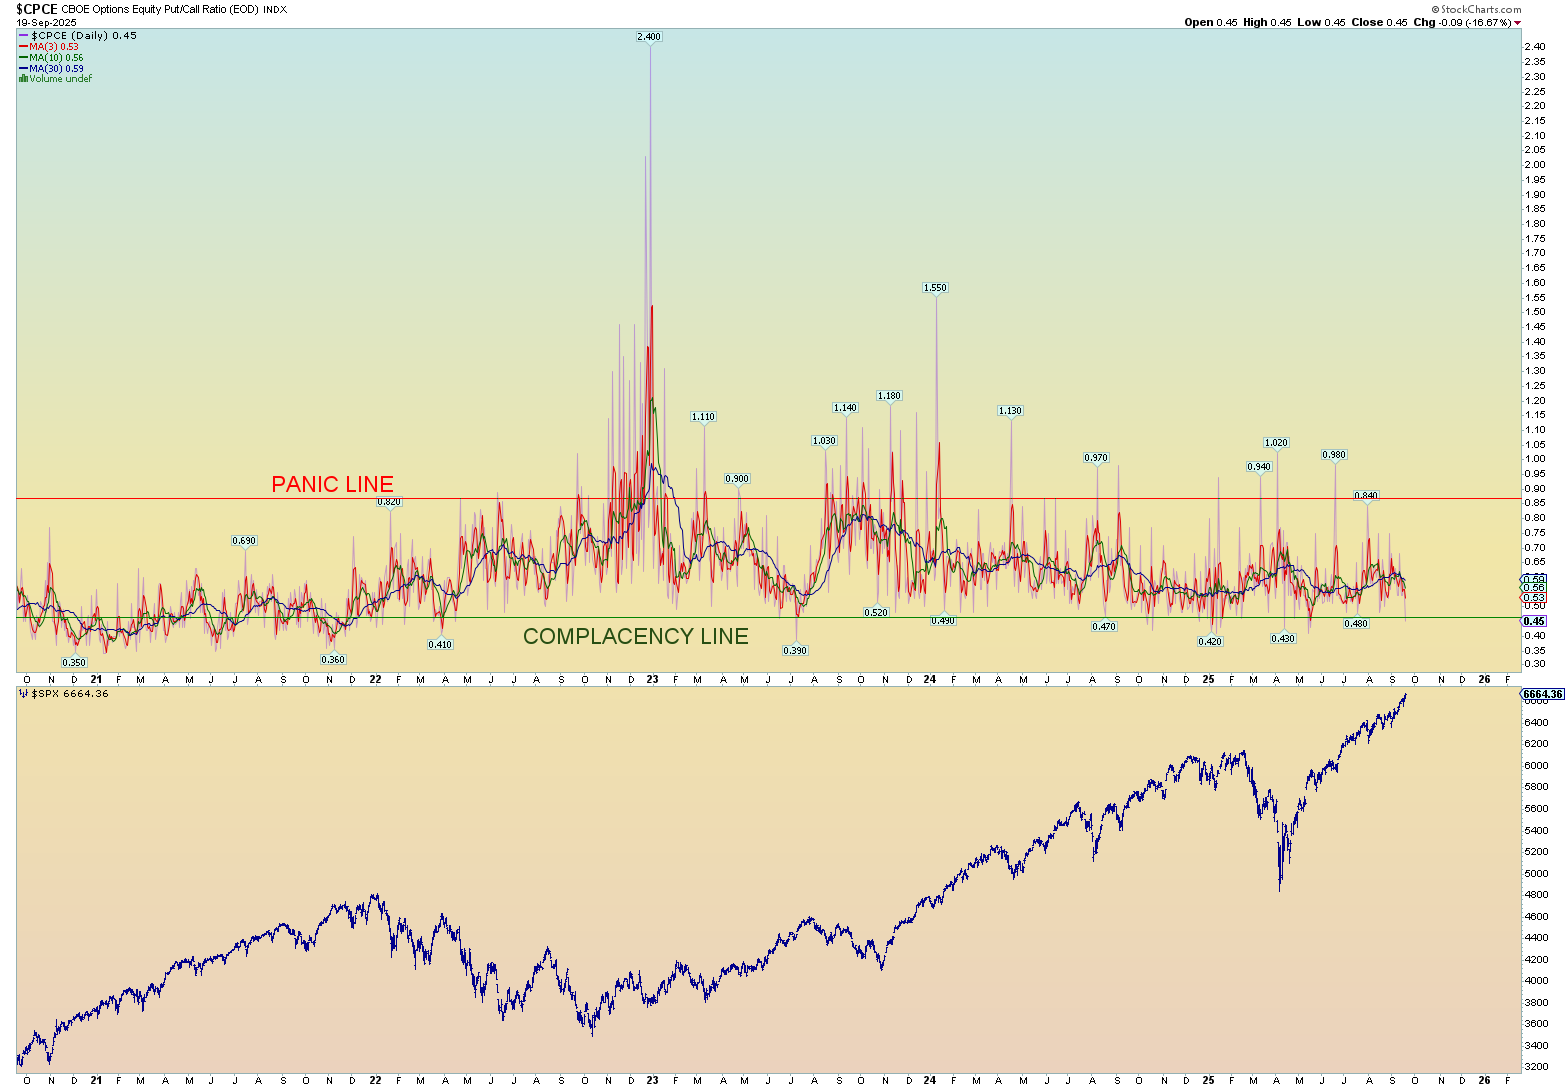
Some crazy low CPCE ratio number on Friday: .45 ratio. It’s been quite some time since the market has seen any real panic and that’s including the sharp decline of early 2025.
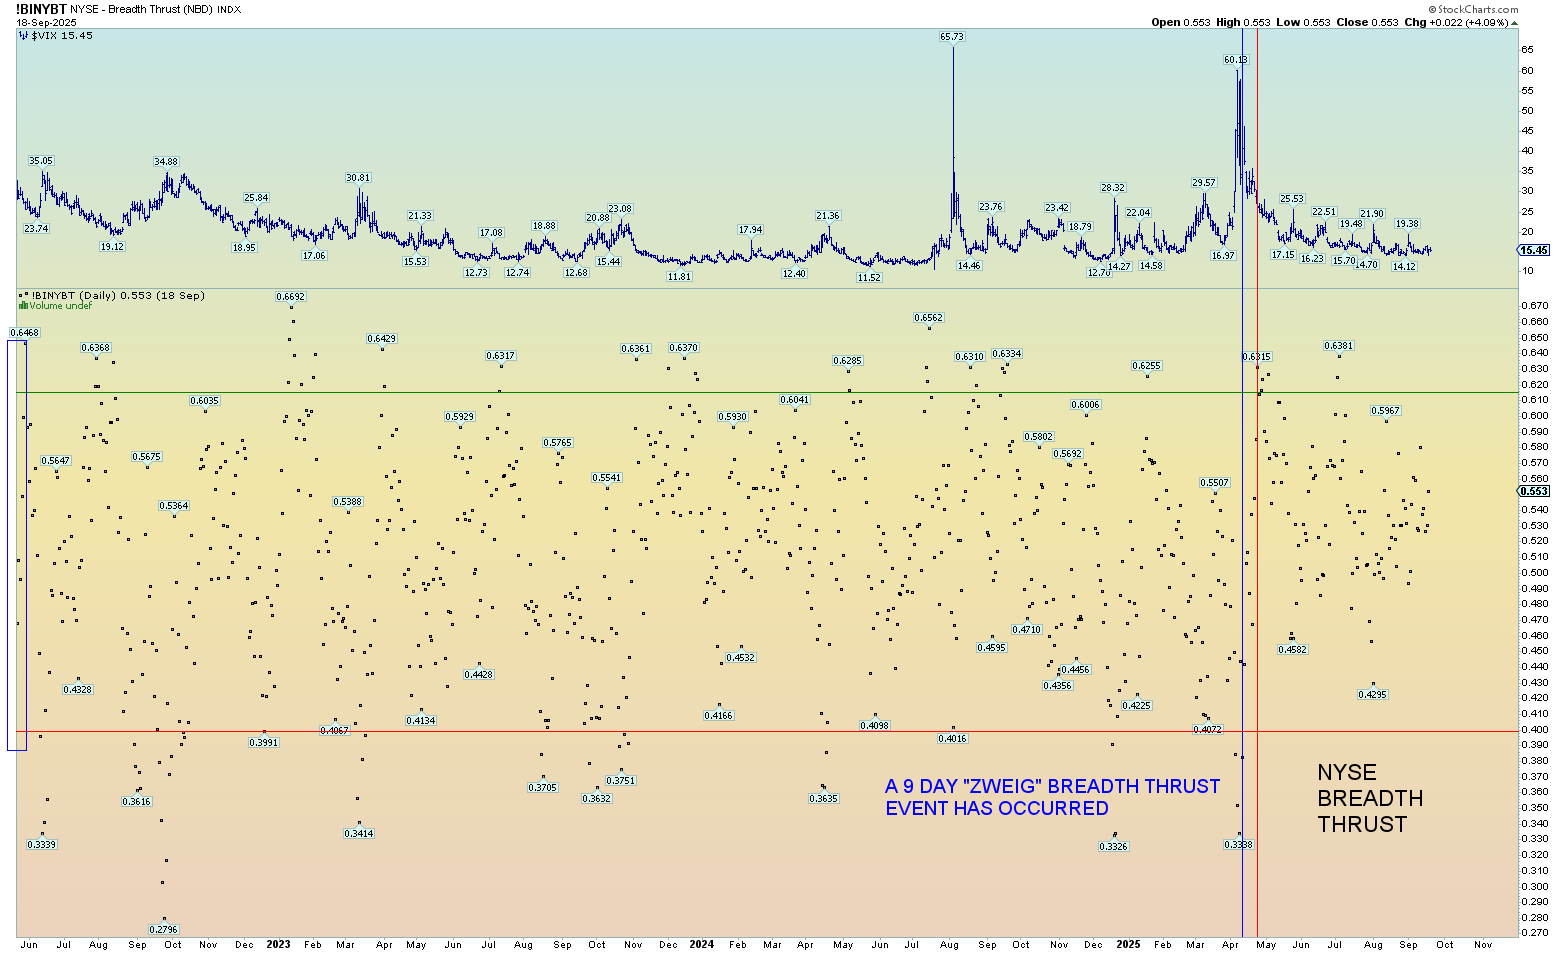
It’s also been a while since the NYSE experienced a “negative” event that resulted under .40 breadth (the bottom red horizontal line). So, the market is due for a panic event.
Gold has ripped higher out of what looks like a small consolidating contracting triangle. This also might indicate a final wave move.
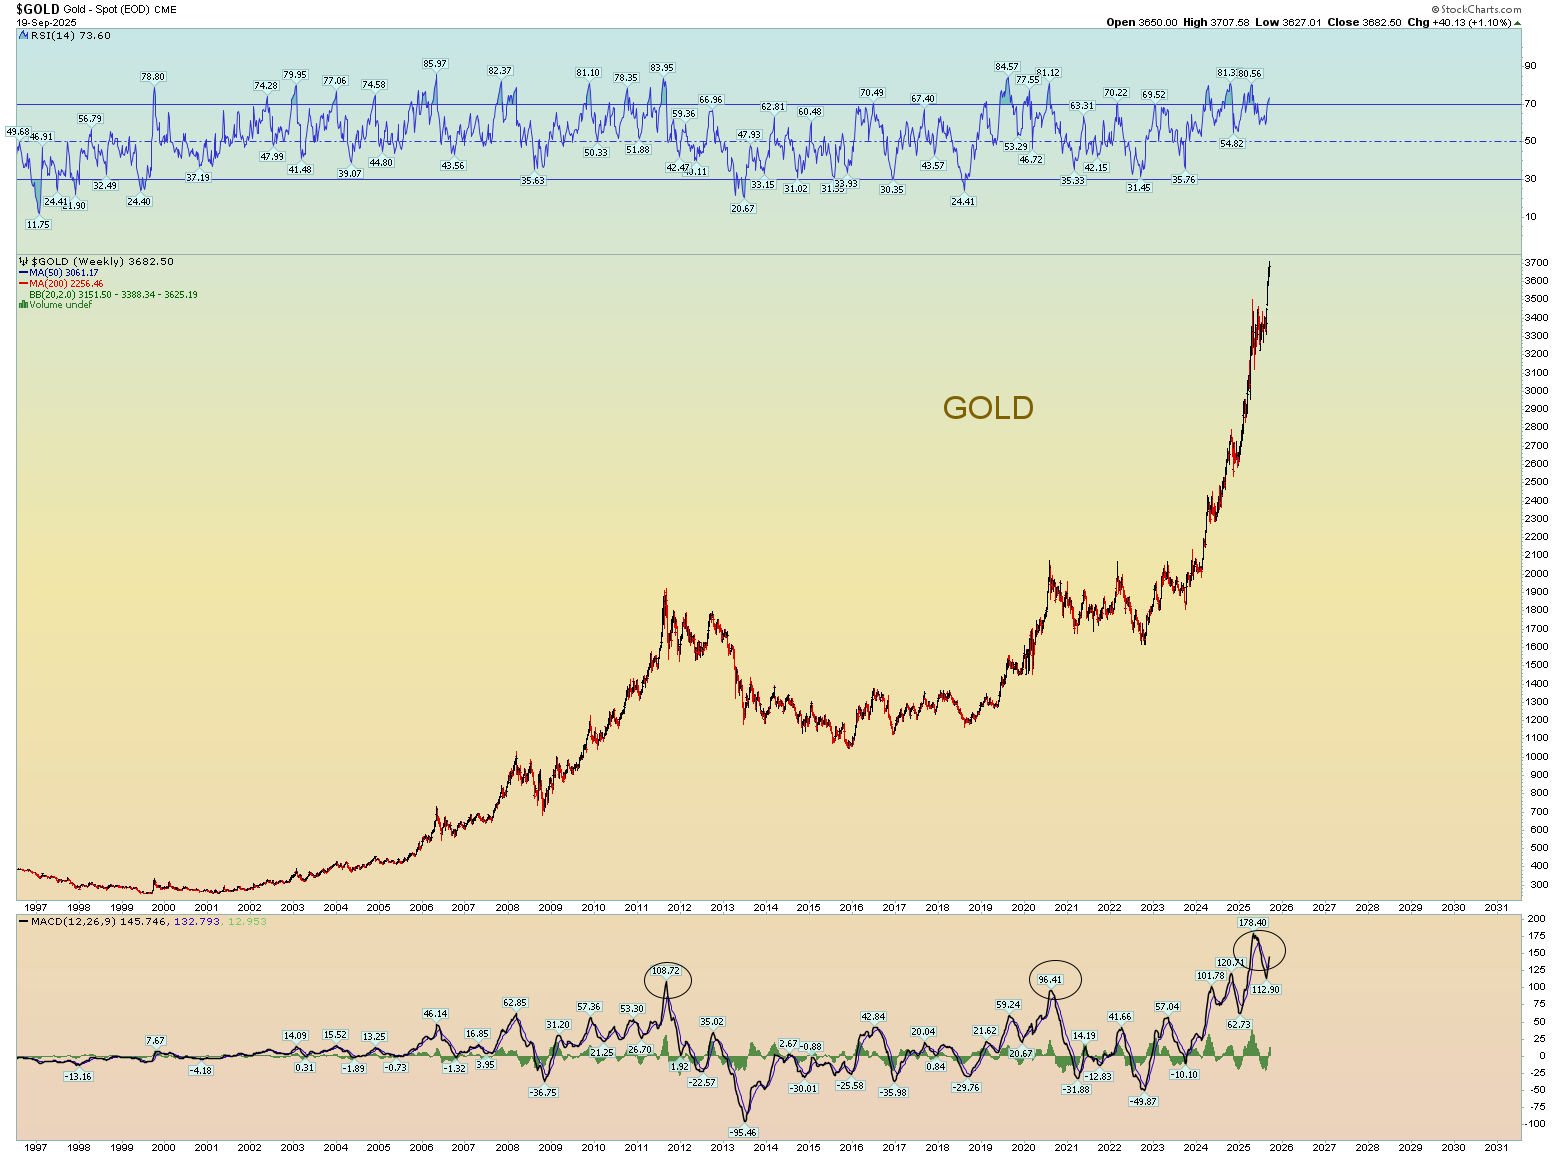
CONCLUSION AND SOCIAL MOOD COMMENTARY:
Charlie Kirk’s memorial event tomorrow is expected to attract over 100,00 people and will likely be celebrated all over the earth. I believe Charlie Kirk is a Christian martyr. I believe he is in heaven because he believed on Jesus Christ by faith alone and not of his own “works”. He seems to have believed in “once saved, always saved” (eternal security of the believer) which is in fact the heart of the gospel: that we will live forever once we have placed our faith in Christ in a moment of time.
In a sense, Charlie Kirk is actually the 1st saved Christian martyr being recognized worldwide. No, Martin Luther King was NOT a Christian. He didn’t even believe on Jesus’s resurrection, didn’t believe Jesus was born of the virgin Mary, didn’t believe he was even God. MLK was a child of the devil. MLK was a fraud by every measure.
Documentary Marxist Lucifer King full movie on MLK Martin Luther King Jr
And no, Billy Graham wasn’t saved and was also a false gospel prophet teaching we must “repent of our sins” (works) to be saved. And don’t get me started on any Catholics. Pope Paul II is burning in the lower depths of hell as is Mother Theresa. They didn’t trust on Jesus by faith; the Catholics teach that you must have “good works” also to go to heaven. They trust on themselves.
The stock market is Satan’s. He likes to communicate through symbolism such as the number 666. The fact that an actual saved Christian – who is more than likely saved and is now in heaven – is a most unlikely social mood marker to be a potential stock market “topping” event. But all things work together for good for those who love God.
If there was ever a time for Satan to pull the plug on the global financial system, this seems the perfect spot to do so. 666 at the bottom. 666 at the top. All waves seemingly in place. Late September, a typical place of social mood oncoming winter downturn. The “AI bubble” gargantuan in nature and being exposed daily that it is also a fraud.
Well, the market performed a triple intraday all-time high today, and no one seems to really make note of it anymore. Its “old news” because it’s like a regular event nowadays it seems. There is no blaring headline on Marketwatch or Drudge screaming “STOCKS ALL ROAR TO ALL-TIME HIGHS YET AGAIN”. Nope, didn’t happen, but then again most major news outlets are hard left wing and don’t want to “give credit” to Trump for the stock market’s performance. So, it has become a curious social mood thing to observe from my perspective.
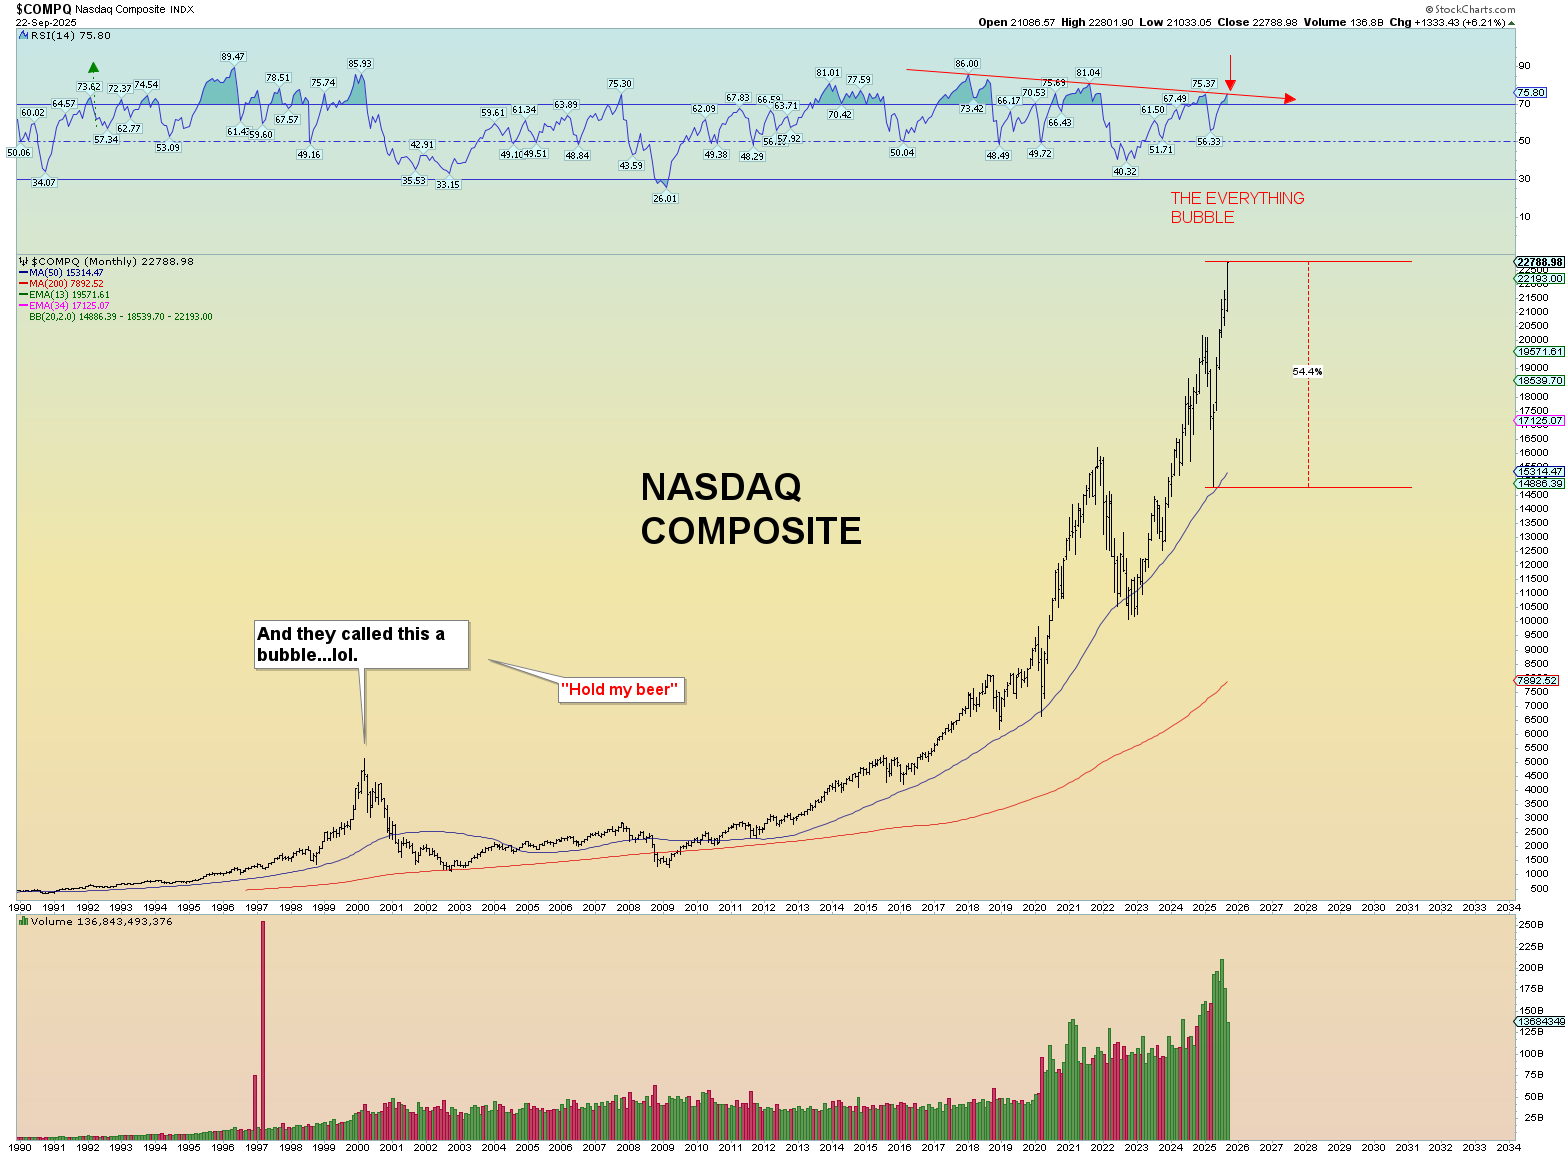
Yet the mania spurs on. The DJIA high today was 46,317, merely points shy of the 24th Fibonacci sequence number of 43,368. The SPX intraday high was 6656.80 which is just shy also of 6666.66. “Mark of the Beast” so to speak. And the NASDAQ Composite was 22,540.93 which I am not aware of any significant number, but it is quite impressive considering the 2010 low was 1265.52 resulting in an almost an 18X multiple of its low of 2010 versus the SPX a 10X multiple. The DOW’s low a 6469.95 in 2010 has exploded by a factor of 7.5 or so.
DOW is 7.5 x price of 2010 low.
SPX is 10x price of 2010 low.
NASDAQ COMP is 18x price of 2010 low.
So yes, we are in yet another tech bubble, this one being led by “AI”. When will it pop? I give my best squiggle count below>


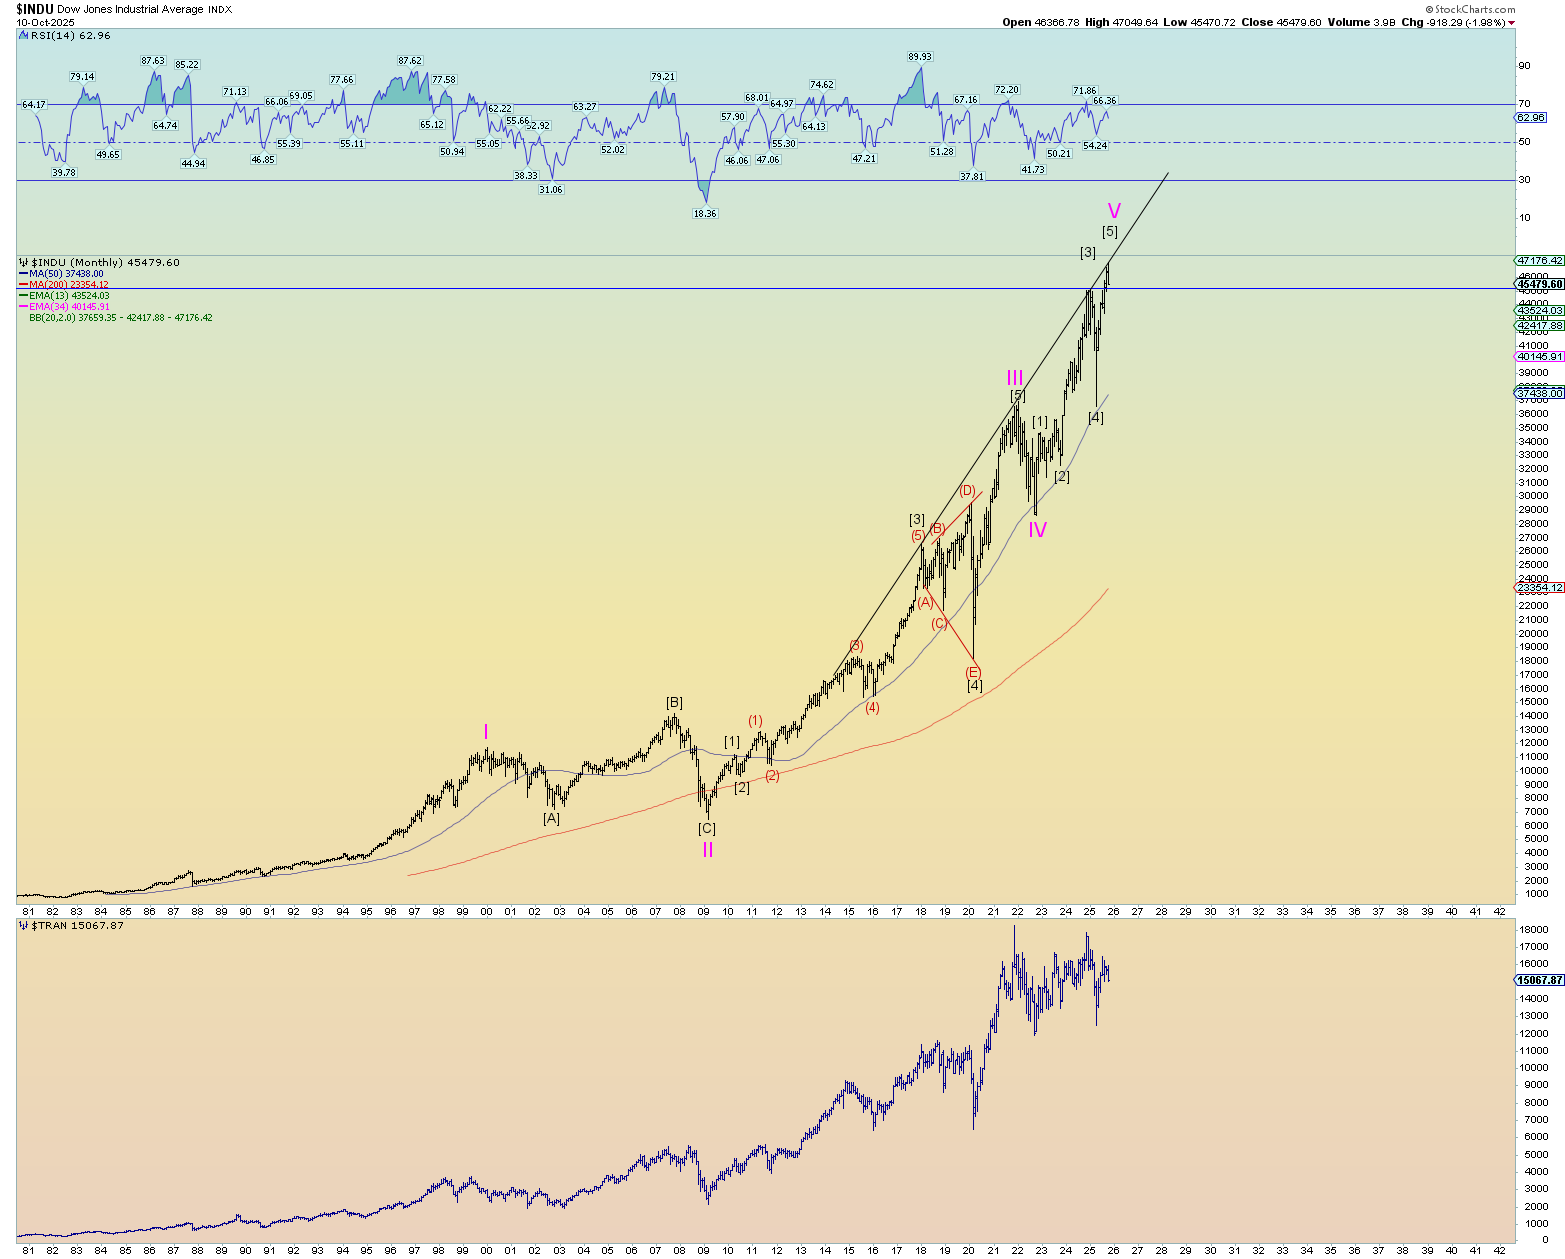
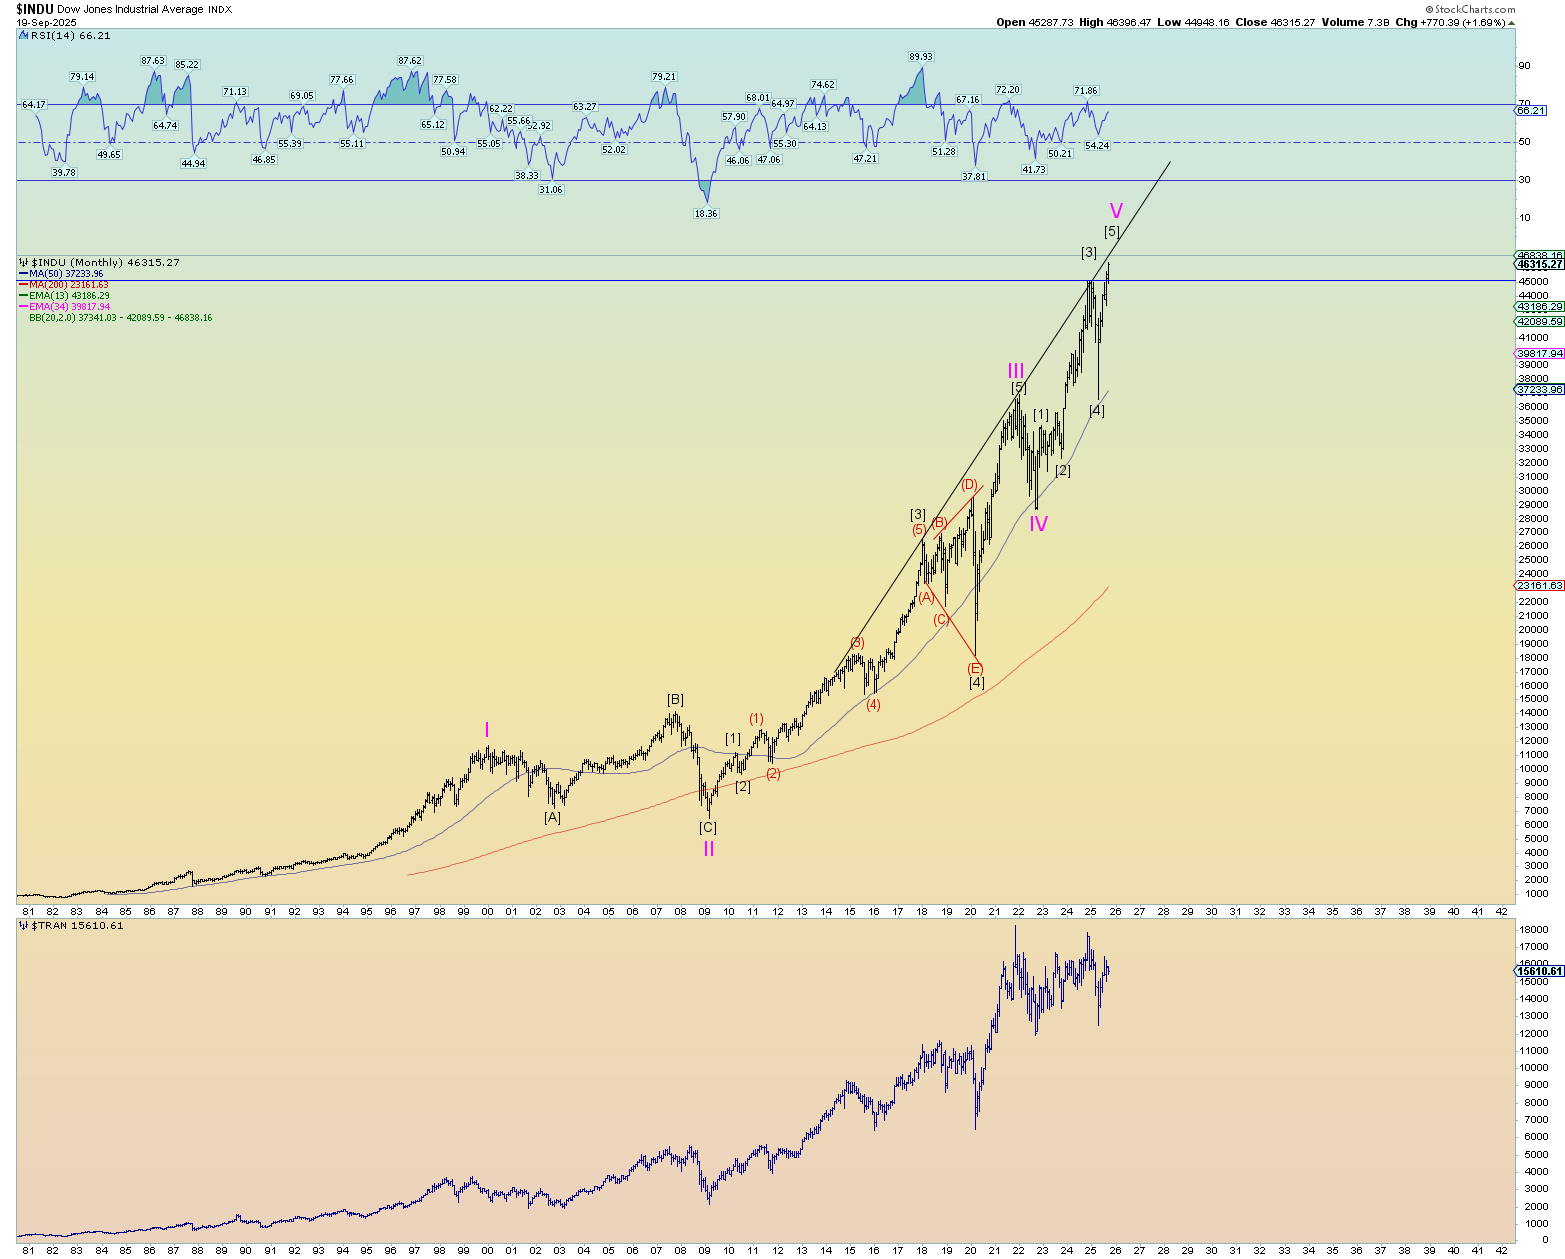
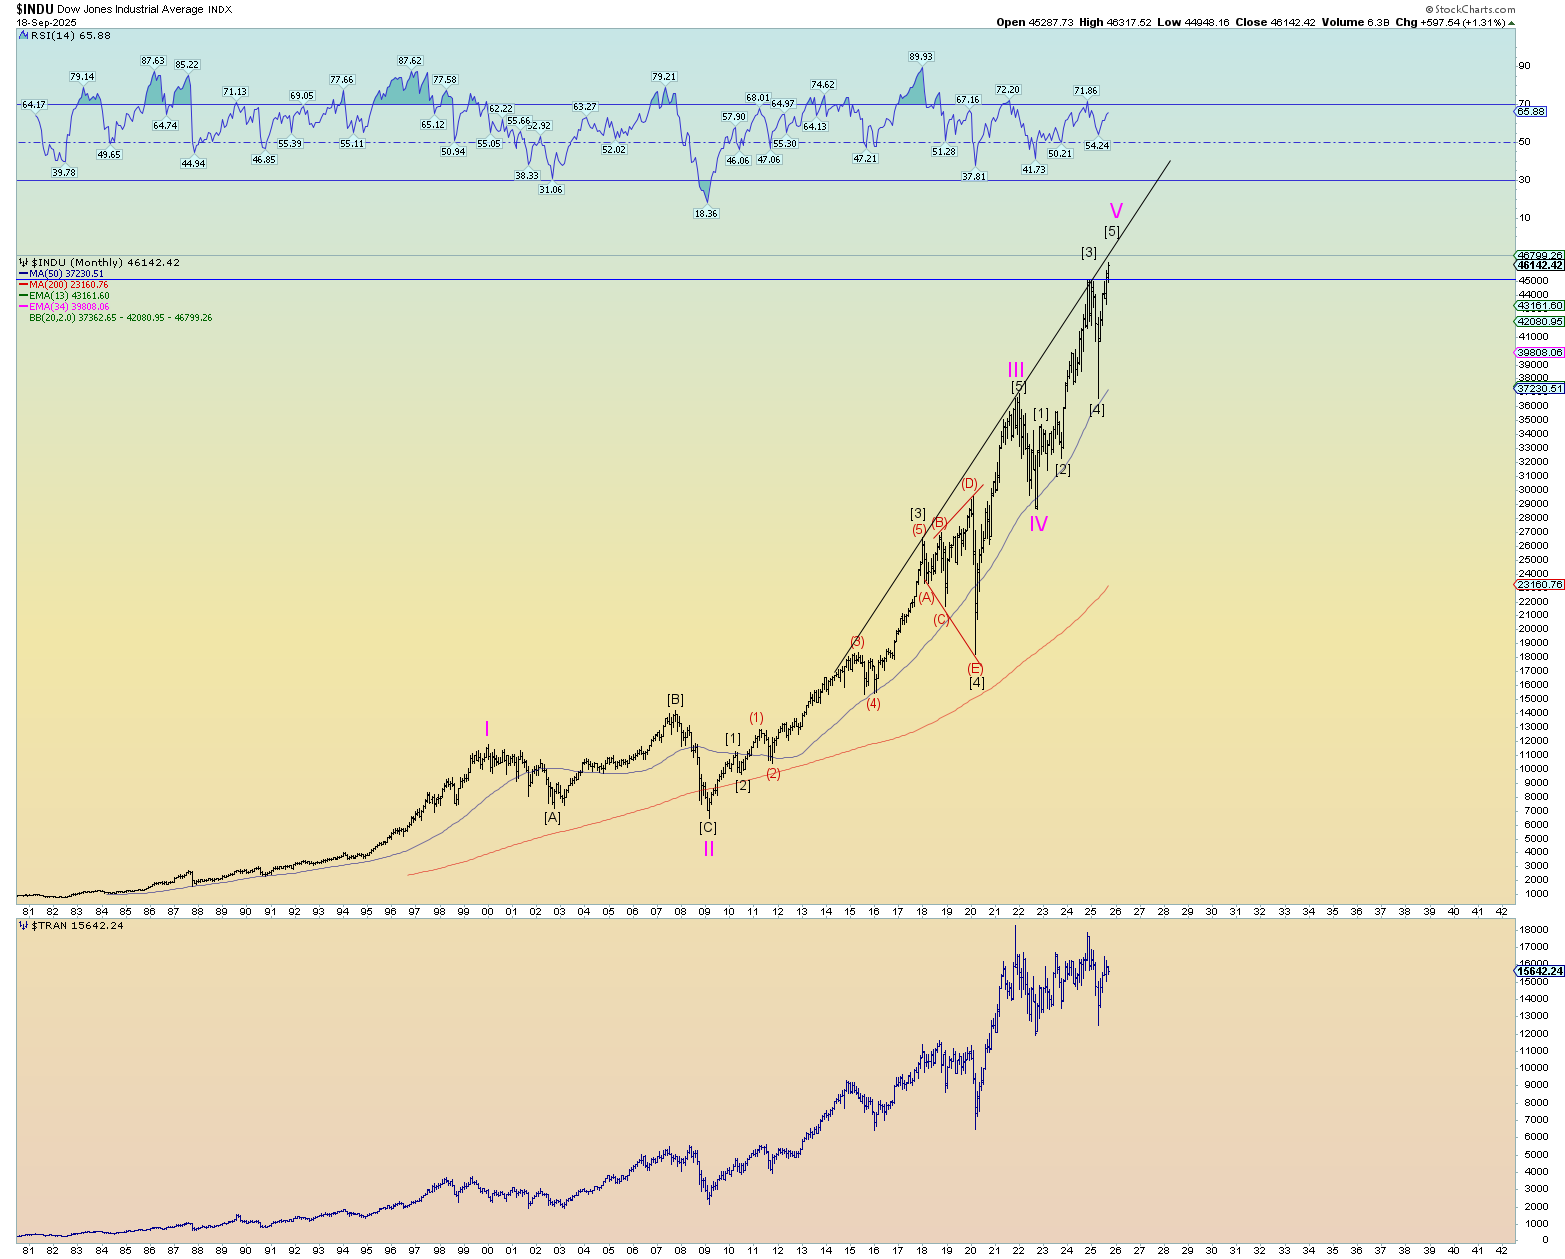
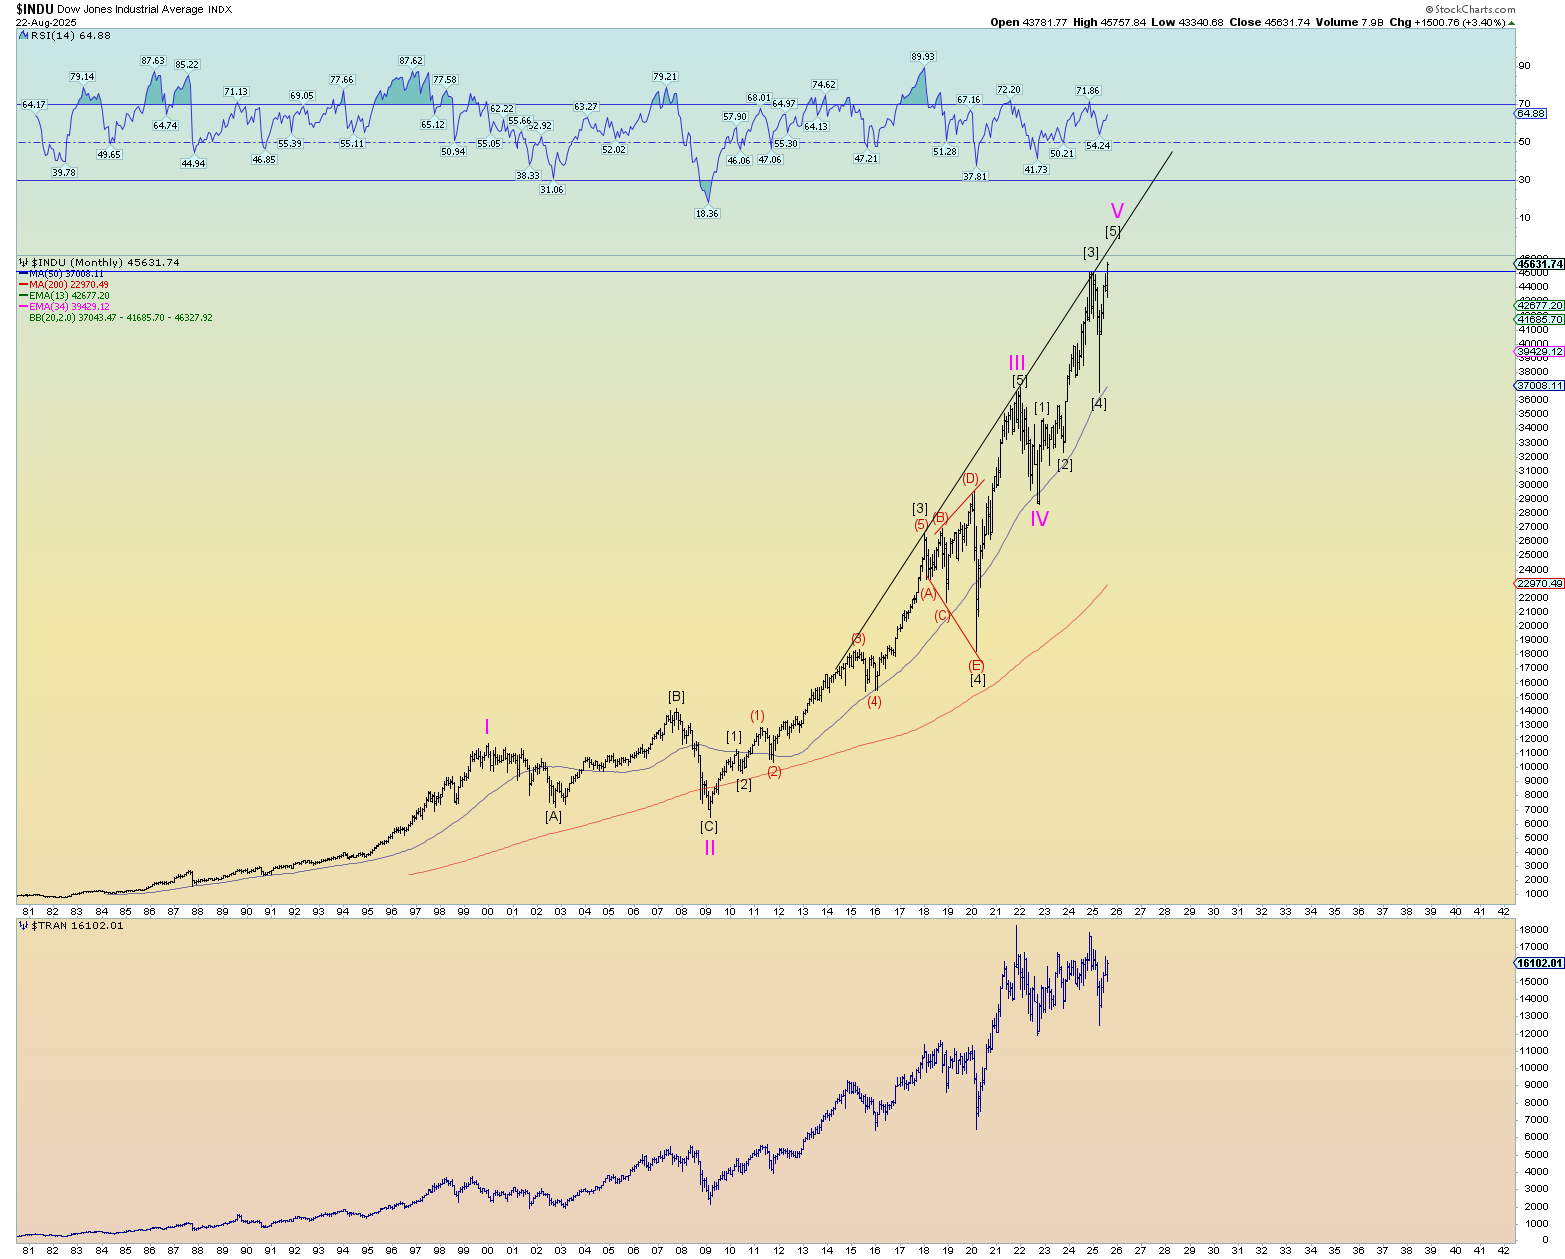
I show the DJIA in a different cycle-sized count to contrast the possible very large scale counts. It really doesn’t matter at this stage.
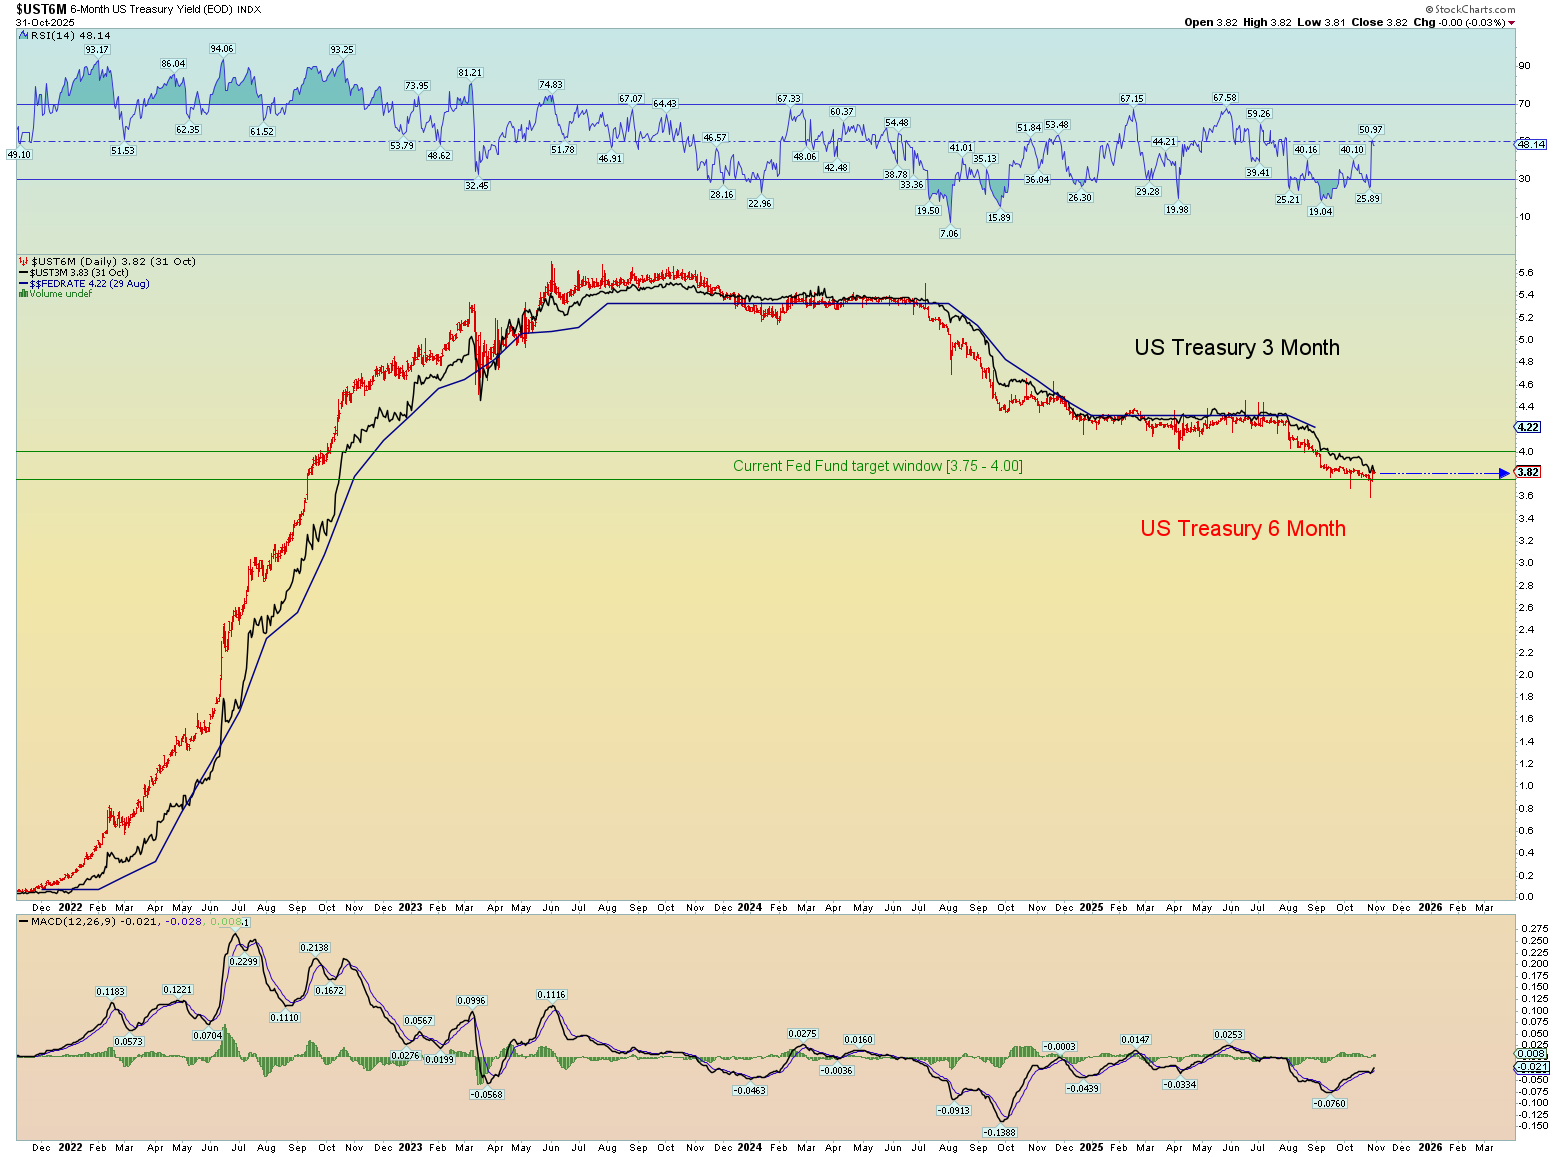
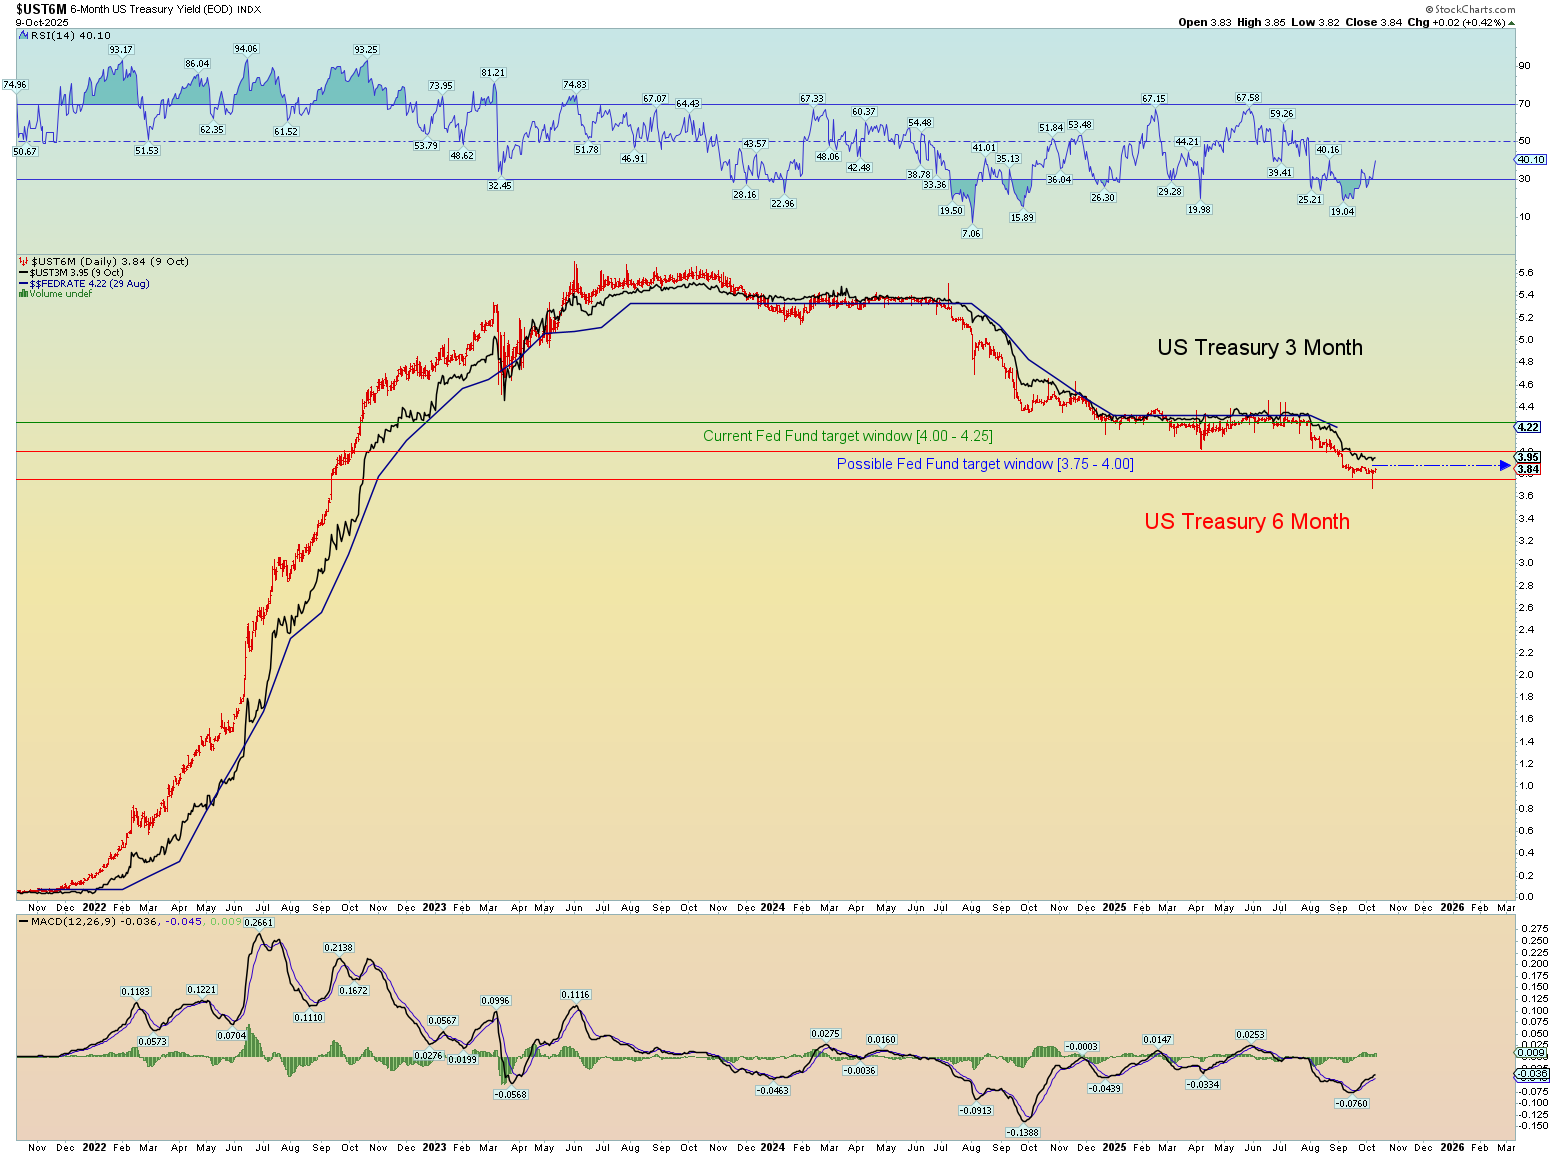
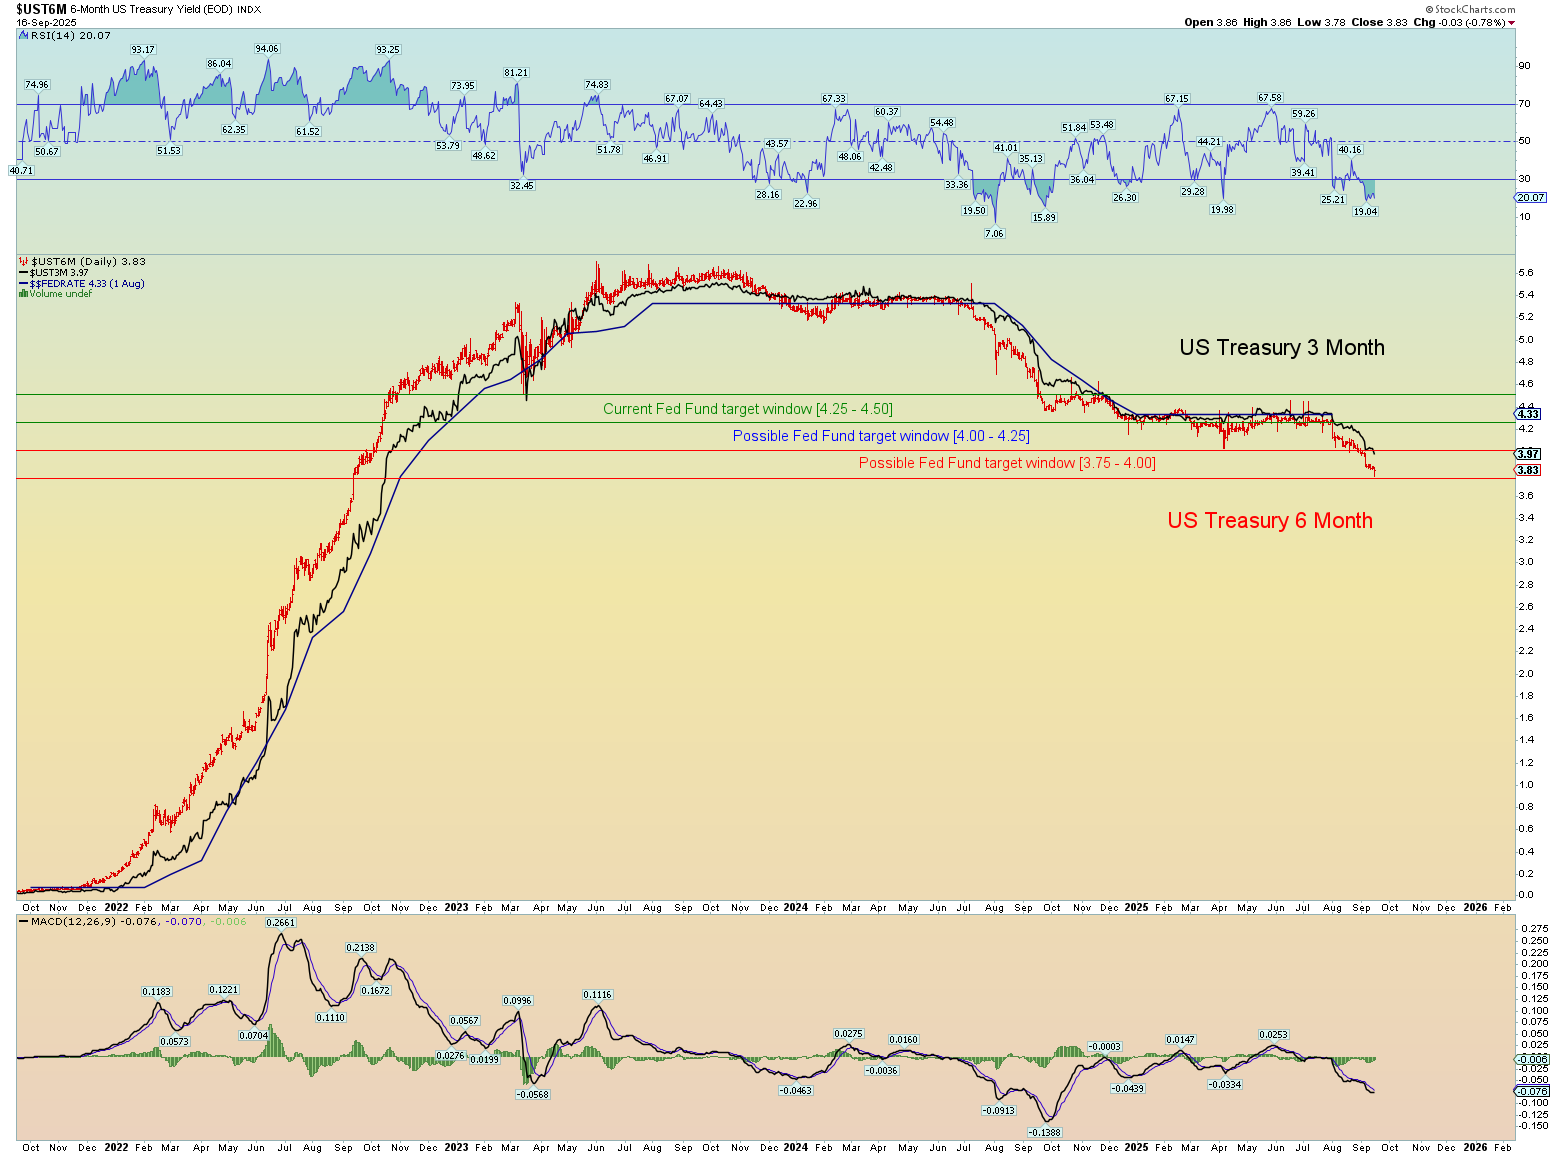
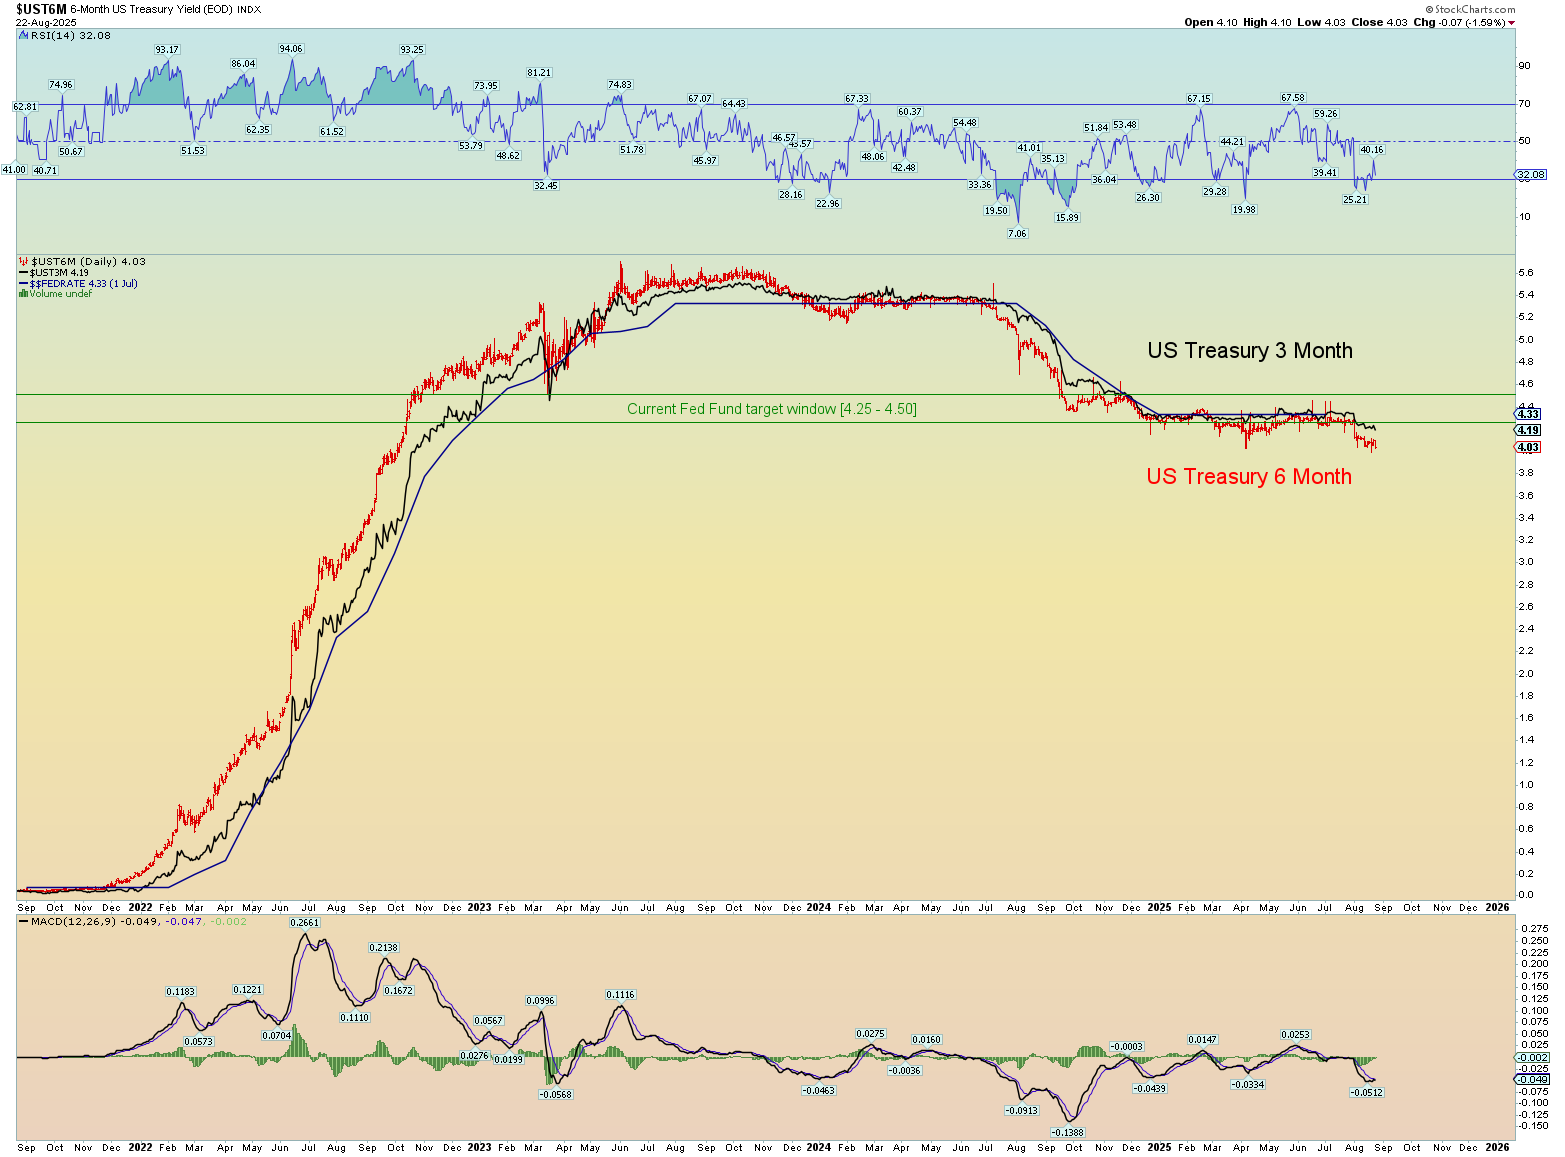
How much will the Fed cut? My prediction is a 1/2 point cut to take the rate window down to 3.75 – 4.00%. This will come as a “shock” to the market because overall consensus is only a 1/4-point cut. But the 3- and 6-month yields have already moved beneath into the next window. So that’s the call. And Trump will like Powell again and call him a genius. Seems fitting.
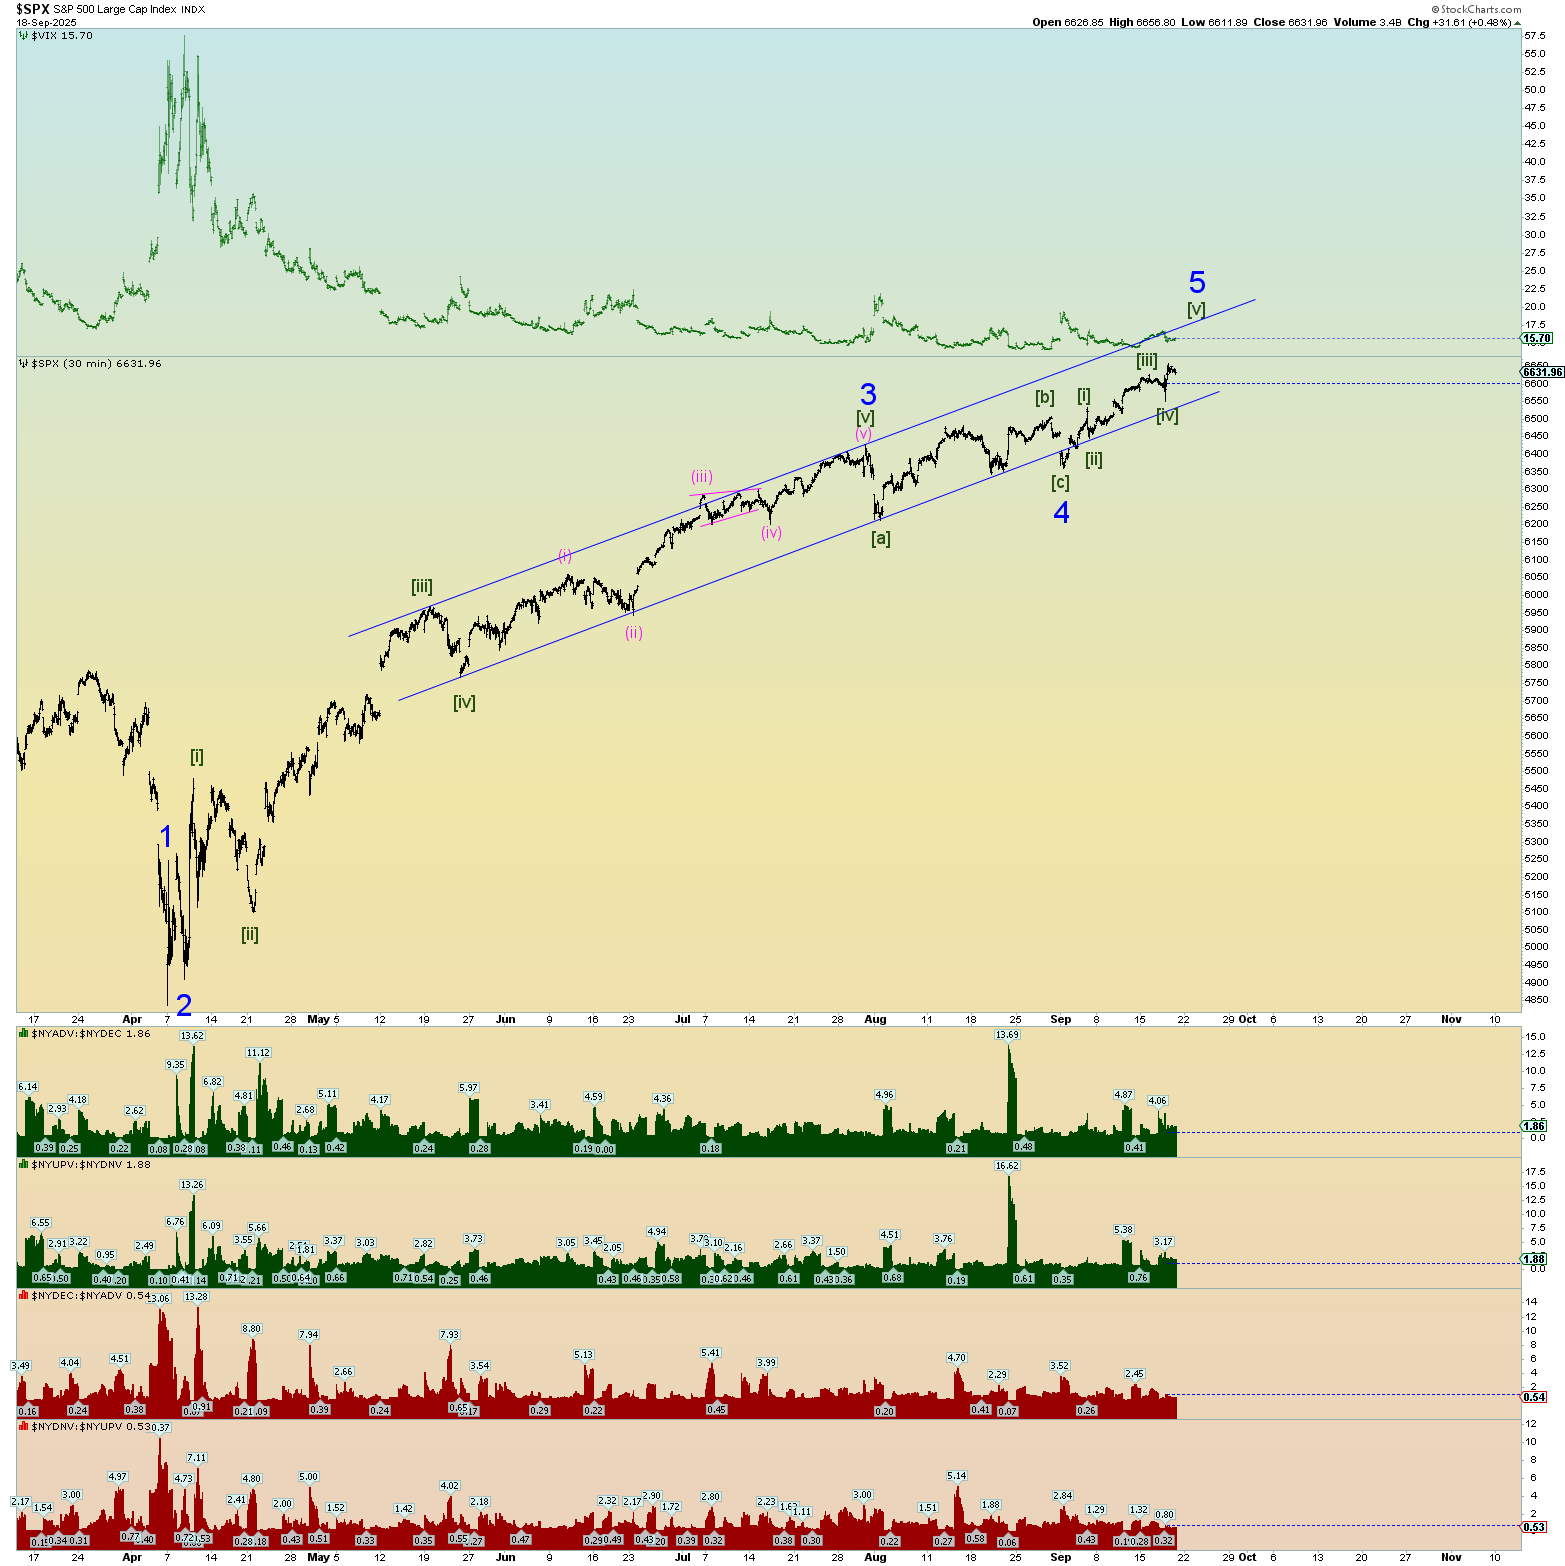
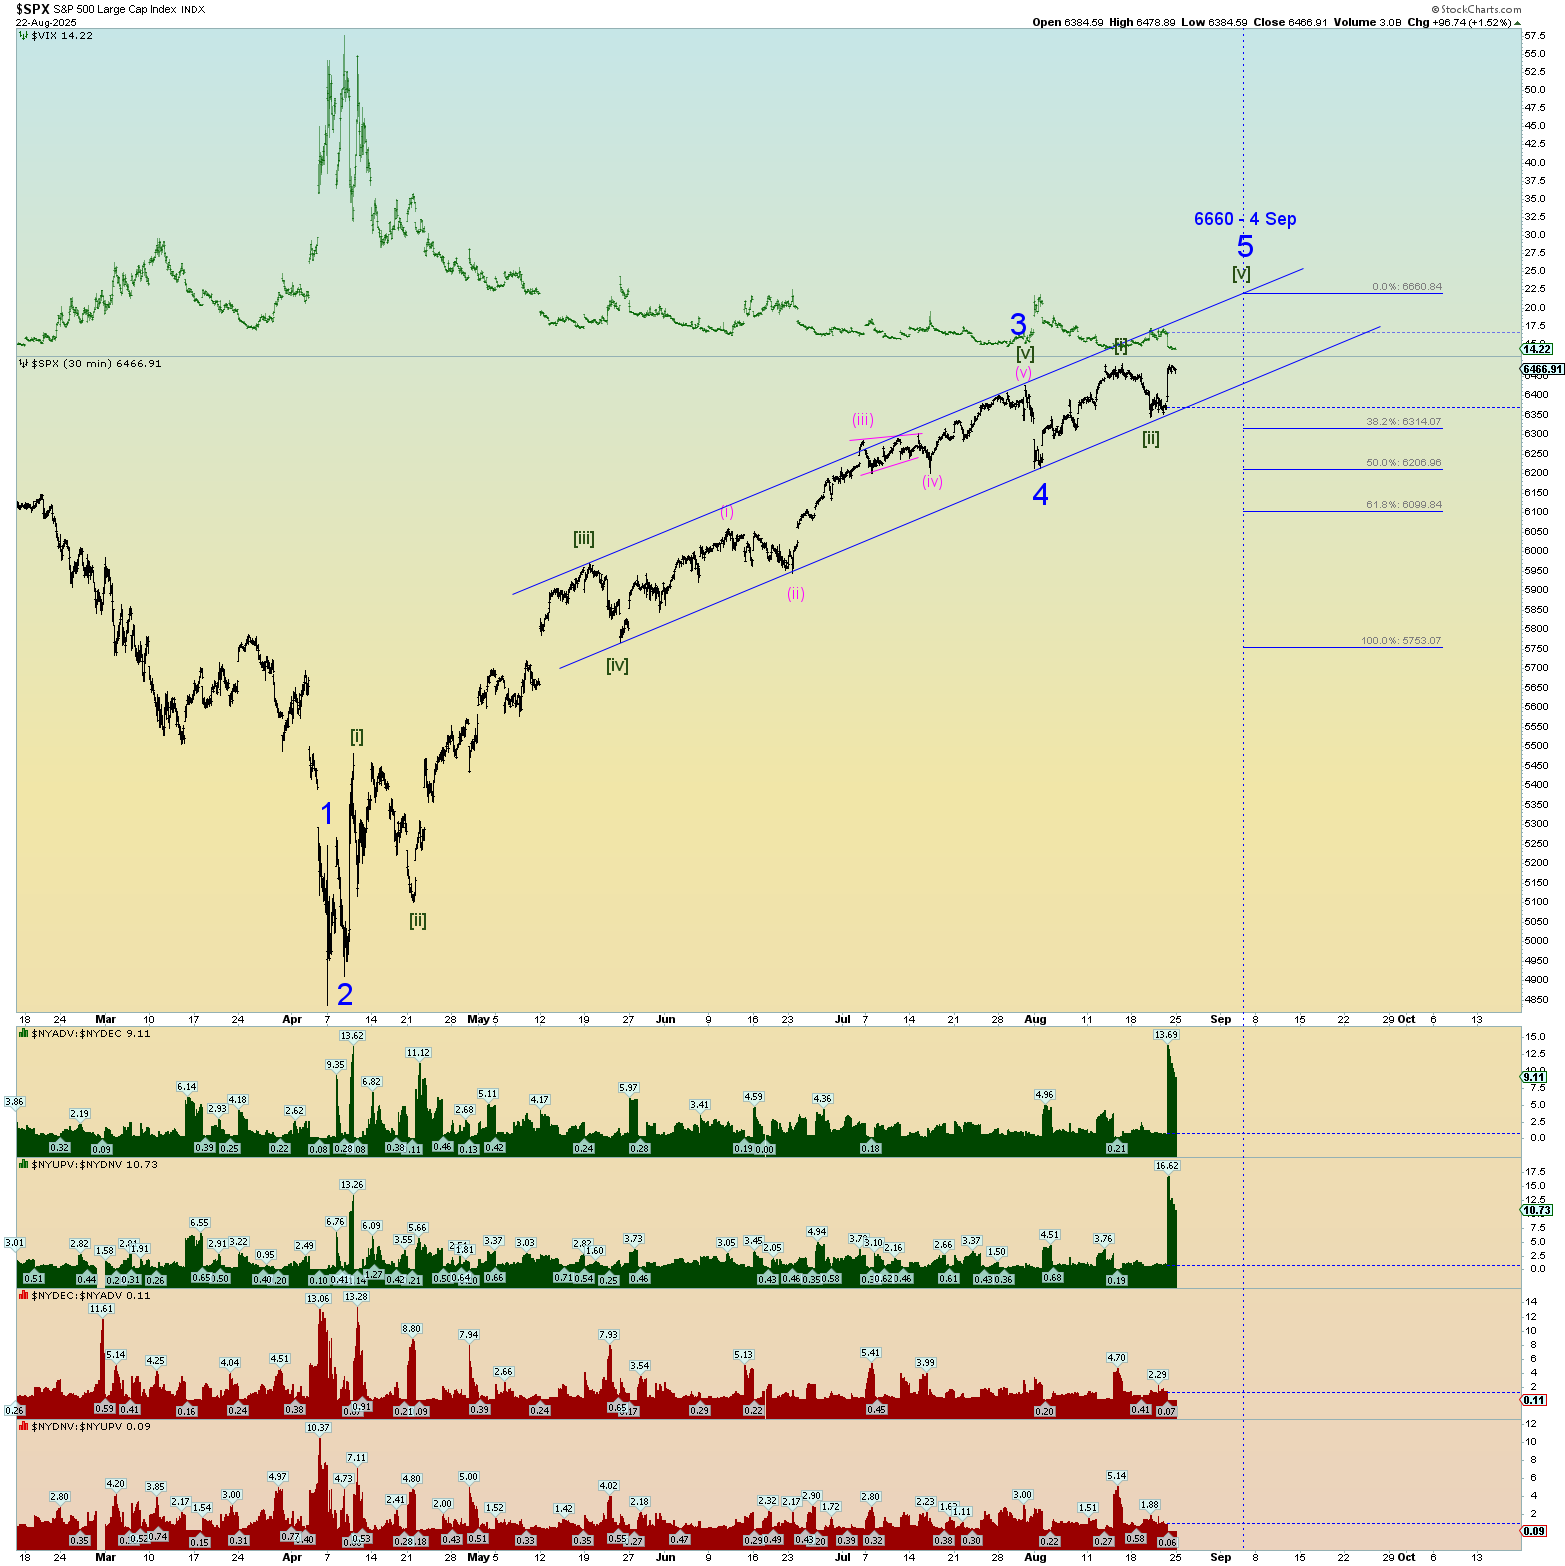
My best attempt at a count at the moment. Two numbers that seem inevitably will be reached is the two numbers I mentioned in my last update 3 weeks ago.
DOW 46,368 (24th number in the Fibonacci sequence)
SPX 6660.00 (The SPX’s low in 2010 was 666.79. Seems fitting it will make this 10x multiple.)
Well, that burst and solid finish over DOW 45,000 I talked about in the last post I made finally occurred. I suspected it would. The NASDAQ is lagging which I also talked about. The SPX is knocking on the door of another all-time intraday high.
I do believe this is the AI bubble coming to its peak. Again, the exact timing is a best guess based on wave forms, channels, and some signs of a market peak via social mood manifestations. What that may be who knows.
Who recalls that the S&P 500 bottomed out in 2010 at a low of 666? Well, it is certainly interesting that we are coming up to SPX 6660. A 10X multiple.
Another possible number to watch for is concerning the DJIA. The 24th sequence of Fibonacci numbers is 46,368, a mere 700 points away. If the SPX approaches 6660 no doubt the DOW would be right around 46,368. Exciting times!
Market internals on the NYSE were monster as you can see in the graphs at the bottom of my SPX chart. An absolute monster 90% up day in both volume and number of stocks up verses down. This is actually probably bearish herding behavior nearer a top rather than a “kickoff” to something very long-lasting. However, this top to end all tops could get crazy. Hang on for the ride. When the AI bubble pops and everyone realizes it all at the same time, it’ll be a mad dash to collect profits.
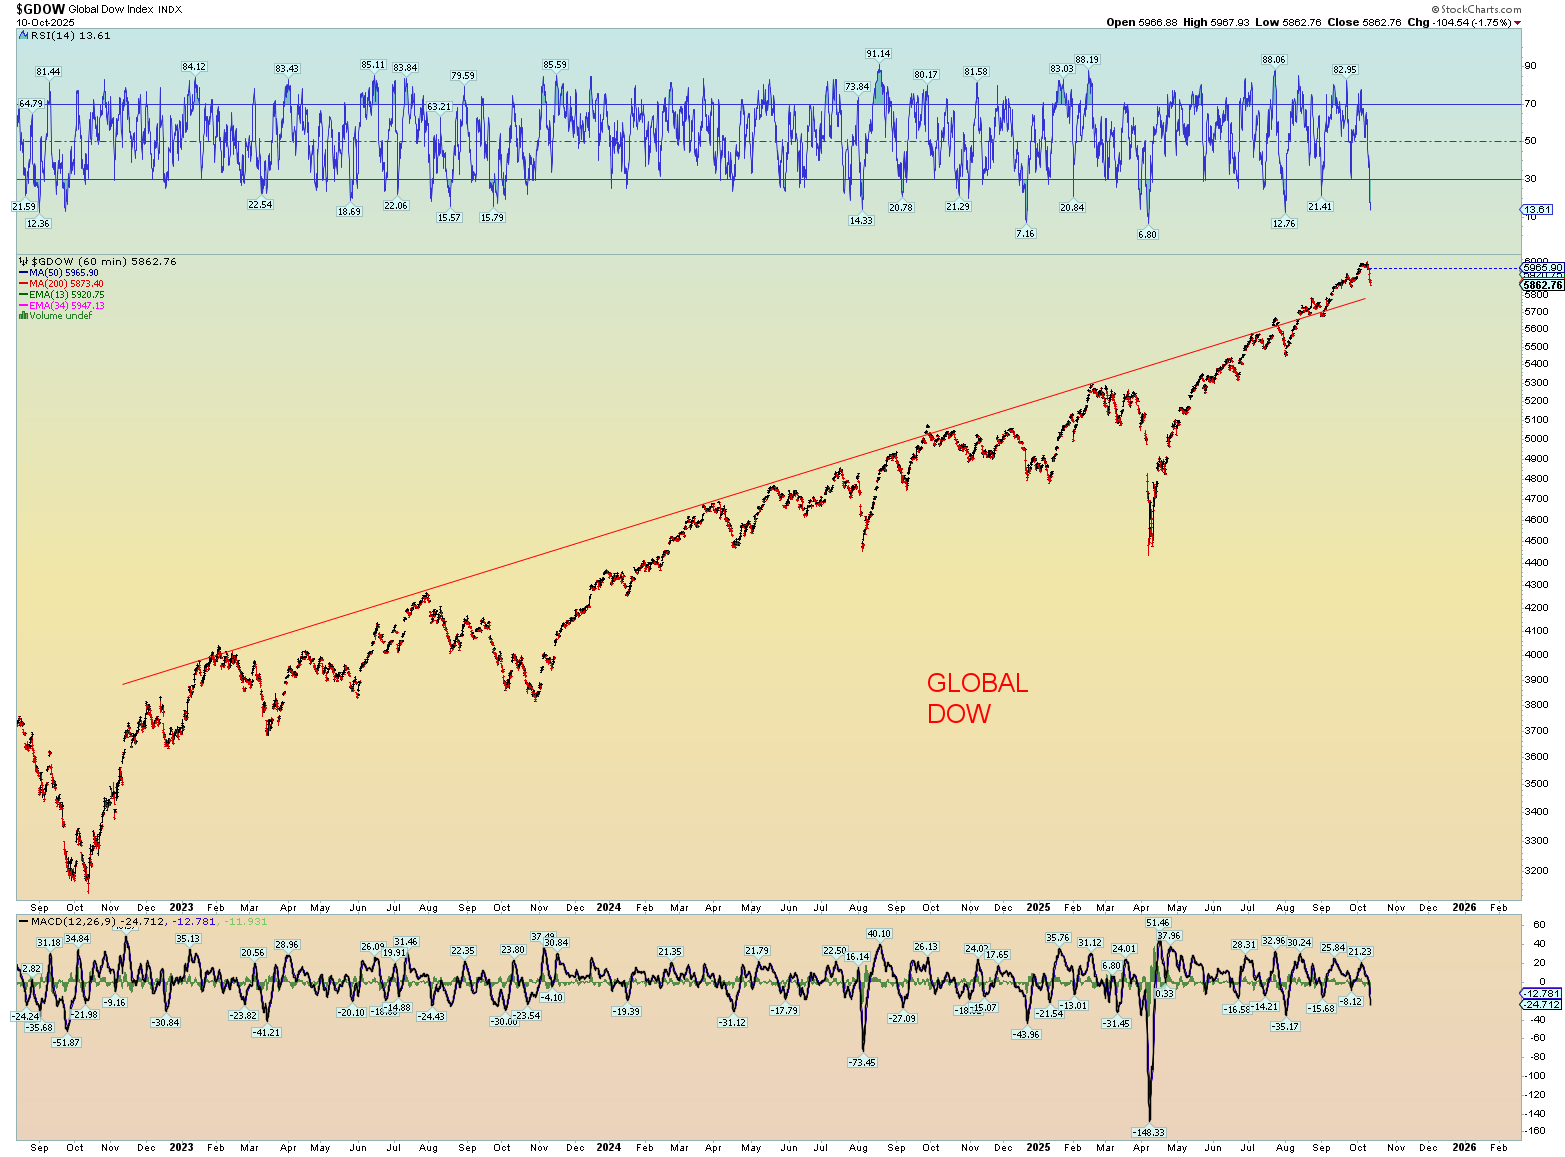
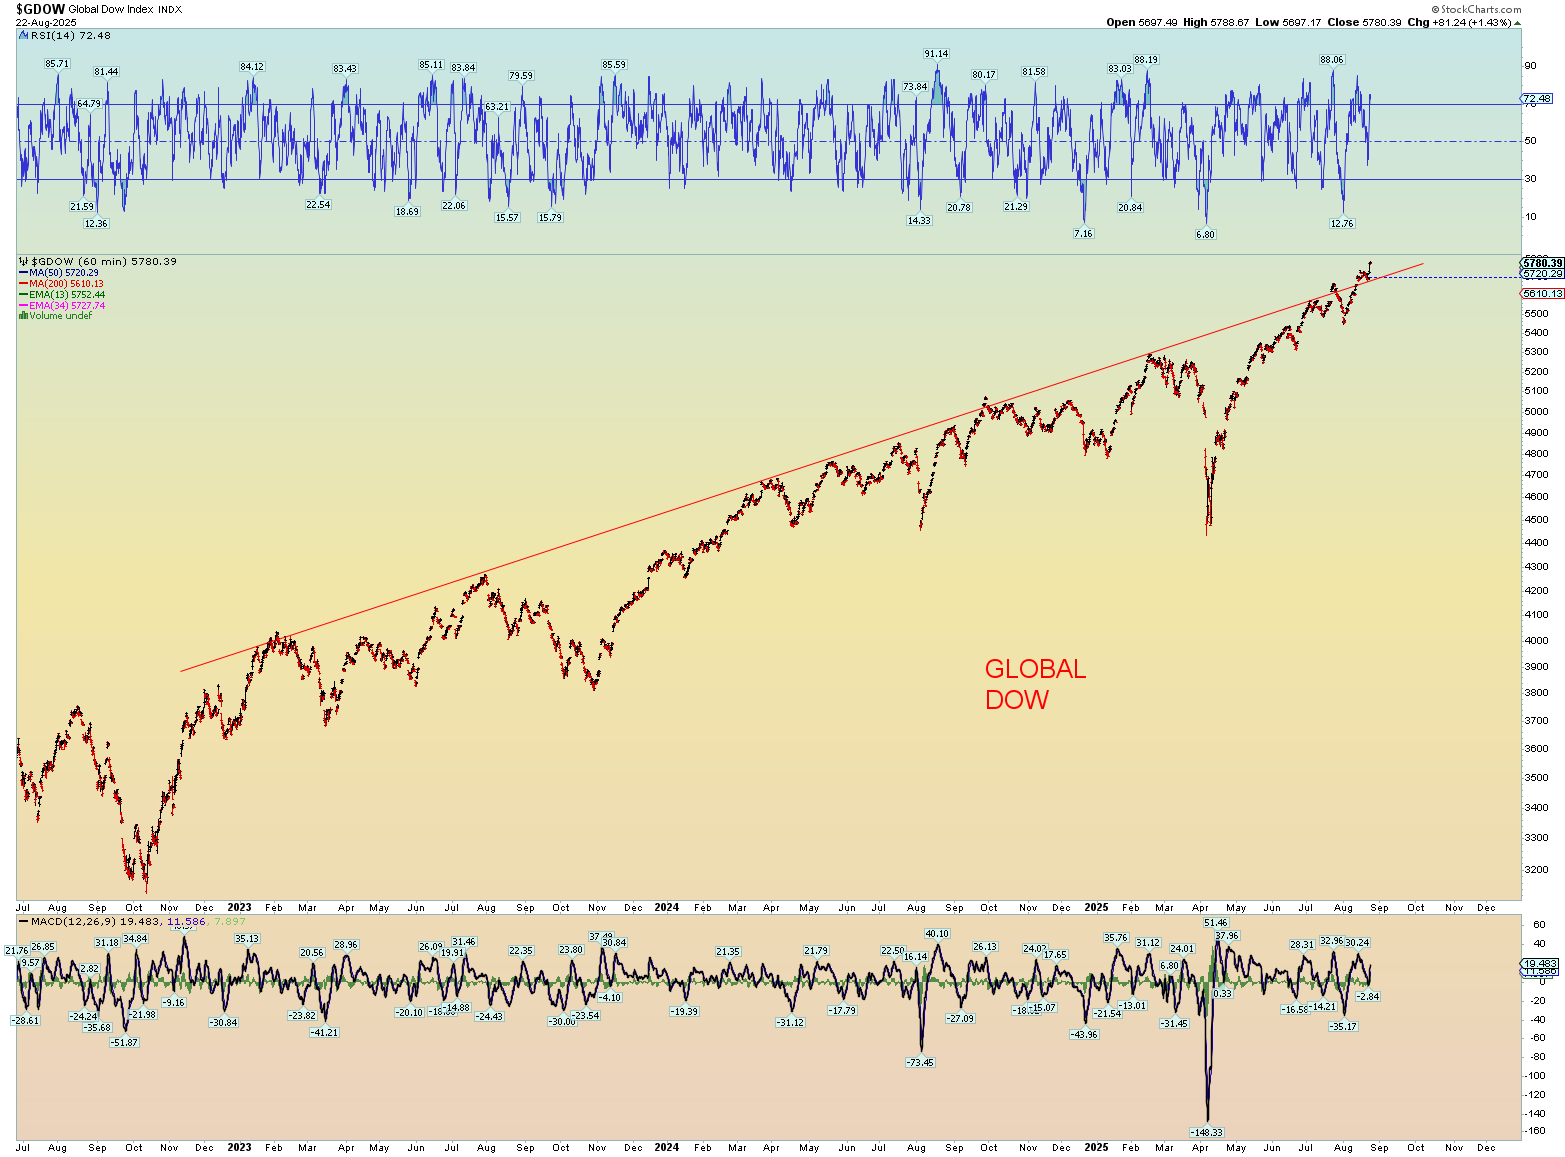
This is a global phenomenon. Global DOW is just on steroids.
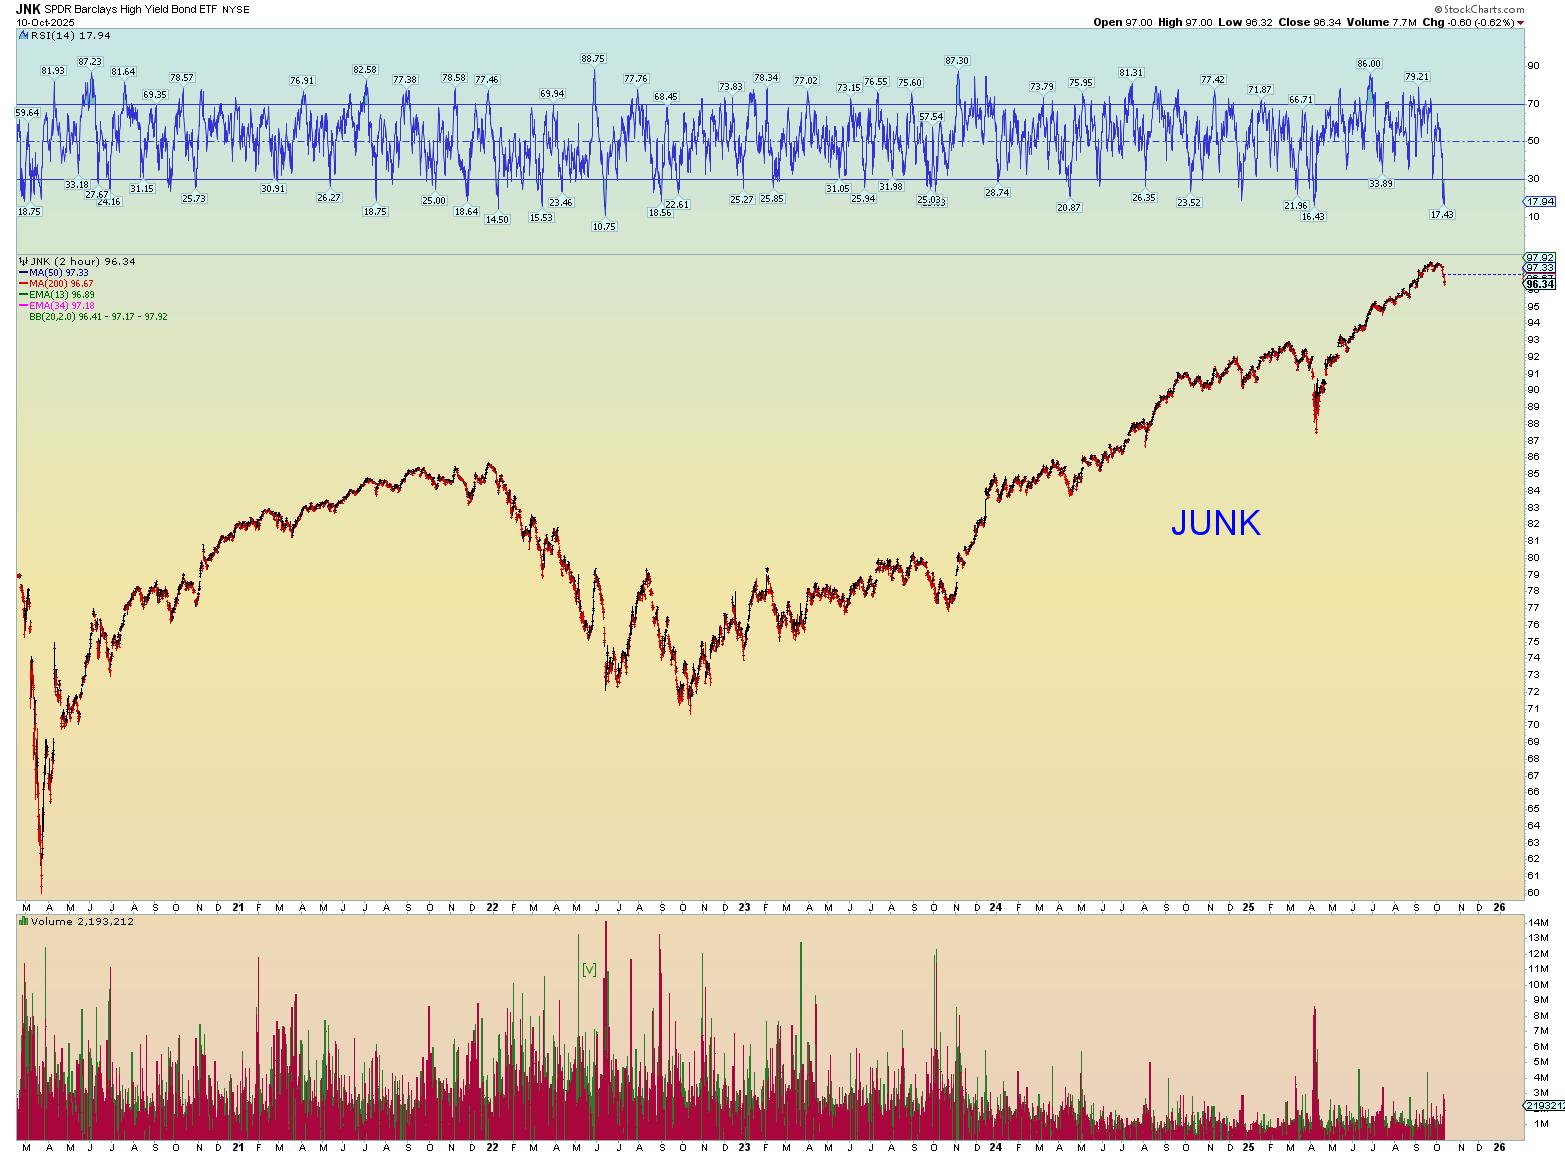
Junk debt? Who cares! Its like gold to investors.
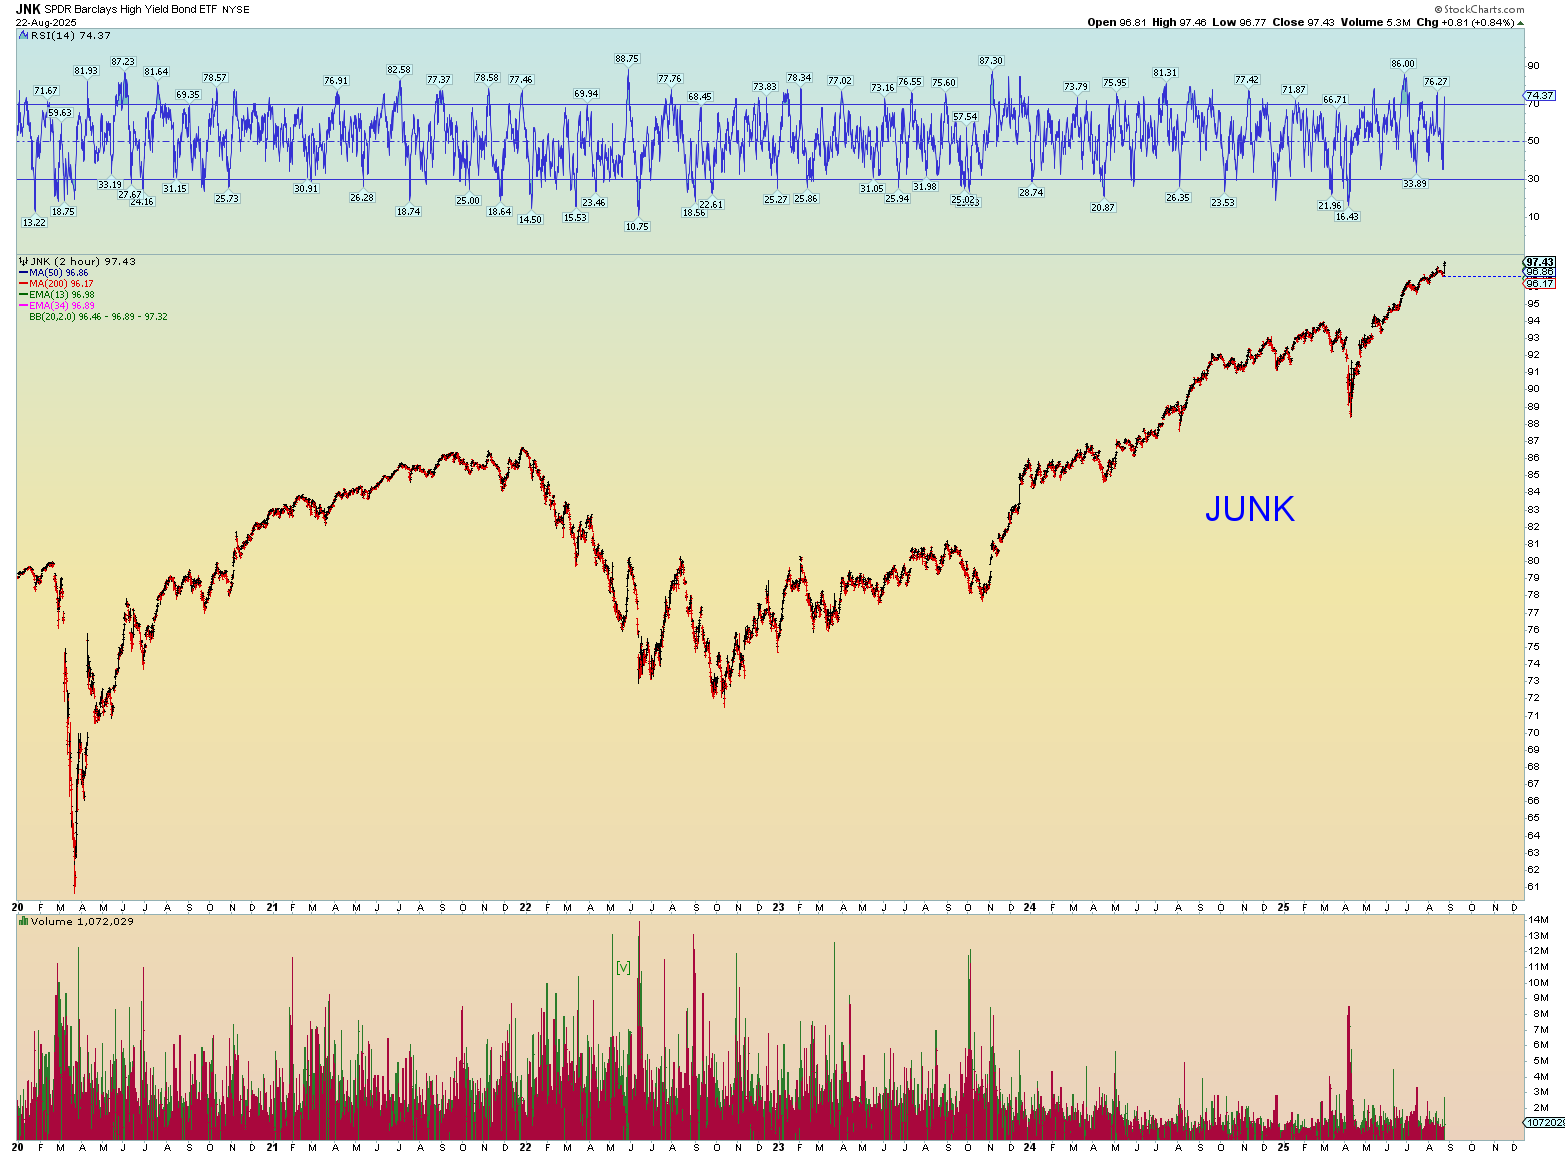
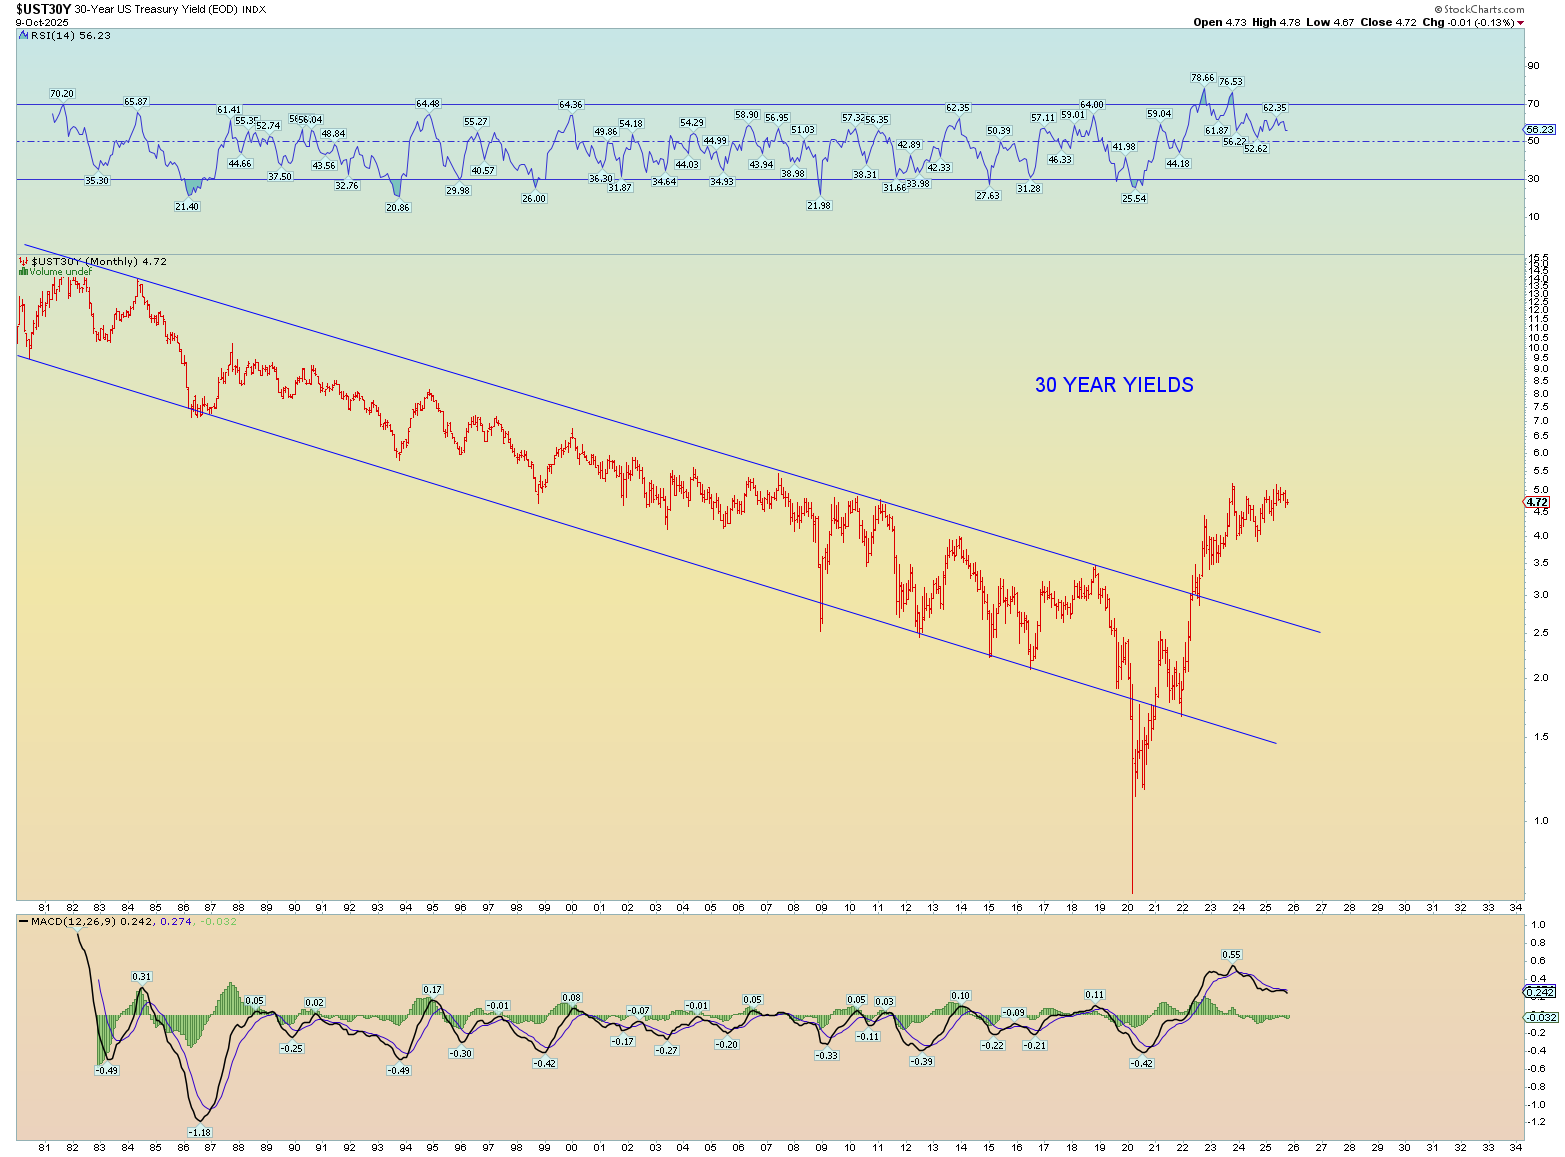
The “news” of the market screaming higher is that Powell will support a September cut. Well of course he does, because finally the market has signaled to him, he must do so. Powell HAS to follow the market. The Fed rate cannot get out of whack with what the massive treasury market signals. The market leads, the Fed follows. Who thinks a .25 cut will help anything at this point? A credit card at 29.99% cut to 29.74% is NOT helping the consumer. Nor is it really helping the overall interest debt load of the US Treasury which has surged to over a 1 trillion a year. Yeah, it’s all just funny money now, isn’t it?
And as per my last blog post, I suspected the Nasdaq would not be leading the Dow over the 45,000 level. The NASDAQ may have quietly downturned first. We shall see.