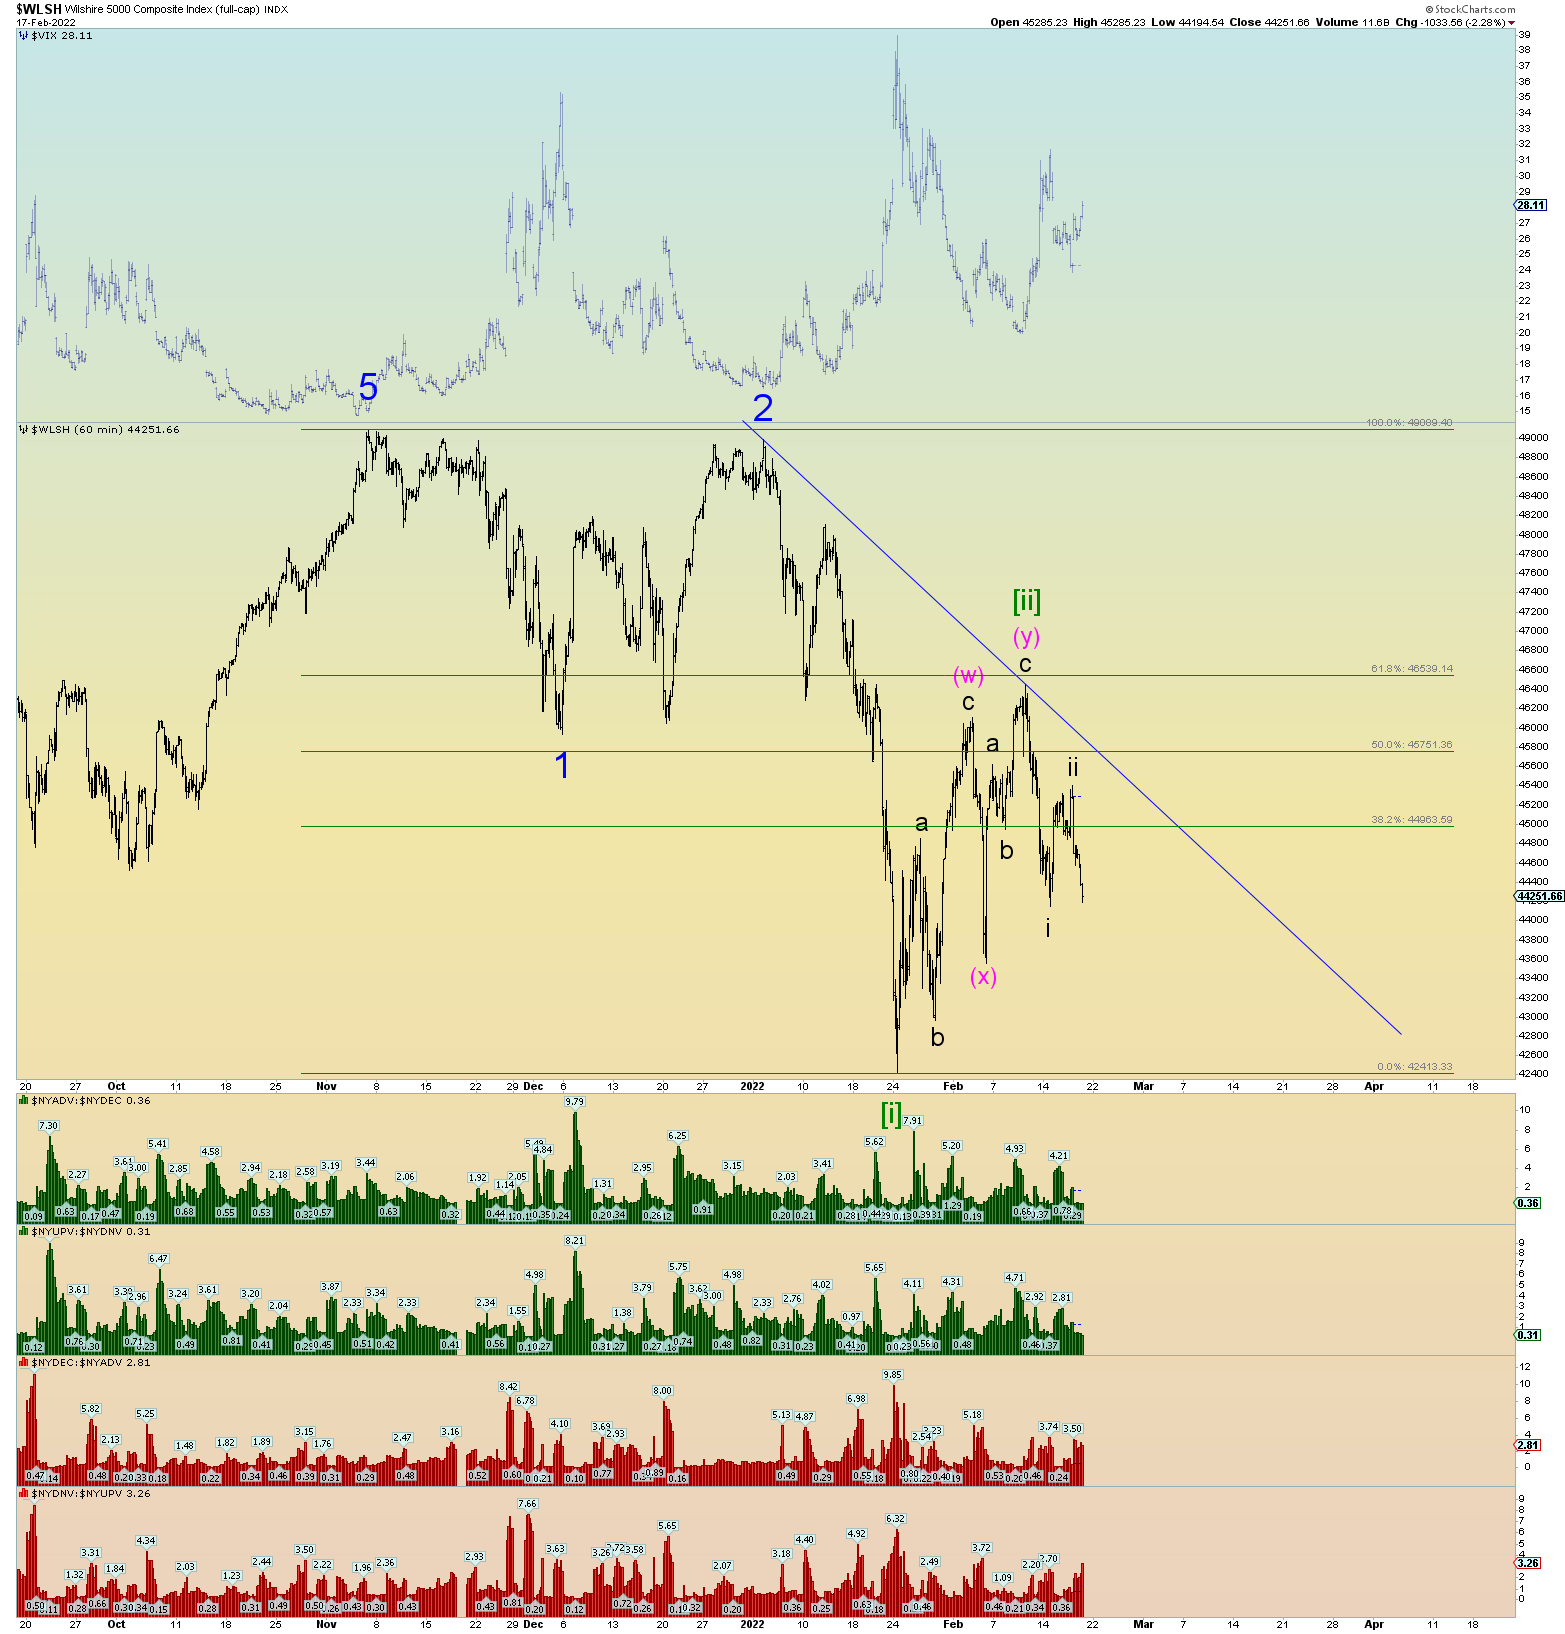
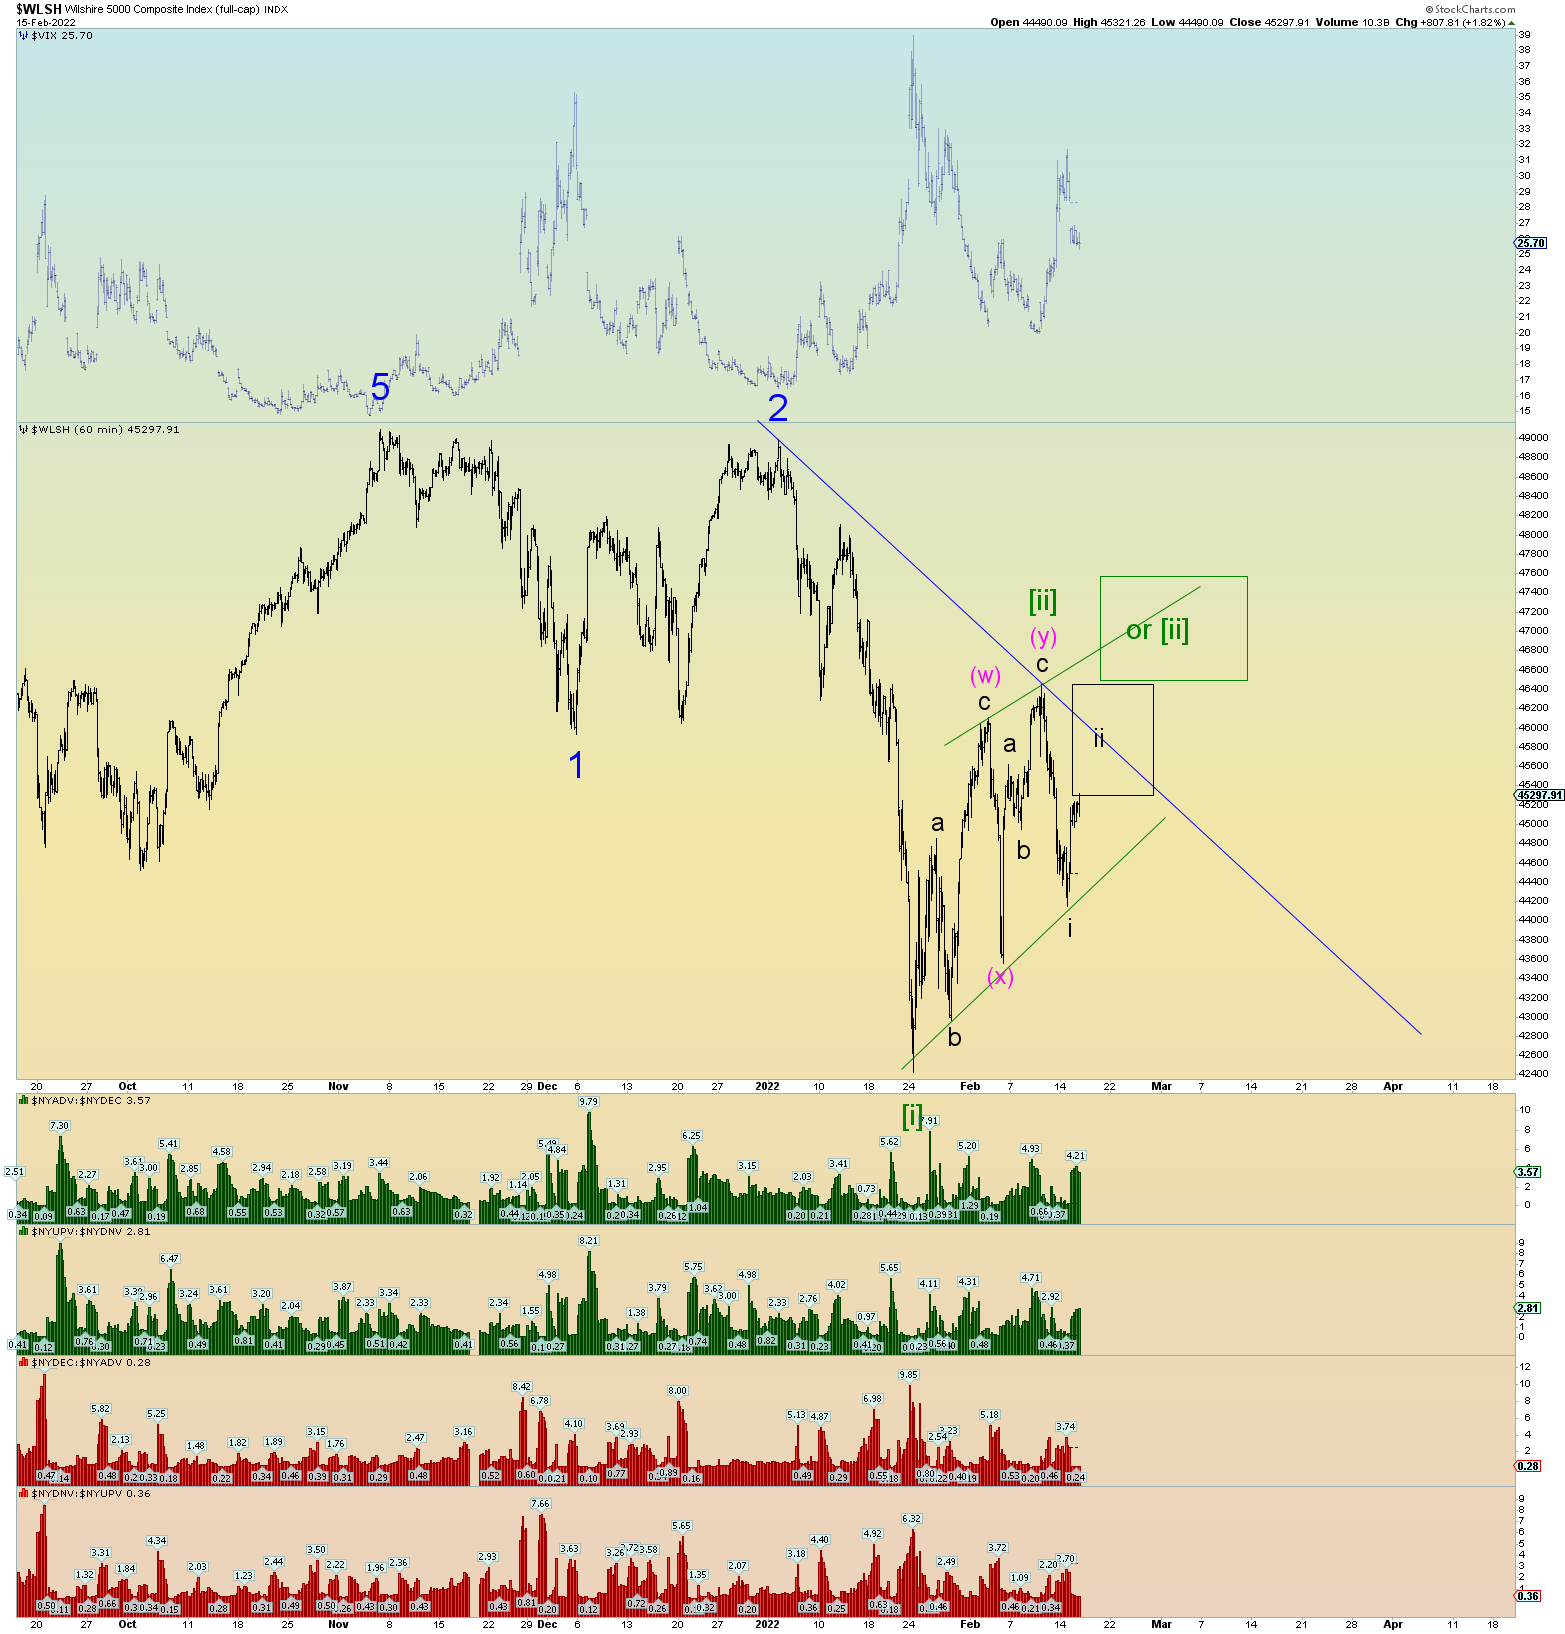
Primary squiggle count below. Basically, the primary count is that the market is shaking off excess bearishness and setting bulls up for a massive price plunge for the next major leg down. The current wave [ii]’s purpose – or Minor 2 on the SPX – is to alleviate excess shorts and rope in any remaining hopeful longs and to yo-yo retail. Once this equilibrium occurs, there will be the least amount of market players positioned for the next major market move which would be extreme down in wave [iii] of 3. Many players will be too scared to “short” (as they are being shaken out) and we are past the point of adding many more longs to the market. The public is already fully engorged in stocks.
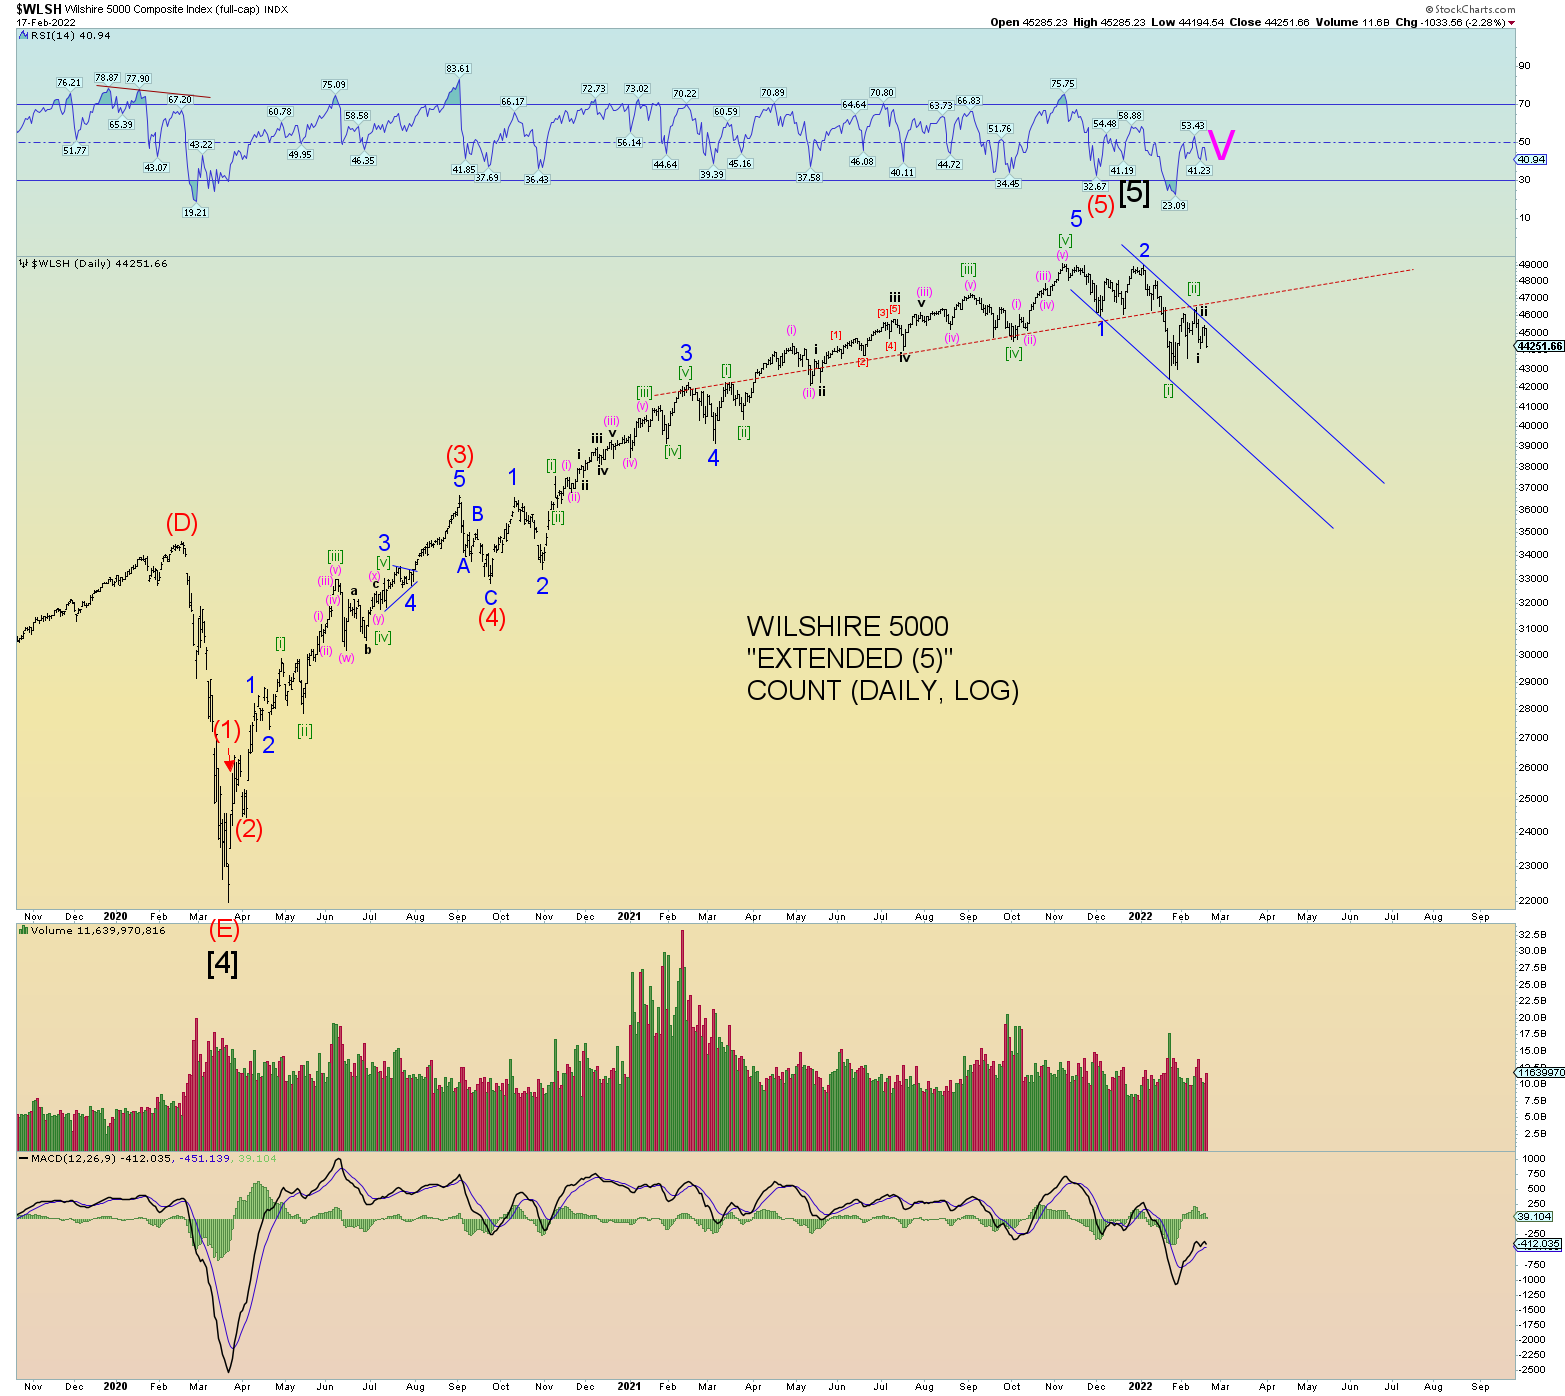
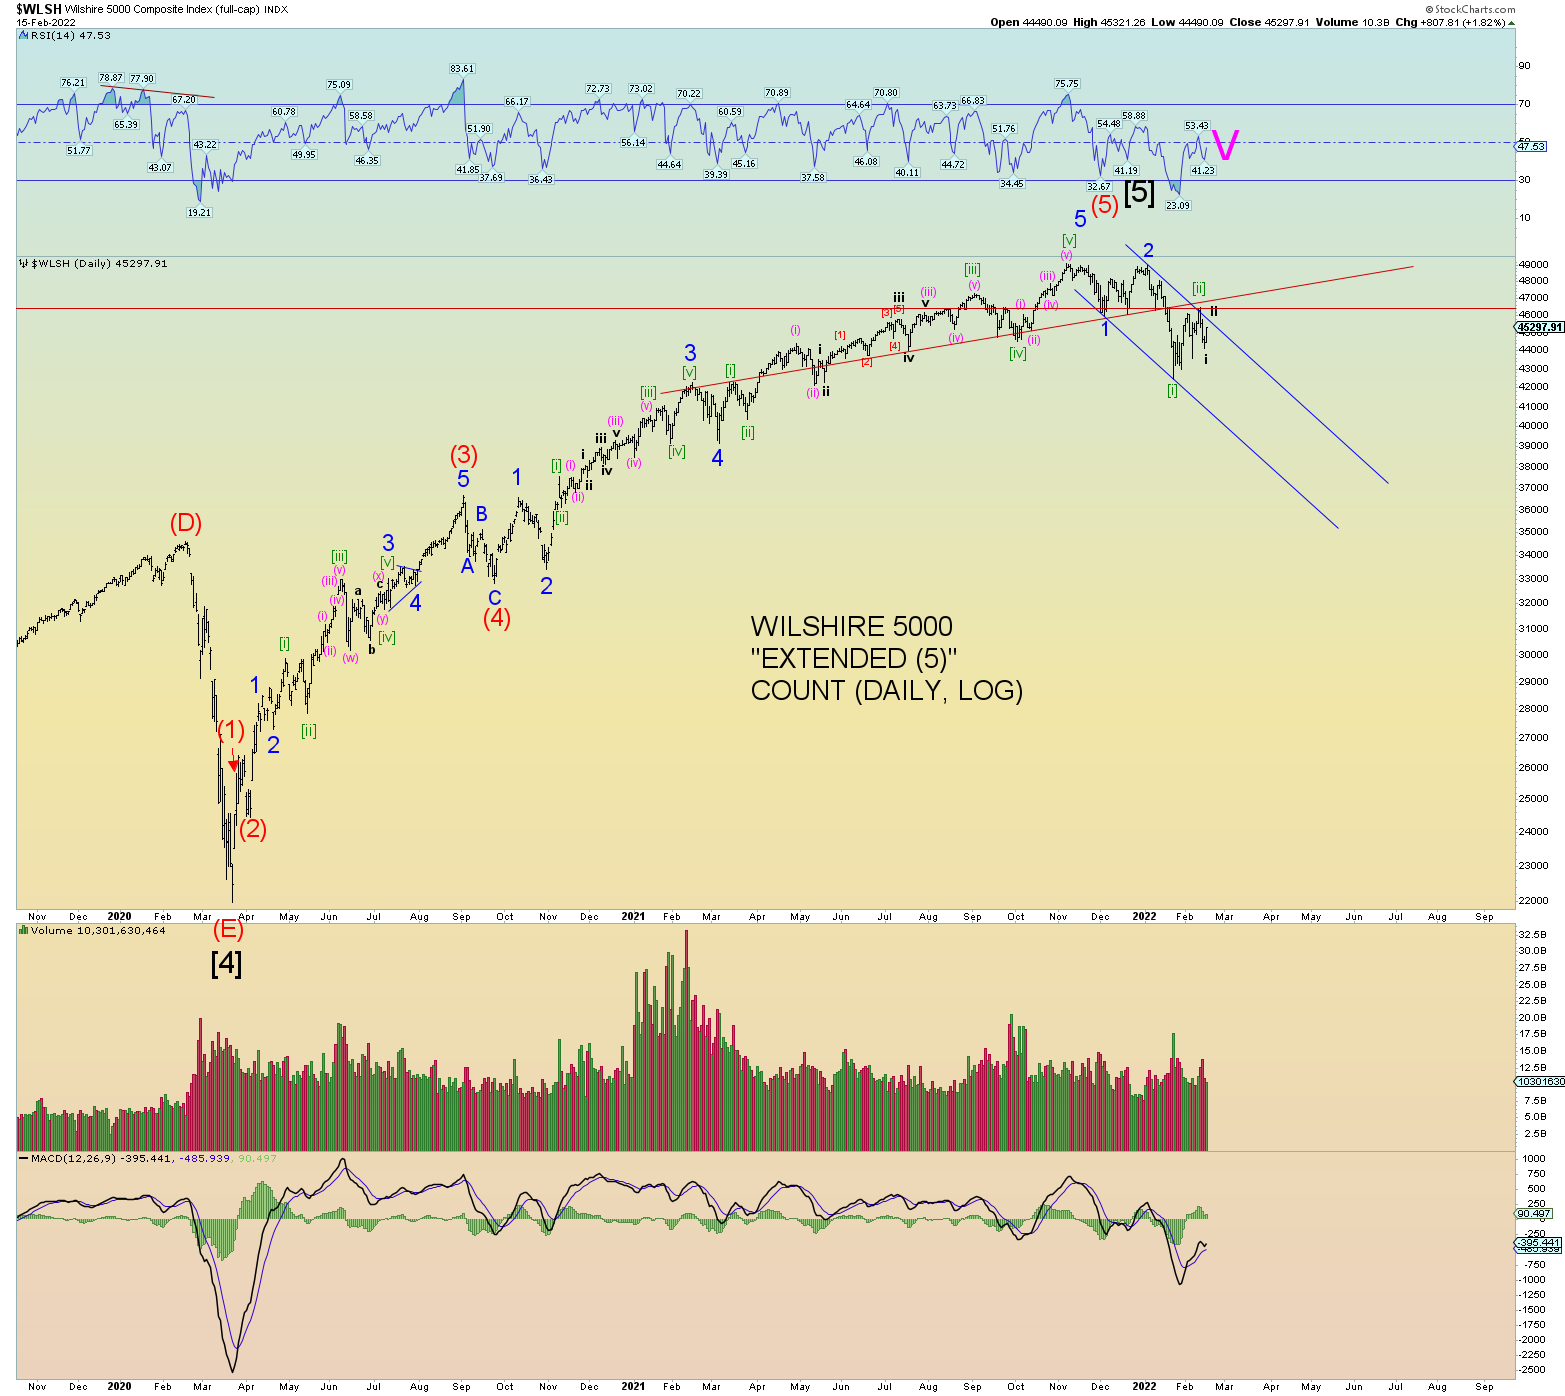
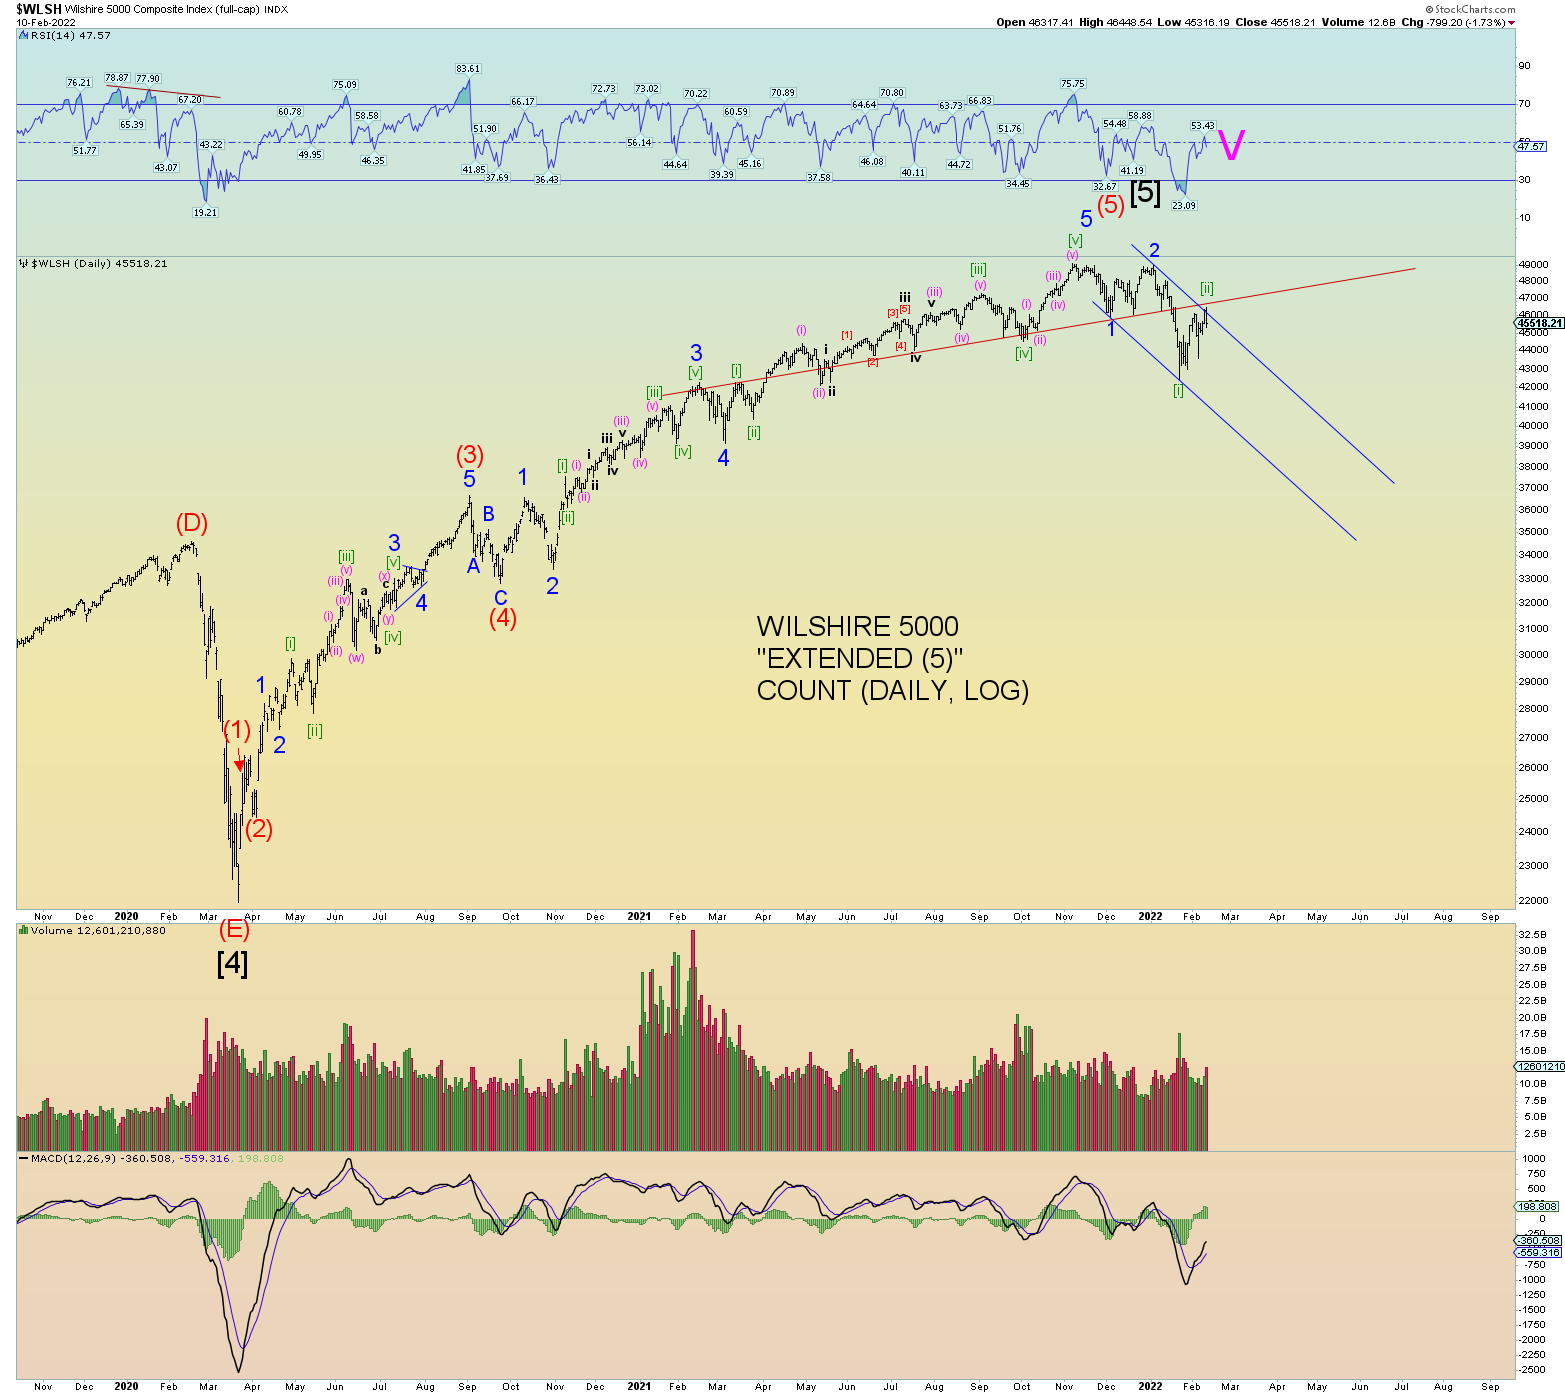
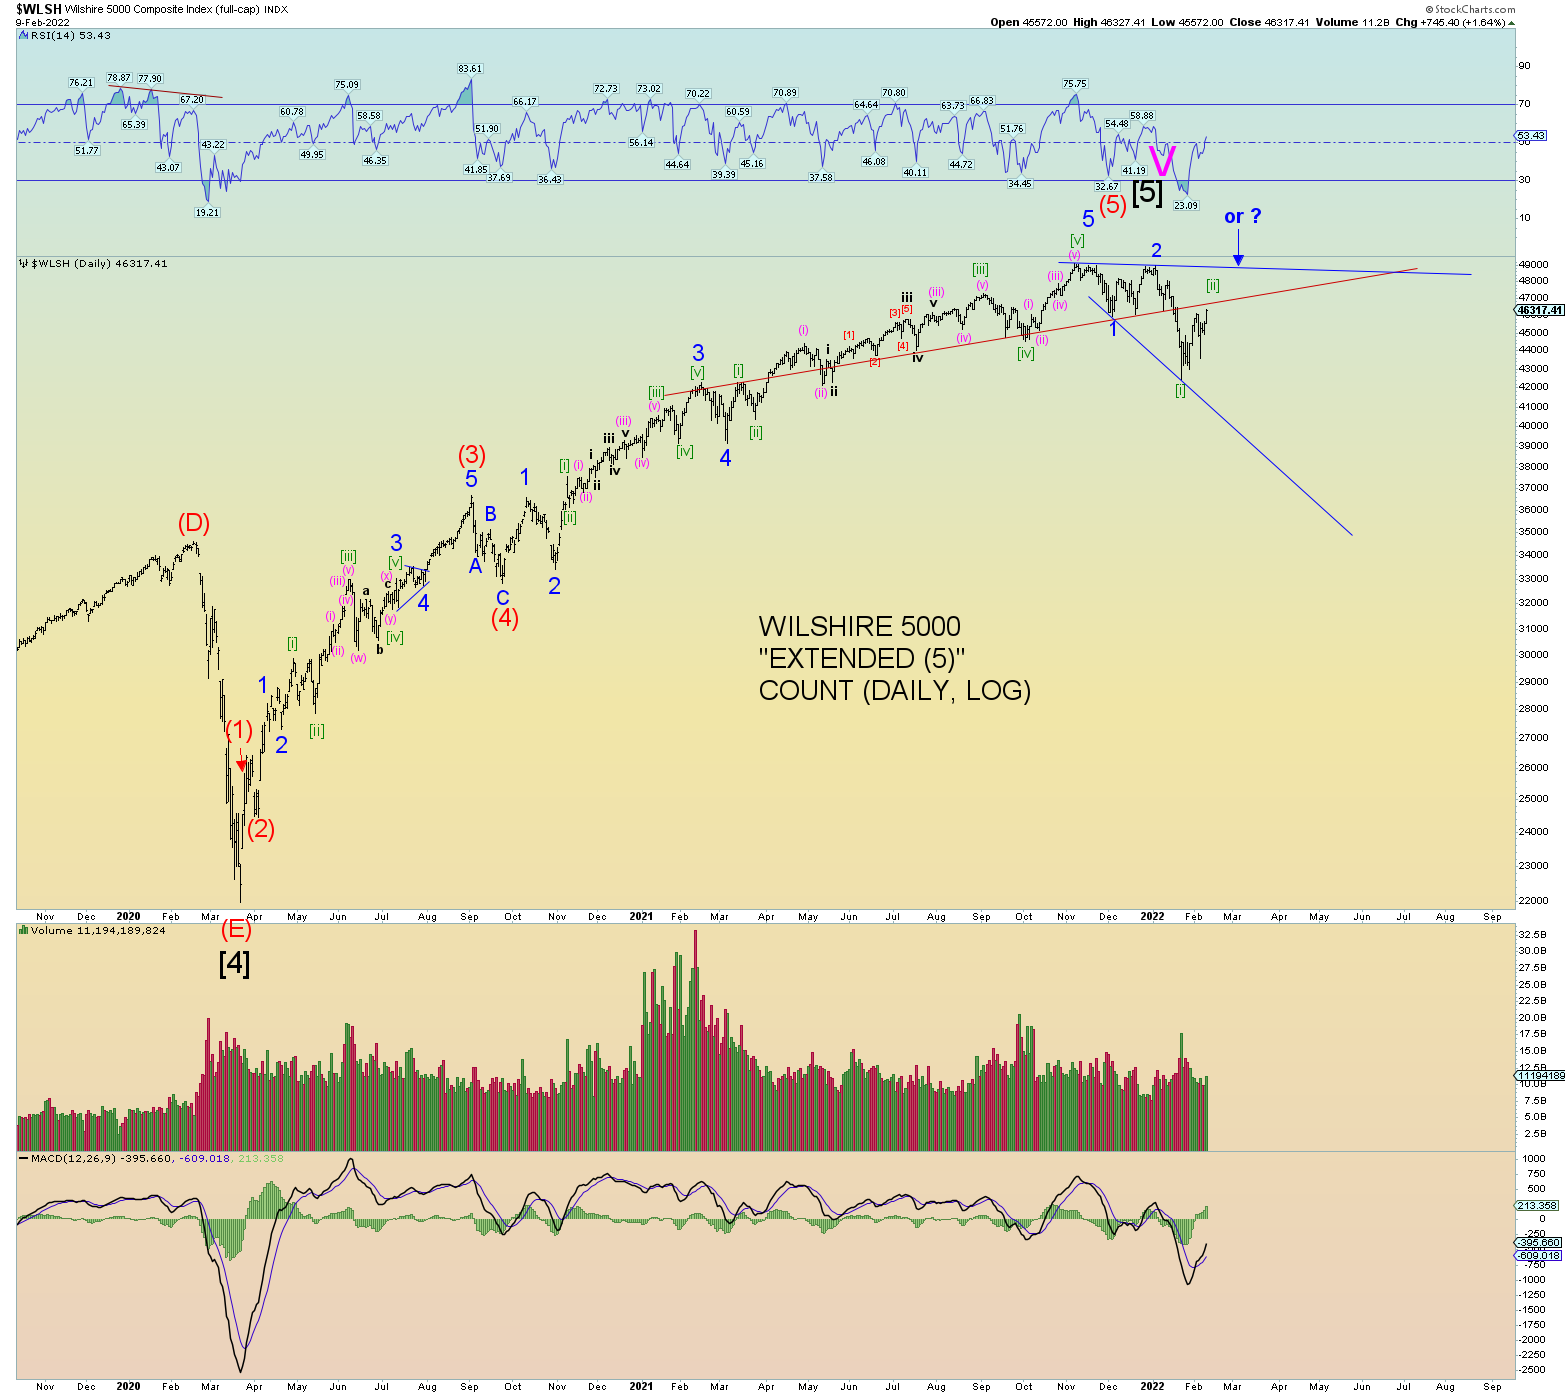
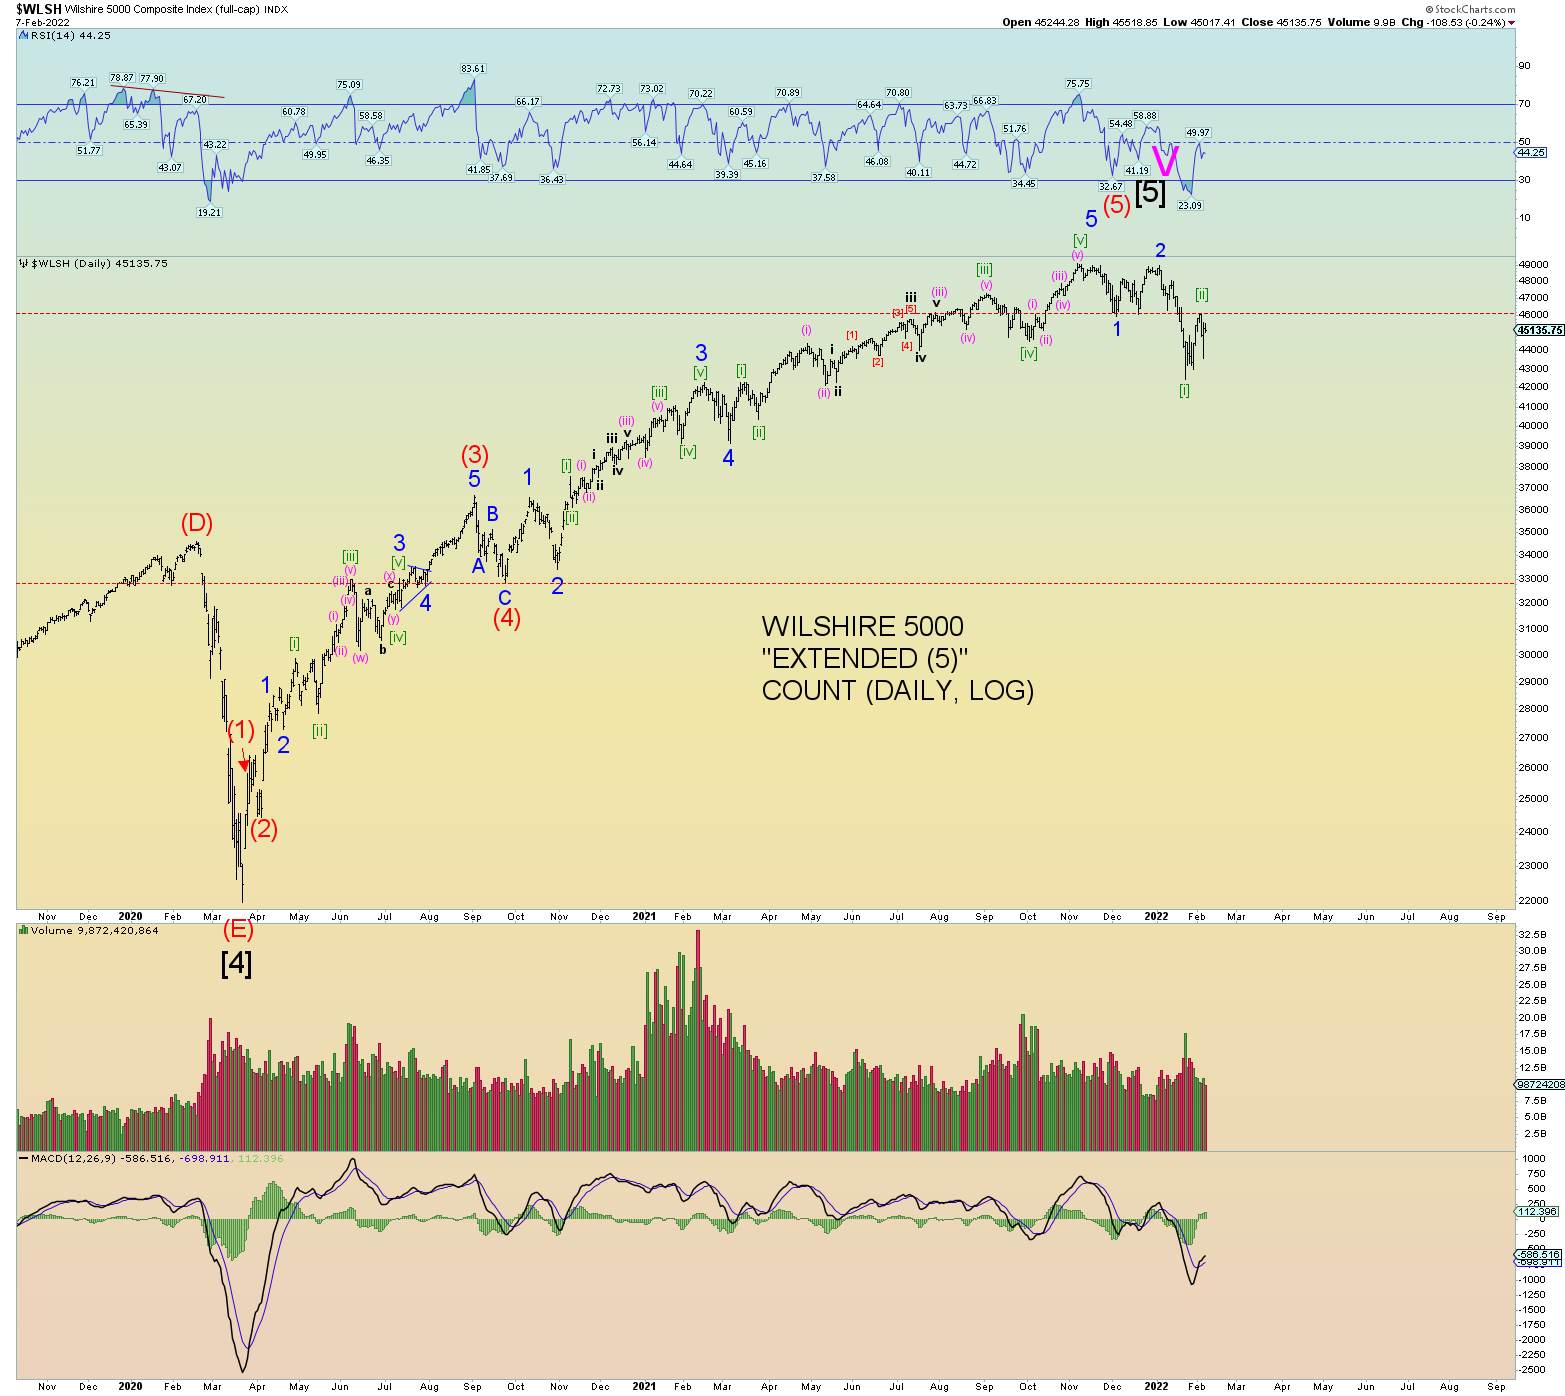
We can see this better on the Wilshire daily chart. The quick price plunge beneath the neckline (and horizontal support) to Minute [i] created a “trading zone”. The bottom of the zone was traded and now prices are in the middle/top of the zone. Yet we still solidly have significant resistances bearing down on prices.
Therefore, the primary count is still bearish even if prices shake out a bit more to the upside.
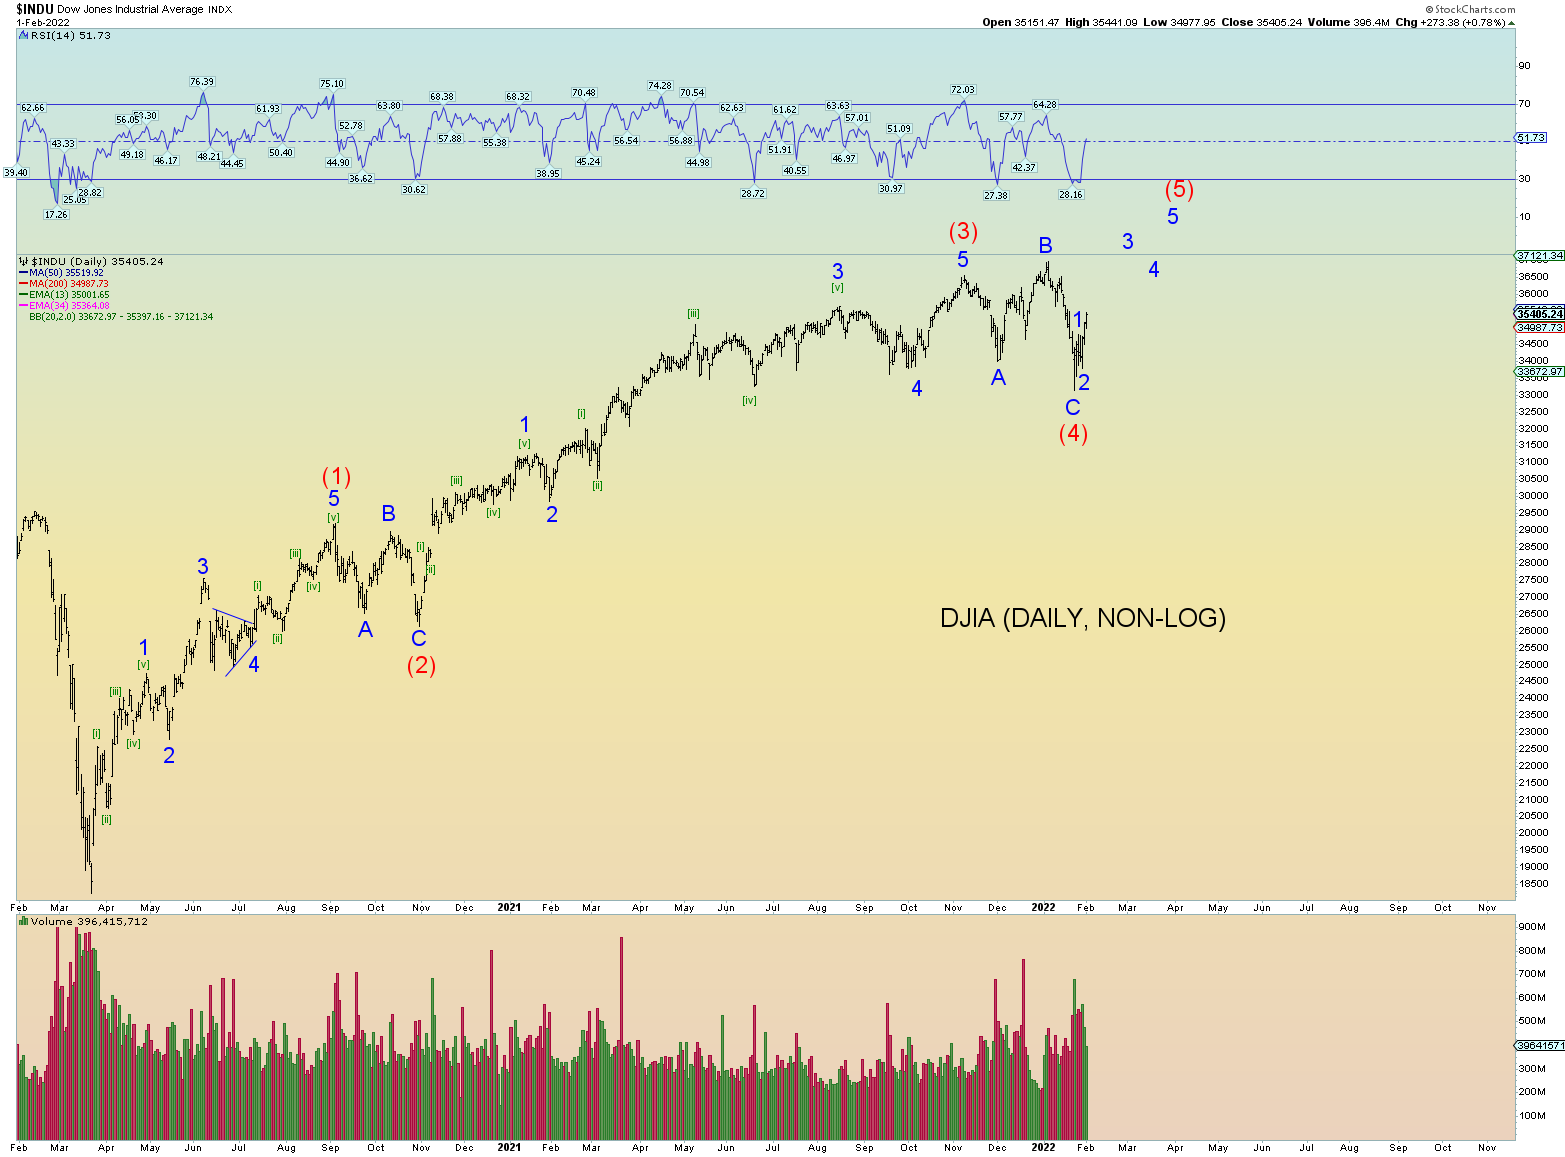
The top long-term alternate bullish count whereas some indexes achieve new all-time highs would probably be best illustrated with the DJIA and NYSE counts which for all practical purposes, are the same. Would the Wilshire achieve a new all-time high if the DJIA did? Not necessarily and probably not. The main factor in this would be “time” that the market “holds up” would be extended into Spring 2022.
There is a lot going for this Dow chart in terms of Elliott wave structure. We have (1) – (3), (2) – B of (4) meeting in parallel channel lines. Another aspect is that Intermediate wave (4) has a definite price low. In other words, it has formed a solid price marker for where to exactly mark wave (4) end point. There is nothing ambiguous about it. The same can be said actually of the SPX and Wilshire 5000 for that matter. If it is a wave (4) end point, we have the very price spot where it has occurred. And from that (4) low, it does appear a five wave move to Minor 1 of (5) has occurred. Not so much on the Wilshire 5000 though.
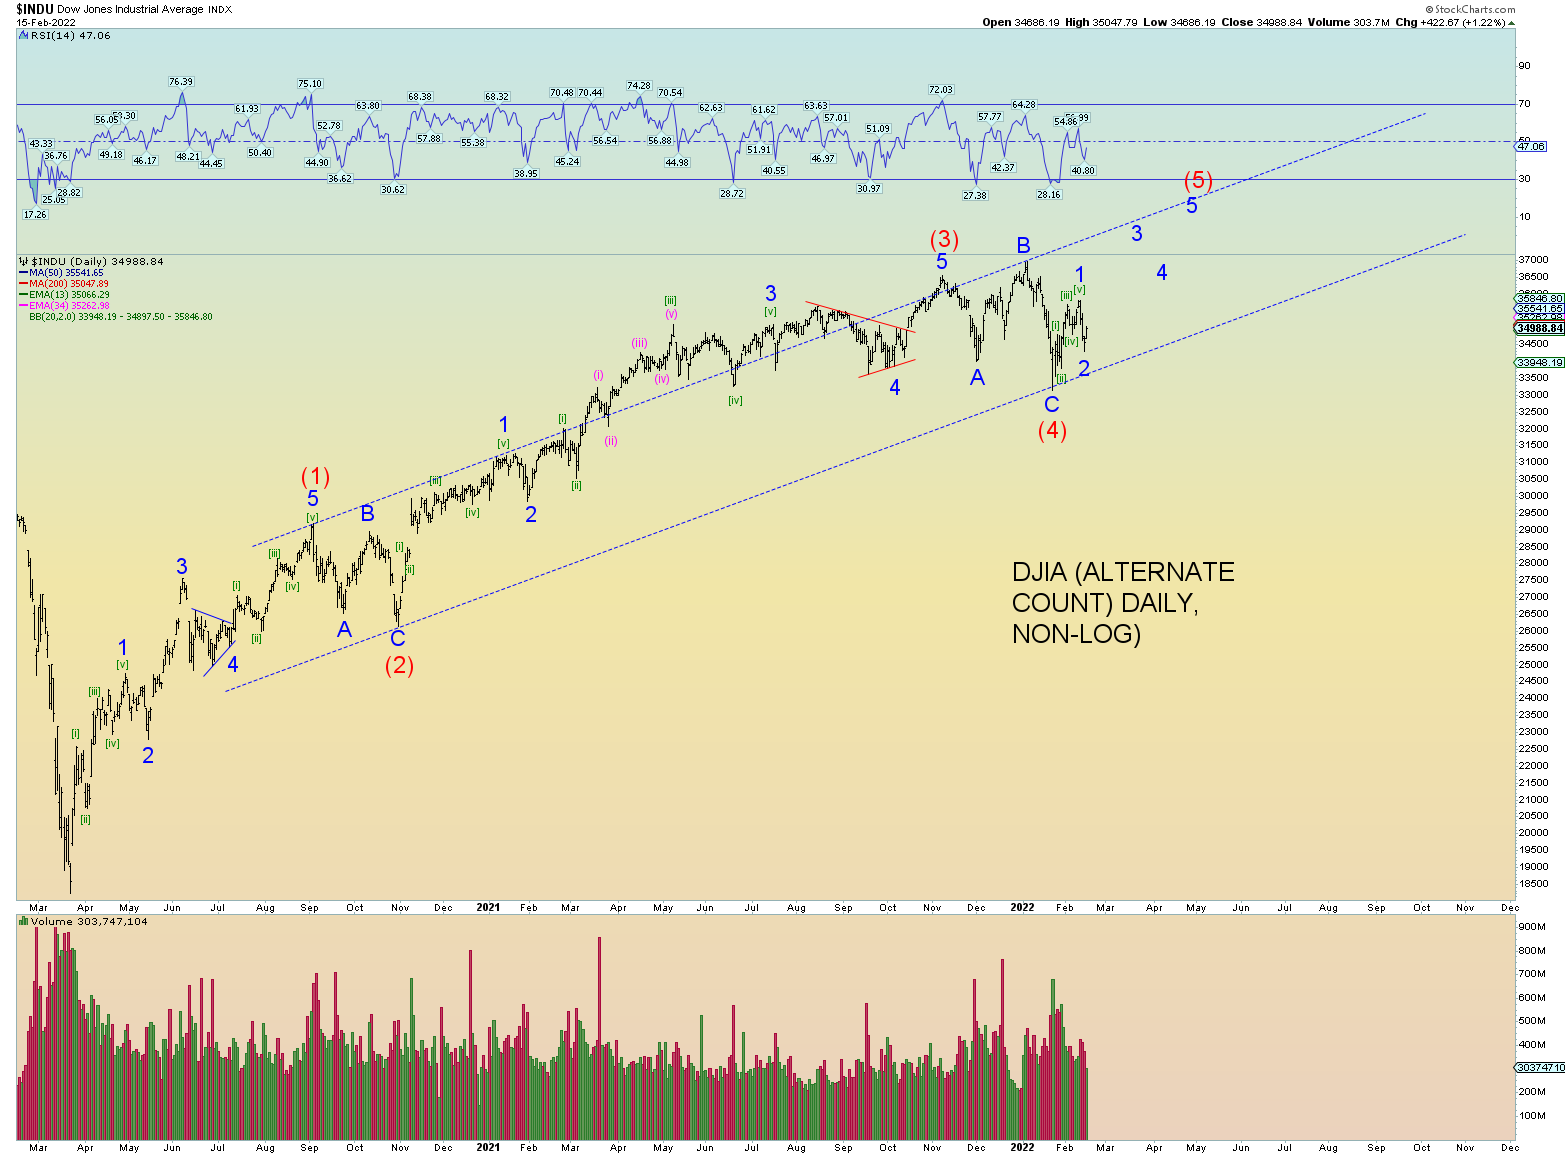
However, one reason not to get so bullish on a potential alternate count of the DJIA is that yields, and junk debt is imploding. This is not consistent with a breakout to new all-time highs. So, I remain overall bearish on the wave counts as the primary counts and also for the discussion at the beginning of this post.
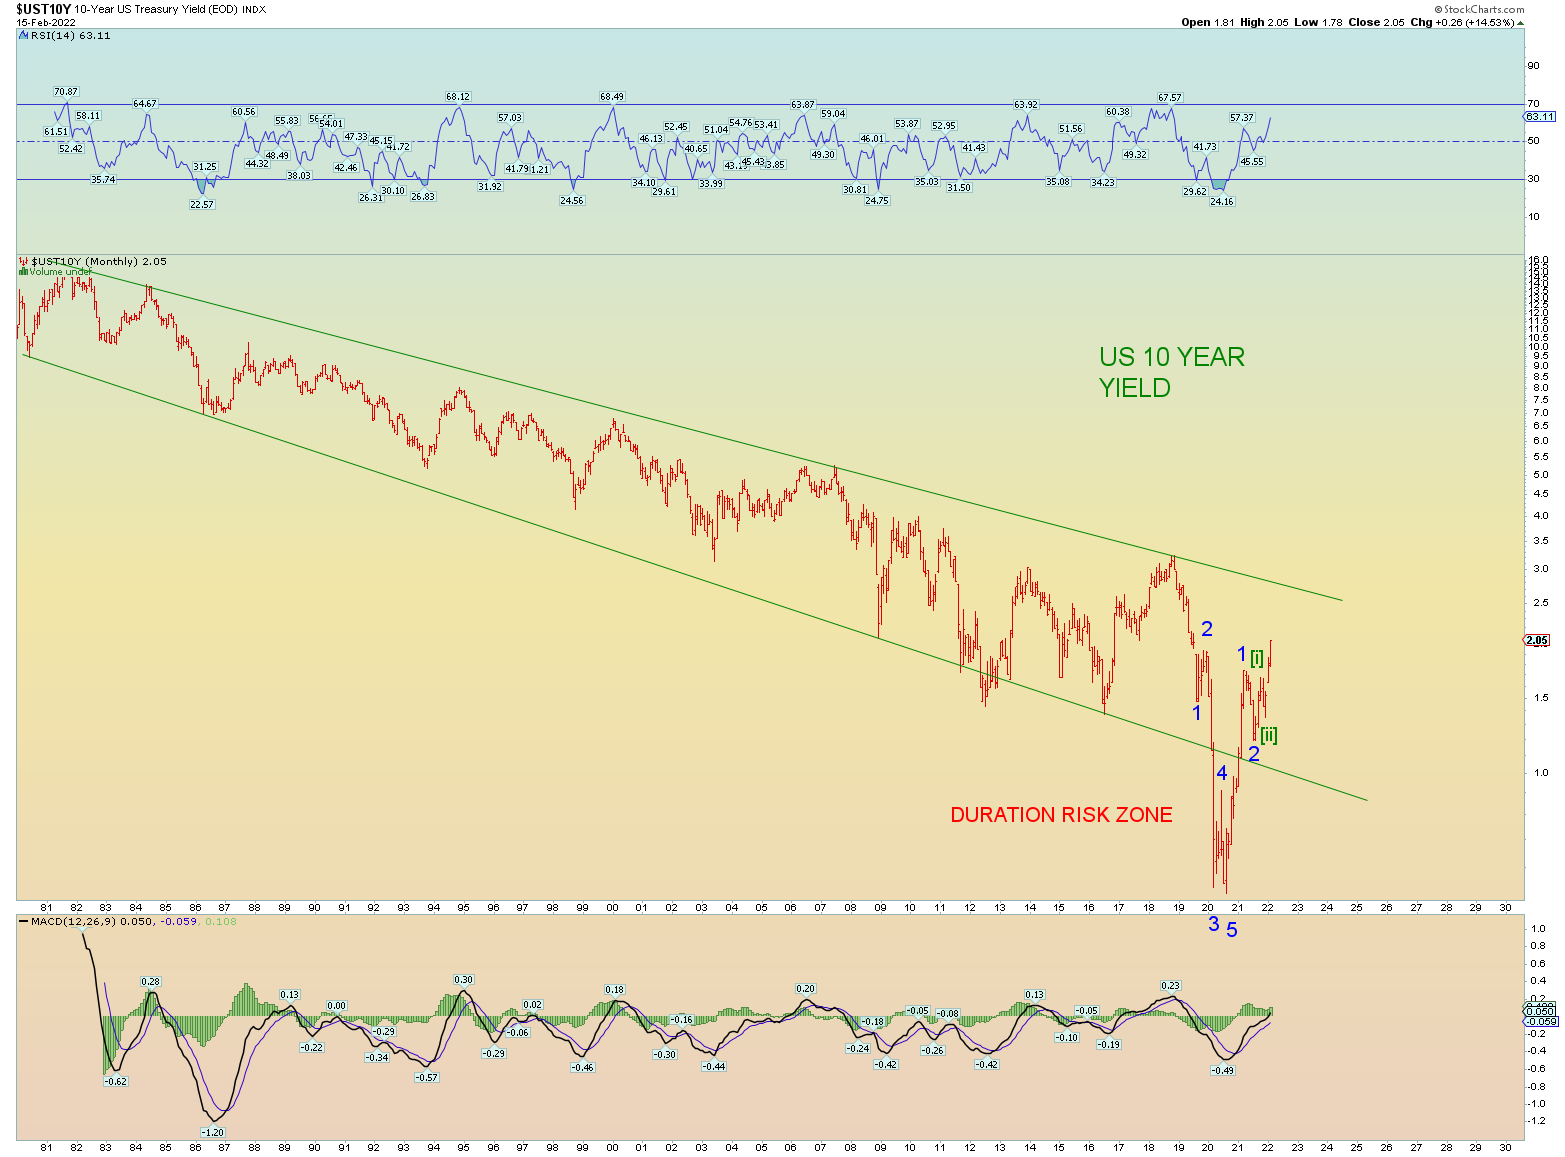
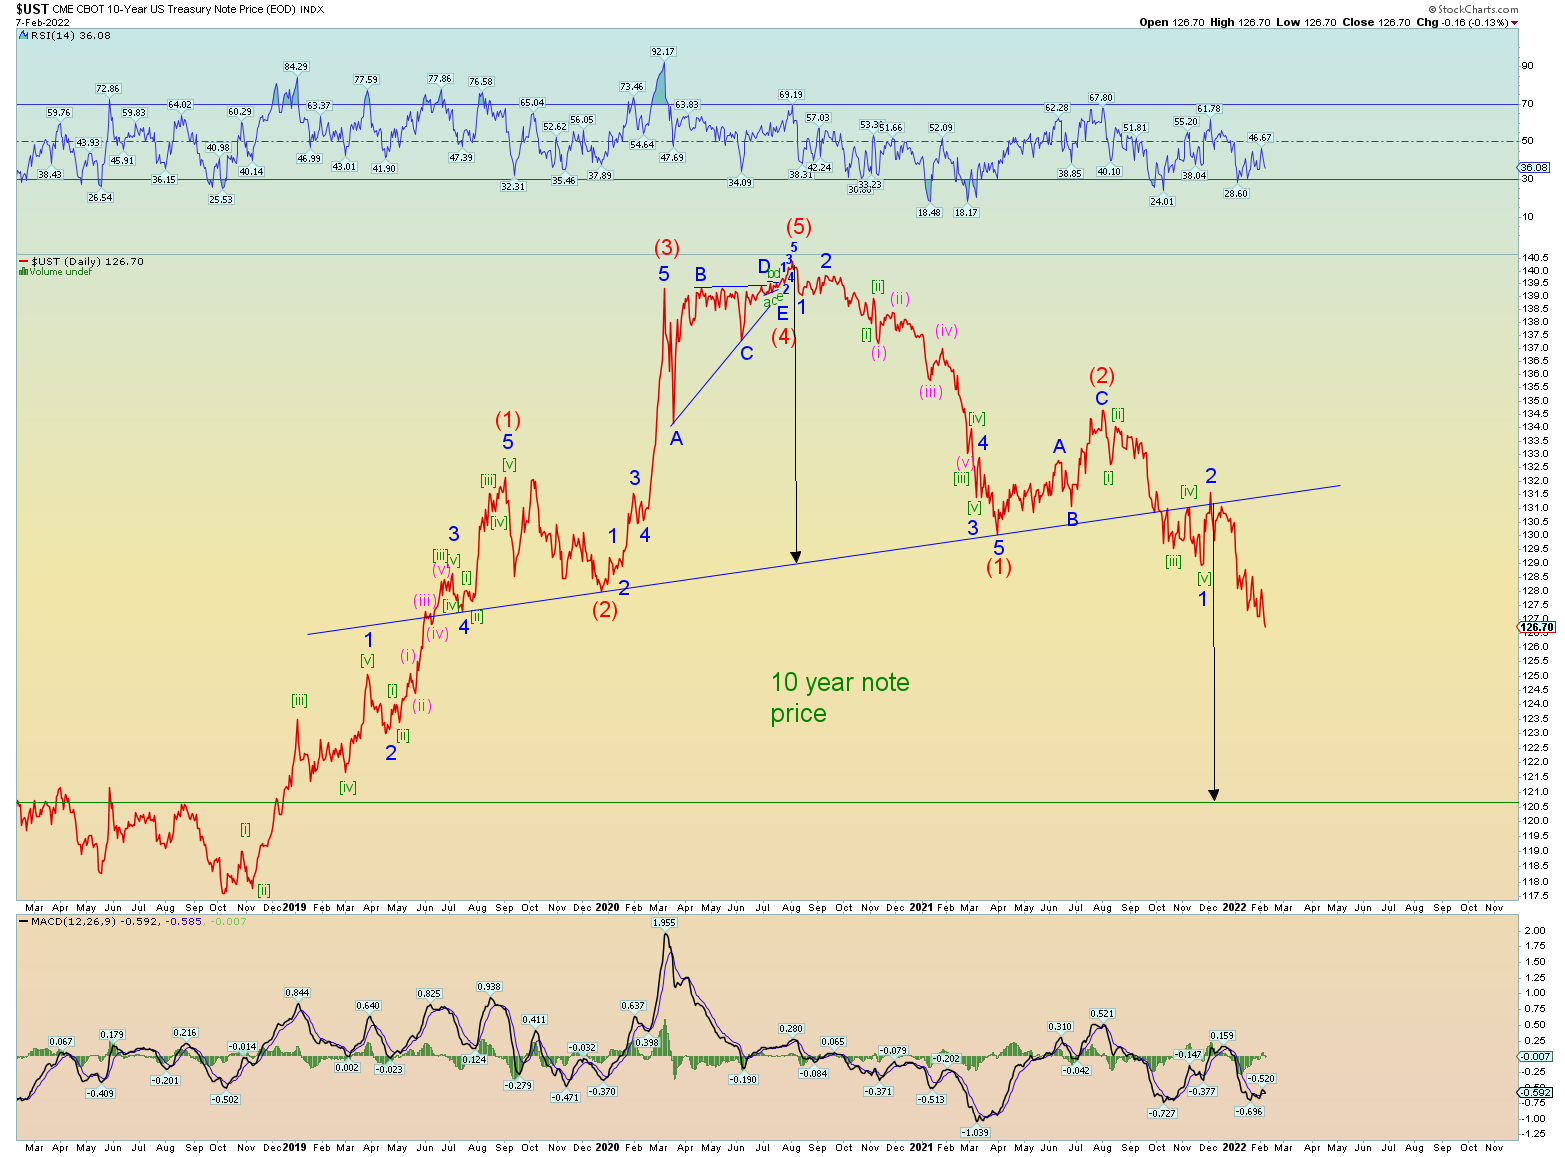
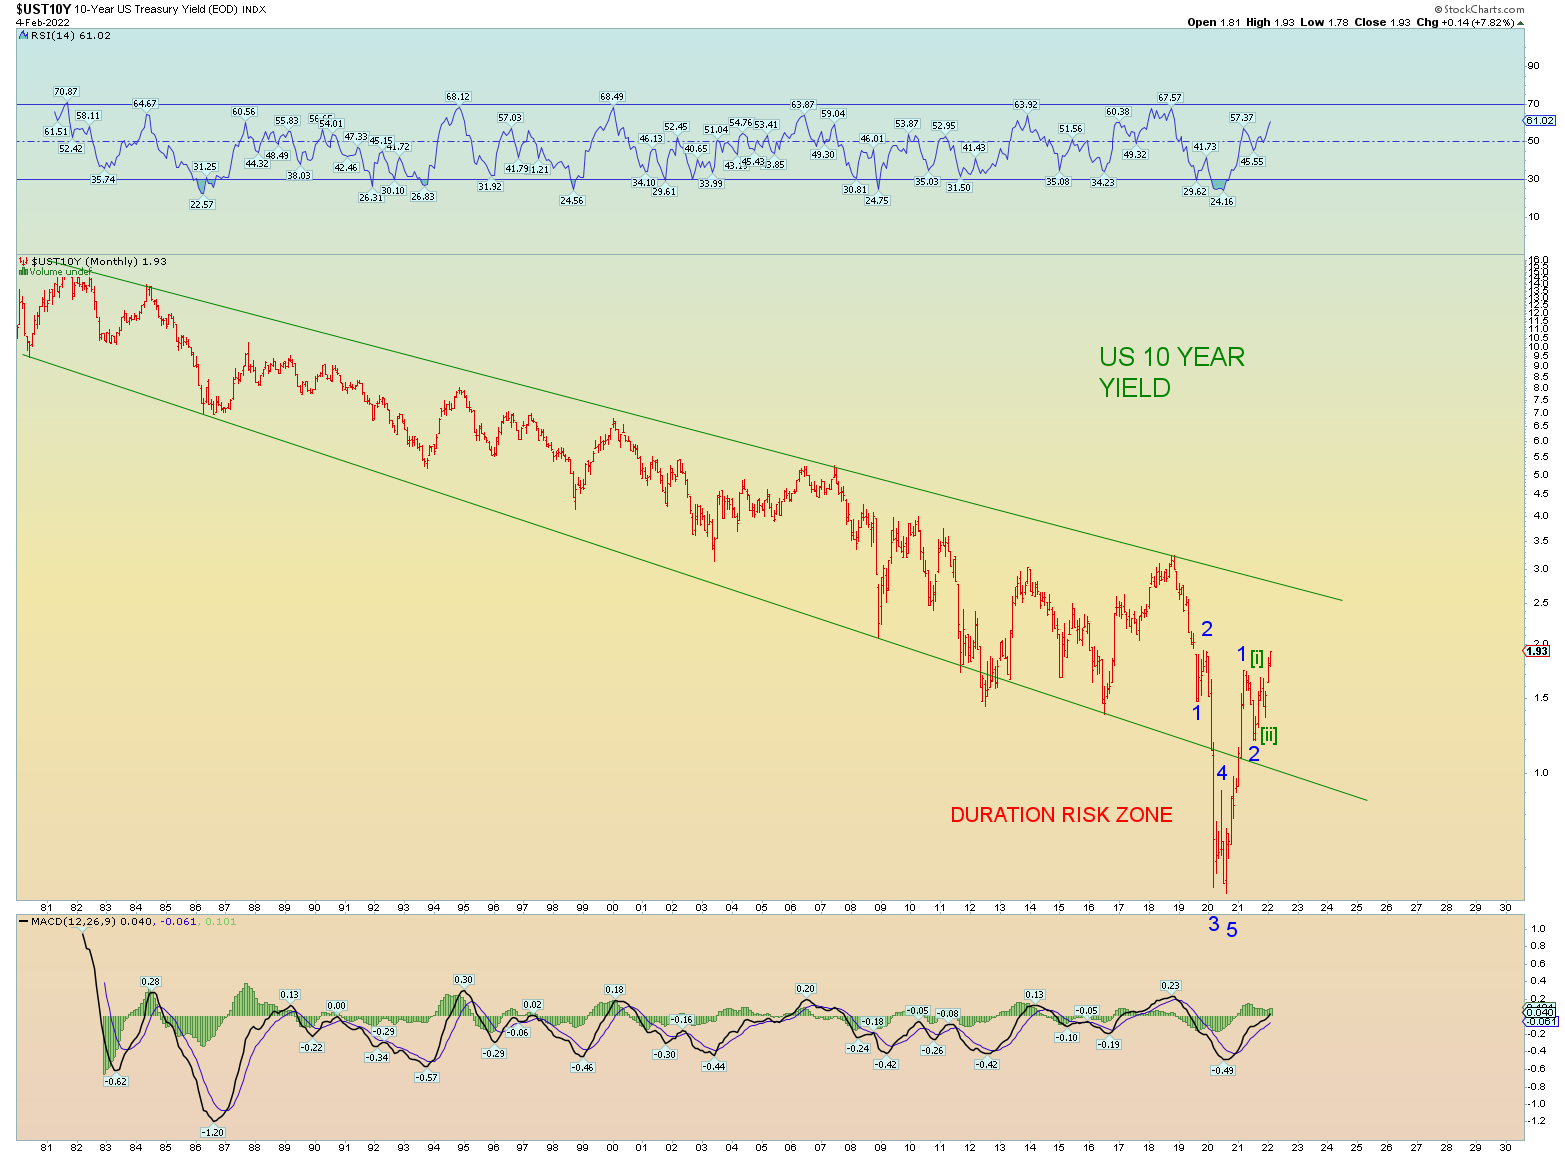
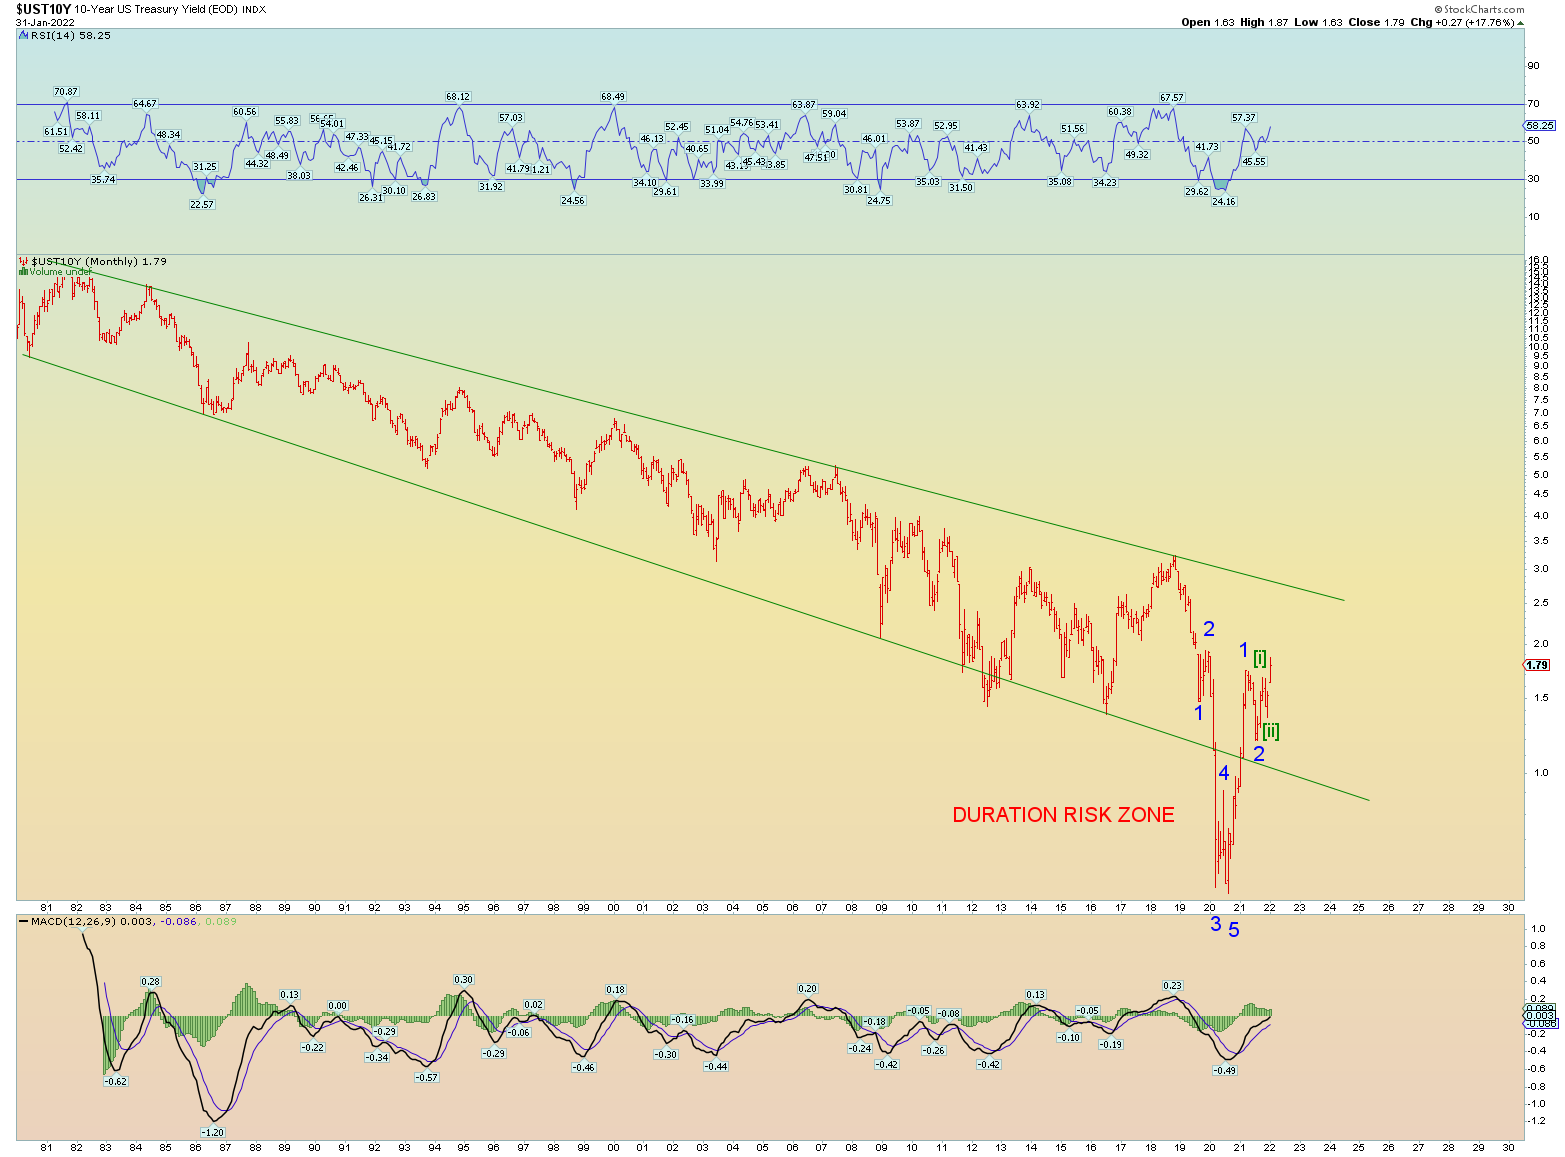
Downside price target for wave (3) on US Treasury 10-year notes.
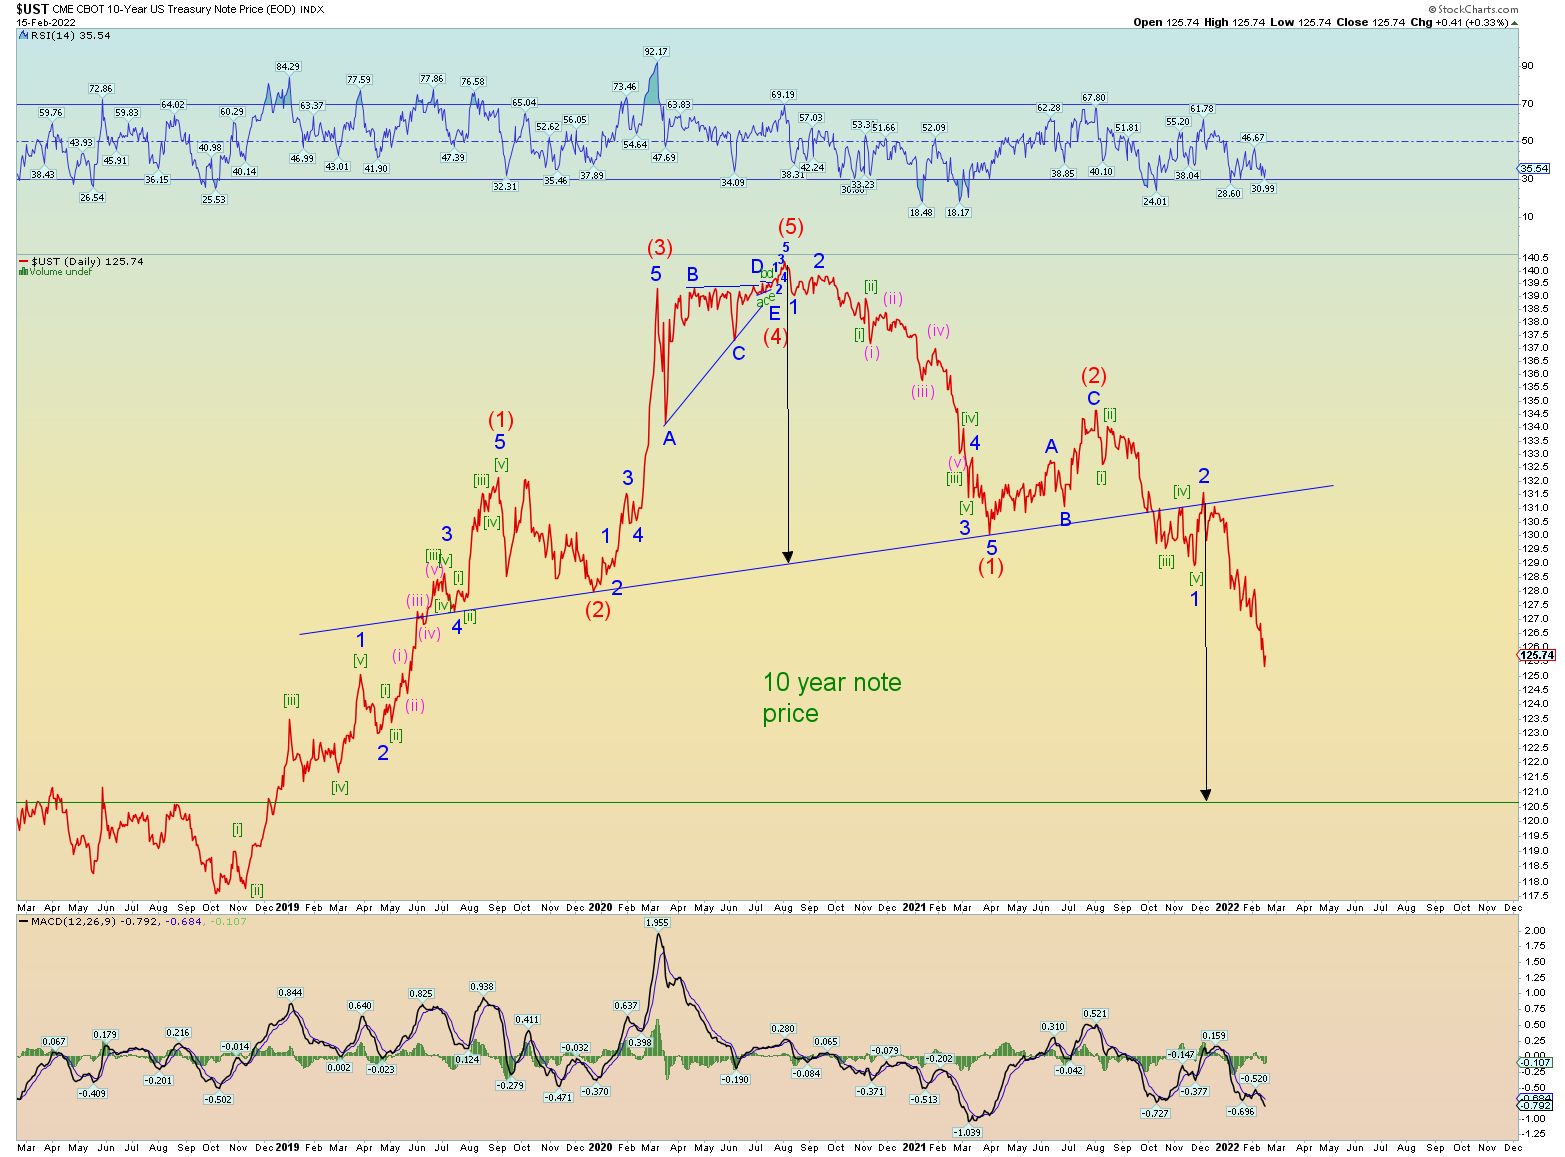
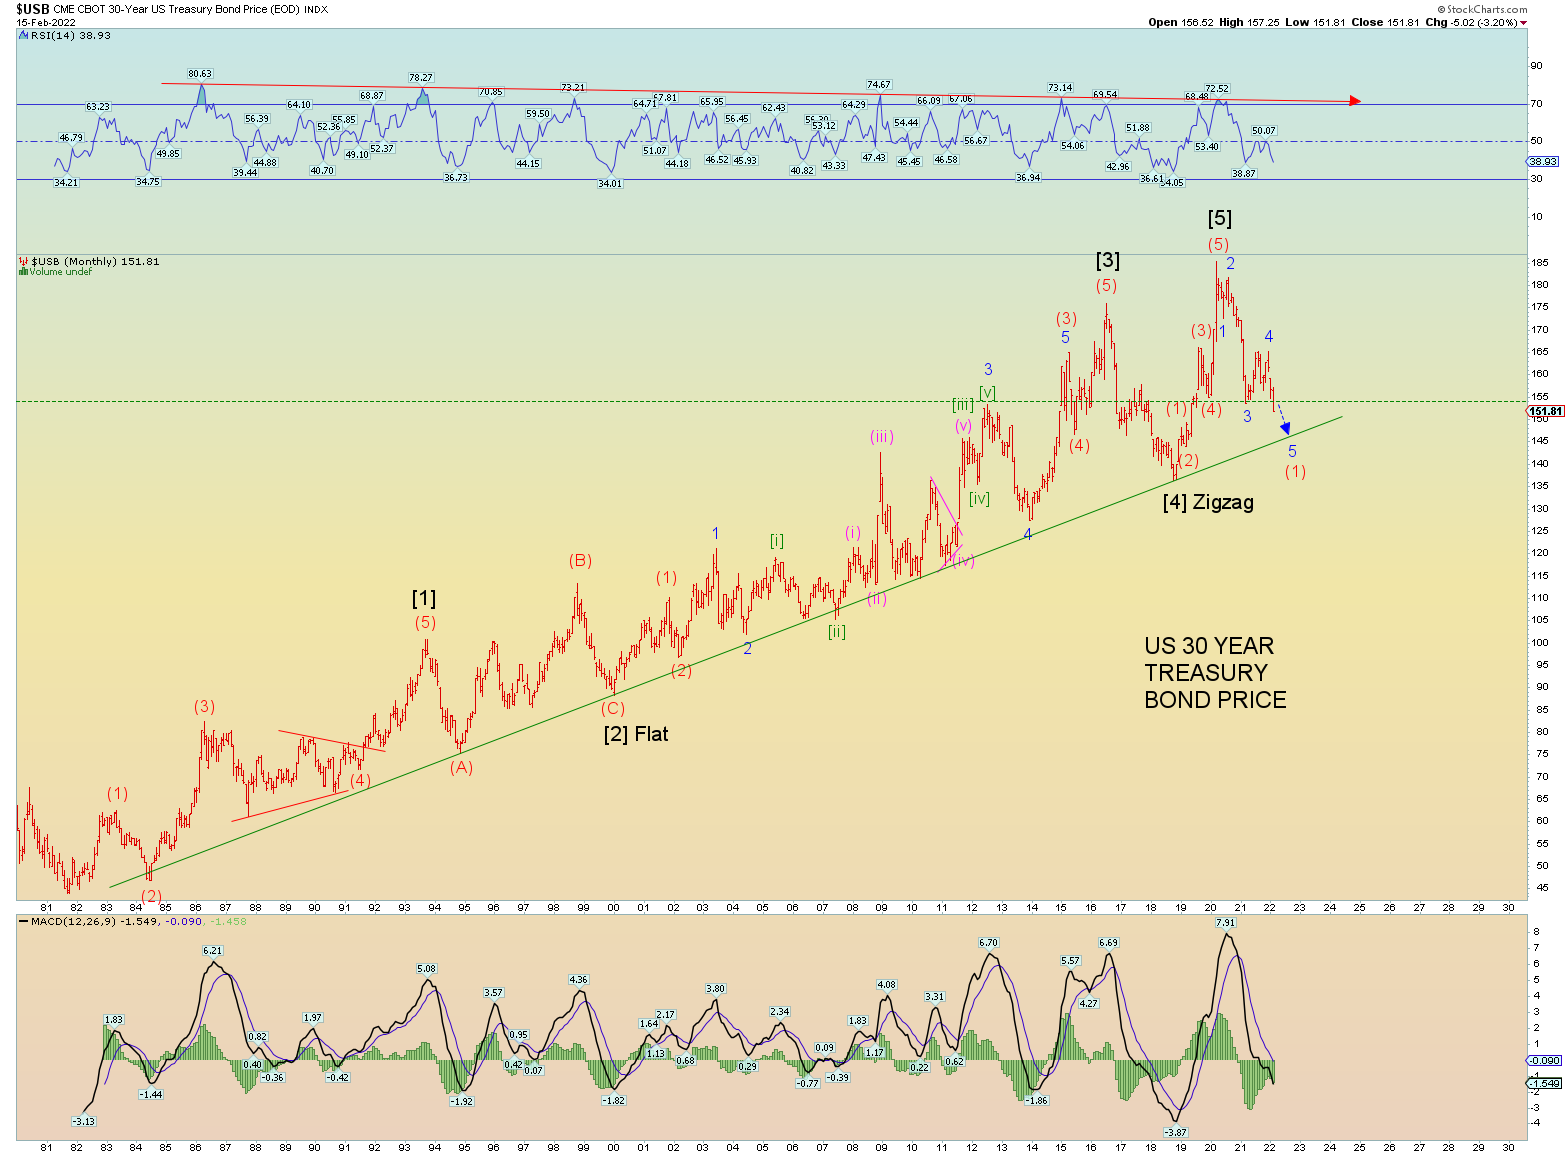
In terms of percentage, the move from the yield low of 2020 until now has been very sharp and the wave count supports even higher yields in relatively rapid succession. Before 2022 is out, I am looking for the 10-year yield to be back at 2010 levels: 3.5 or above as a minimum with the potential to be much higher. This would collapse the housing market and of course rising yields will implode the (everything) debt bomb that has been building for decades.
“That which cannot go on forever, won’t.” I don’t know who said that or if I even got the quote correct but we are nearing the end of the line for the current worldwide financial system as we know it. And we give the blokes running the world too much credit for being clever and crafty. They are not. Remember, Satanists, psychopaths and sociopaths are stupid by nature. Anyone who would willingly damn themselves for eternity by rejecting Jesus Christ as Lord and Savior is all the clue one needs.
All they are good at in the end is destruction and death. The “vaccine” campaign is proving that.
That is why once this system implodes it will take the literal – real – Antichrist to put it back together again. And in that he will seemingly succeed albeit only for a brief time.
Working a little bit lower today.
The market is getting quite ahead of the FED. It’s hilarious.
COVID MADNESS COMMENTARY
The vaccine “narrative” is slowly losing momentum worldwide. I had thought over a year ago that the obvious injuries and deaths from it would waken people up very quickly to the worldwide genocide that was occurring, but I was wrong. People were quick to bury their heads in the sand to deny the obvious. It’s like the stolen 2020 election. You’re an idiot if you 1) believe Biden won fair and square 2) the vaccine is “good” for humanity. But whatever. And if you think the Ponzi worldwide financial system will continue forever then you also probably are pro-vax and anti-Christian. An unthinking NPC.
THE COUNTS
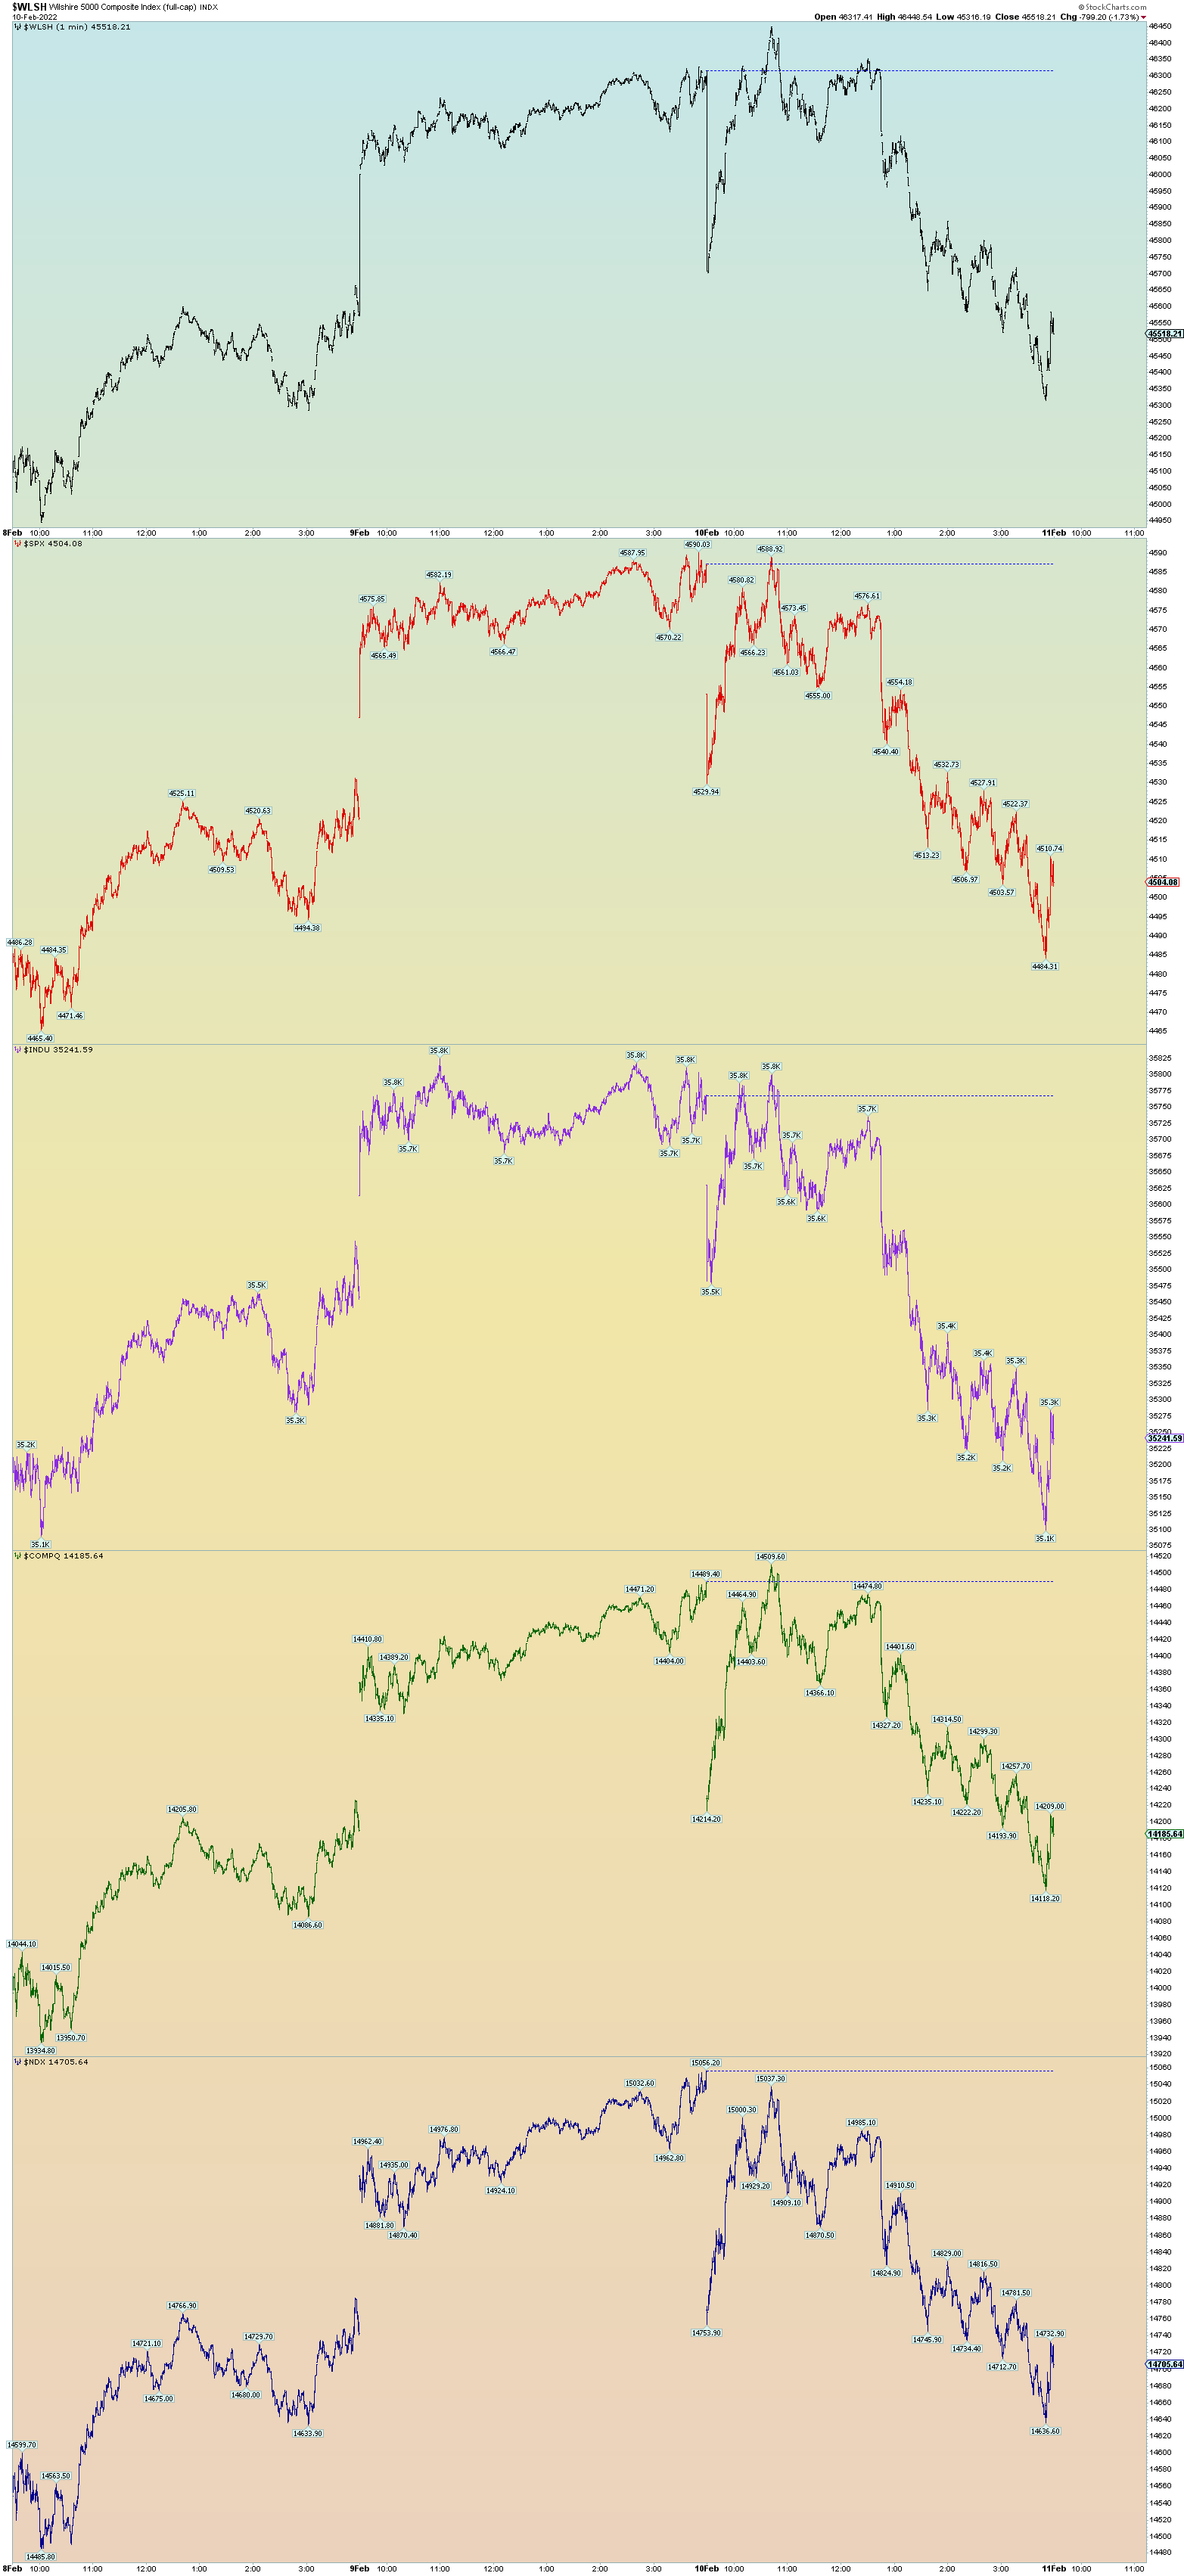
Big gap cover price moves today. First the SPX gap up from yesterday was covered in the down open and then a furious rally and the gap down was covered. And then steady selling which kind of tells the overall bearish outlook story. All the indices were in agreement.
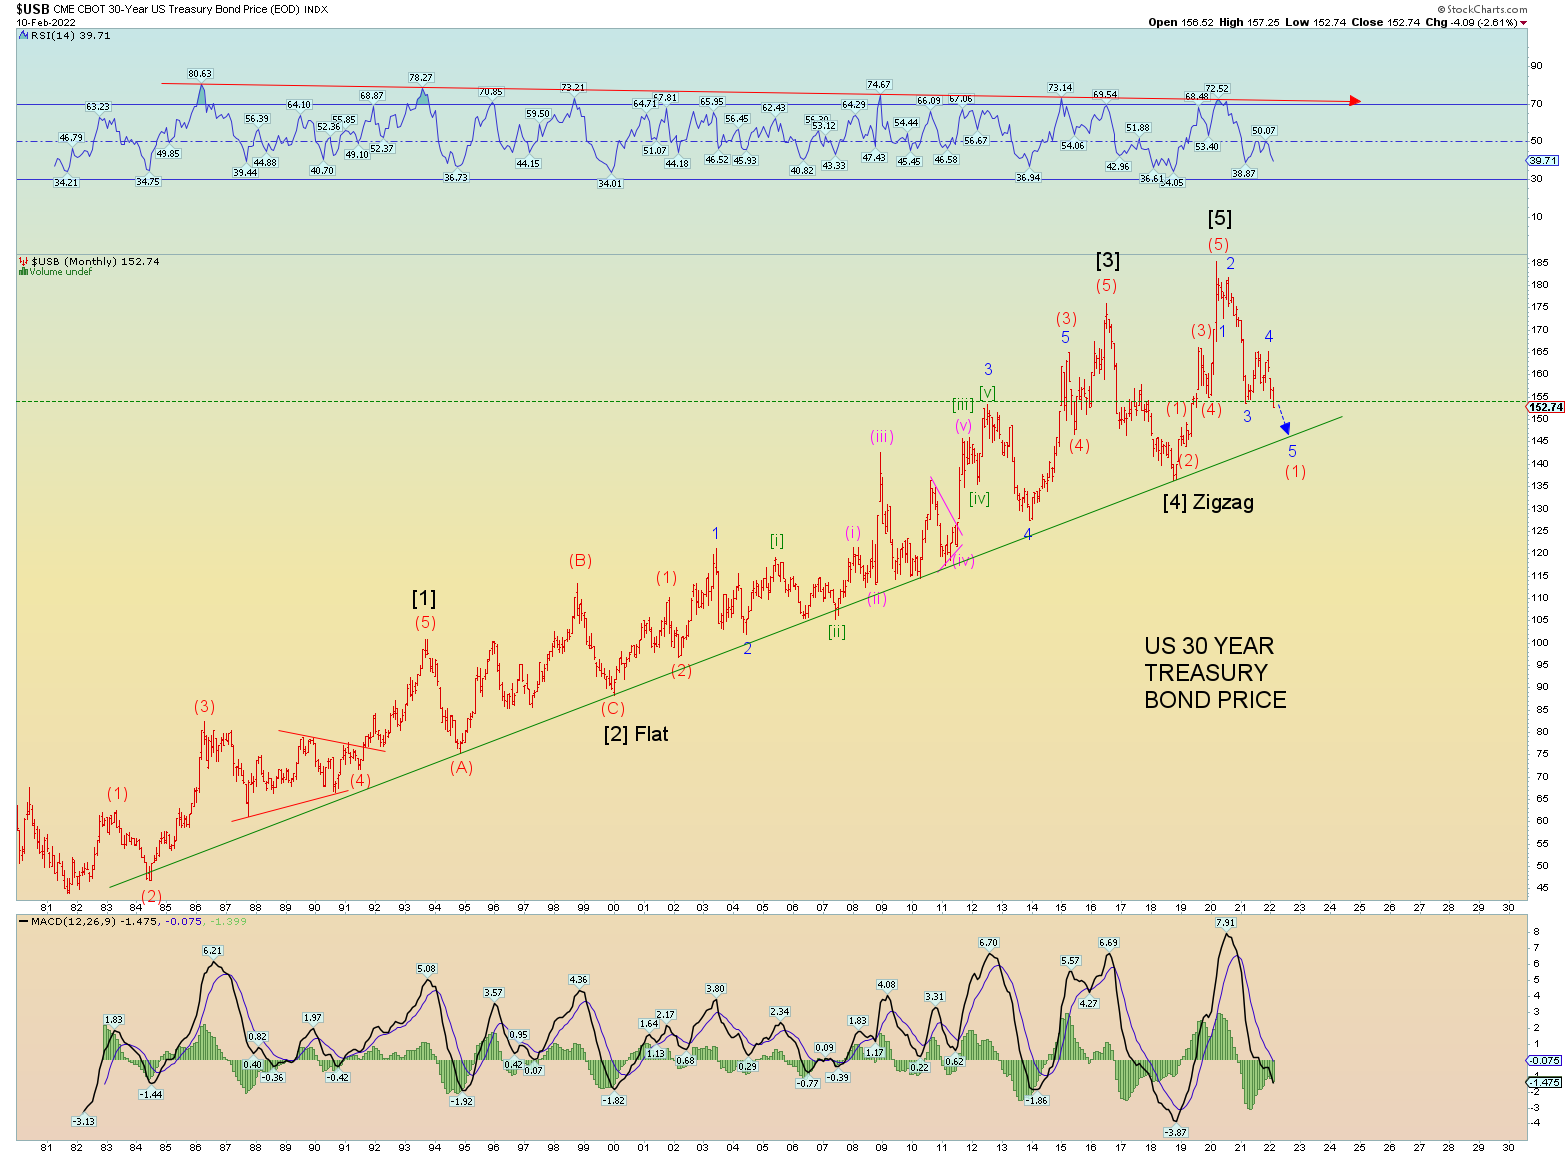
New price low on the 30-year bond confirms the long-term impulse down wave pattern.
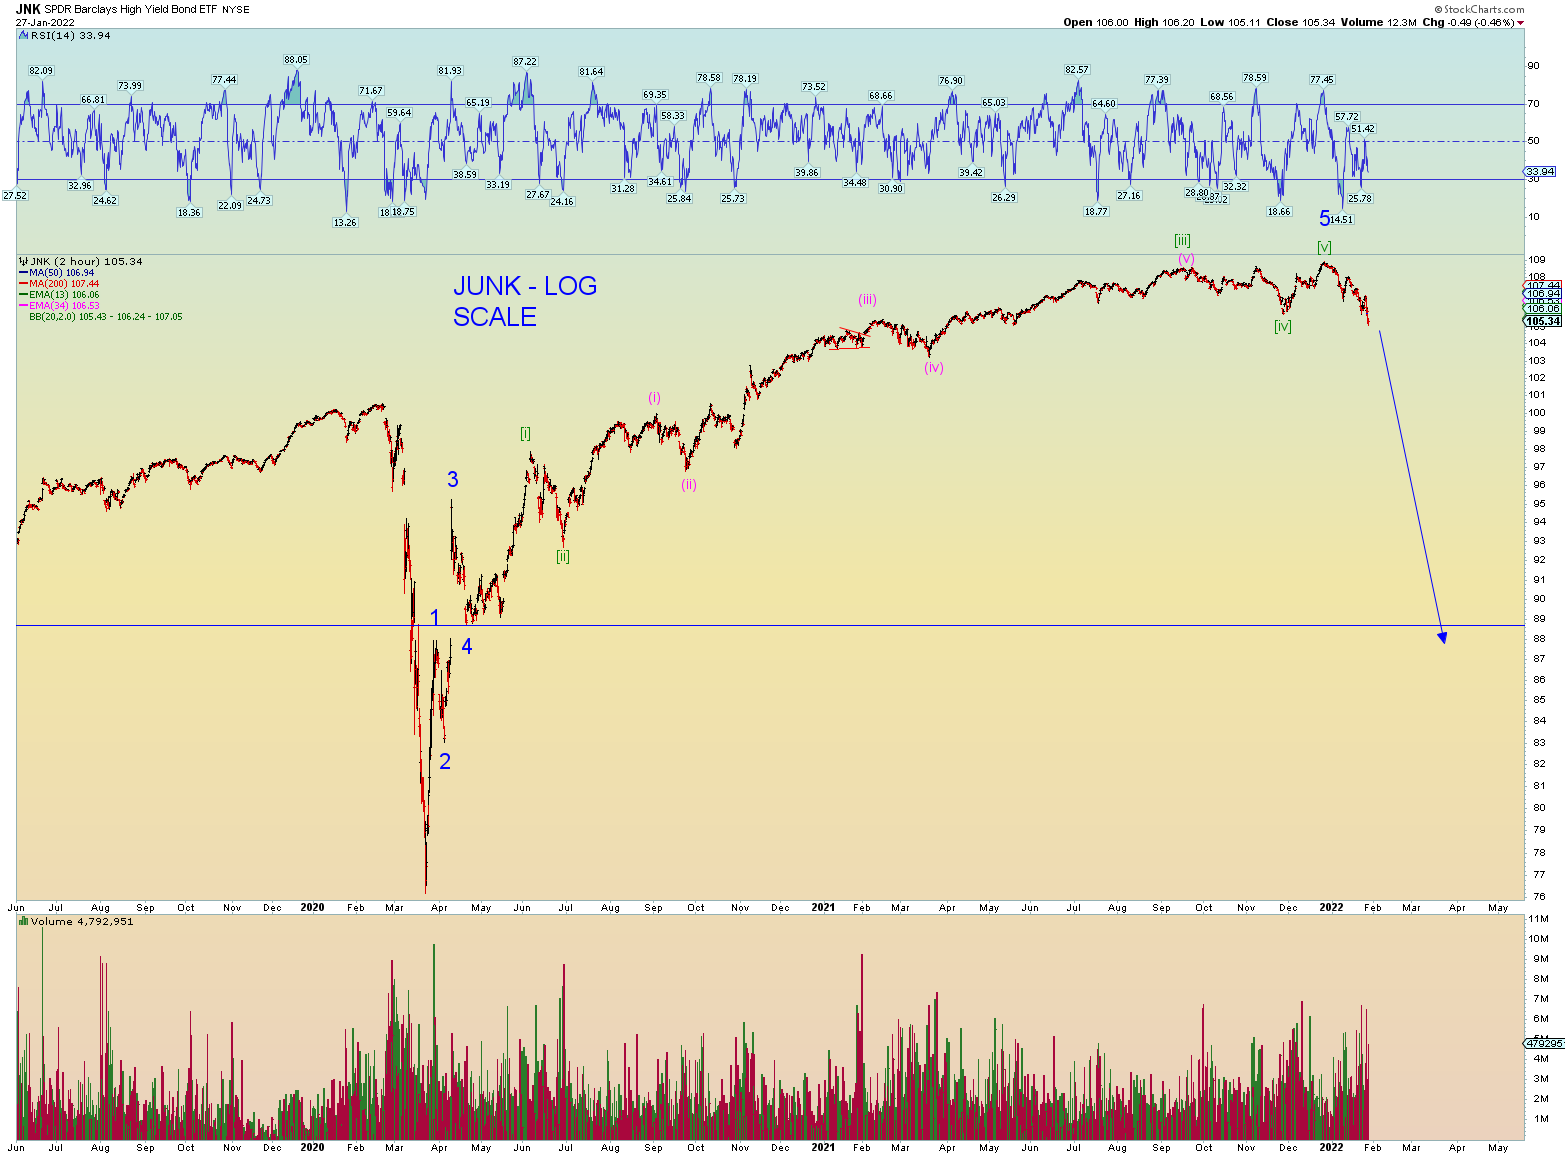
JUNK leading the way.
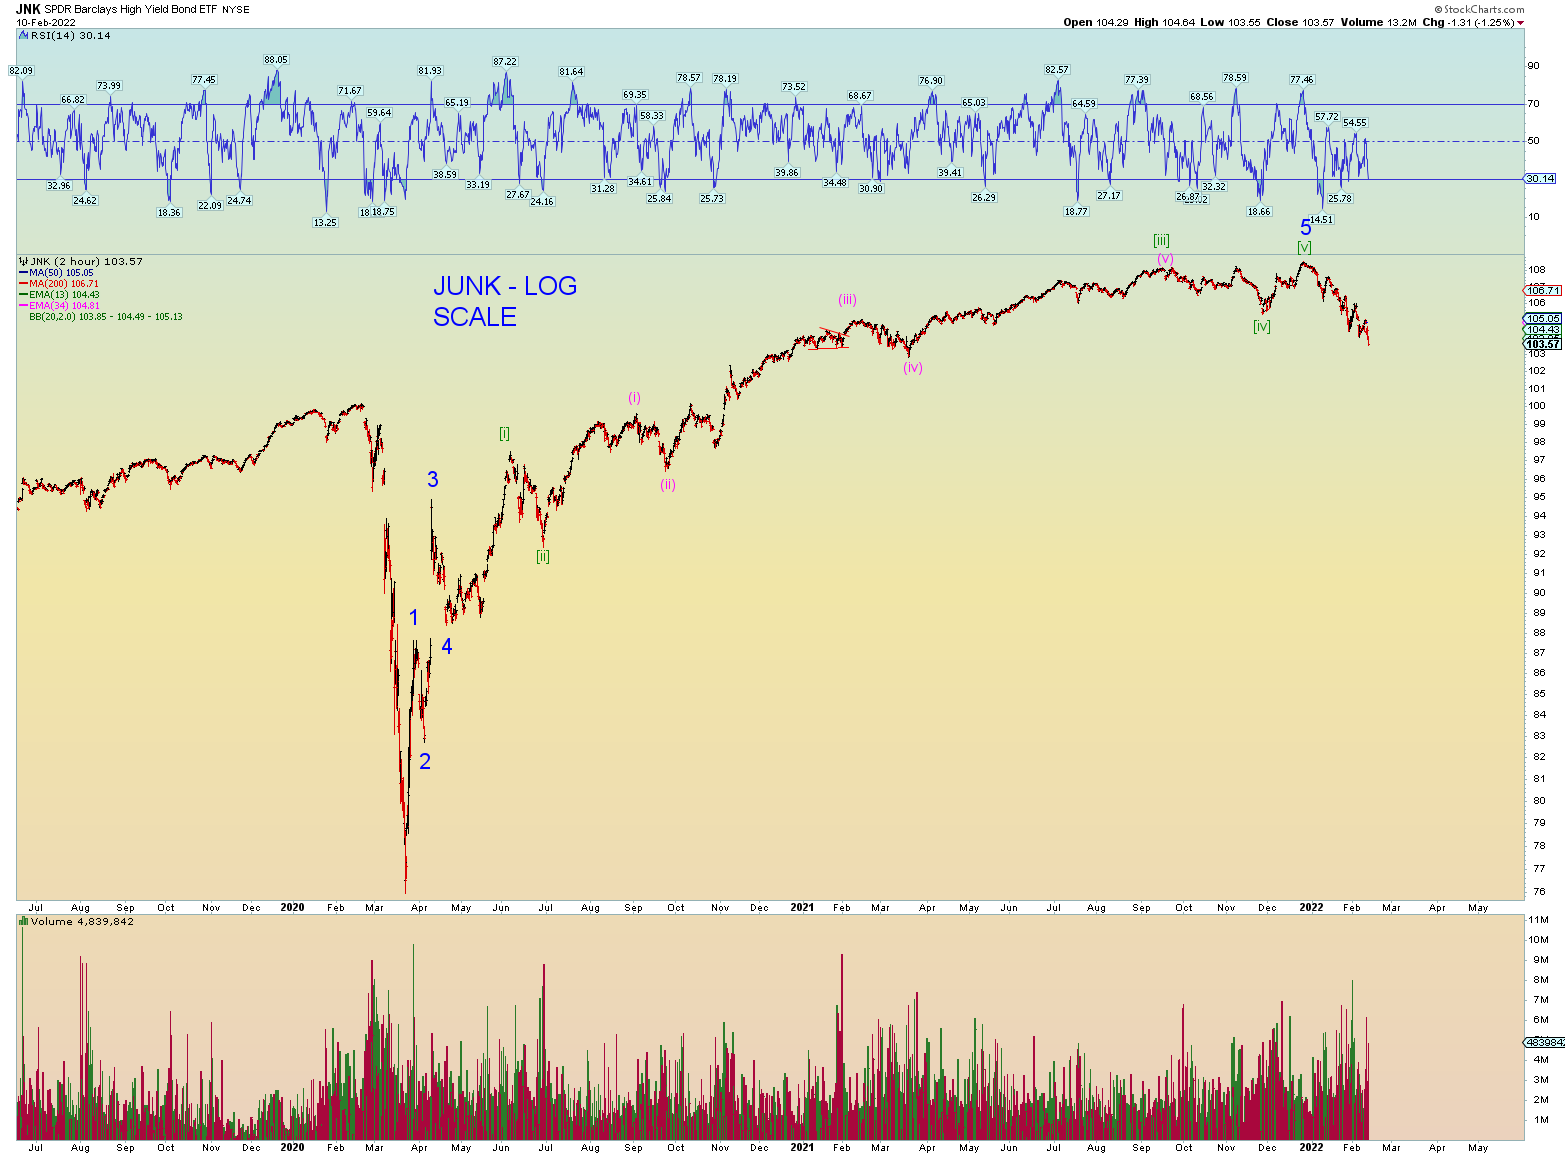
The 233-year Grand Supercycle wave will not rollover easy. But rolling over is still the best count.
The NYSE and Global DOW is well positioned to make a possible new high. The DJIA is not looking too bad either.
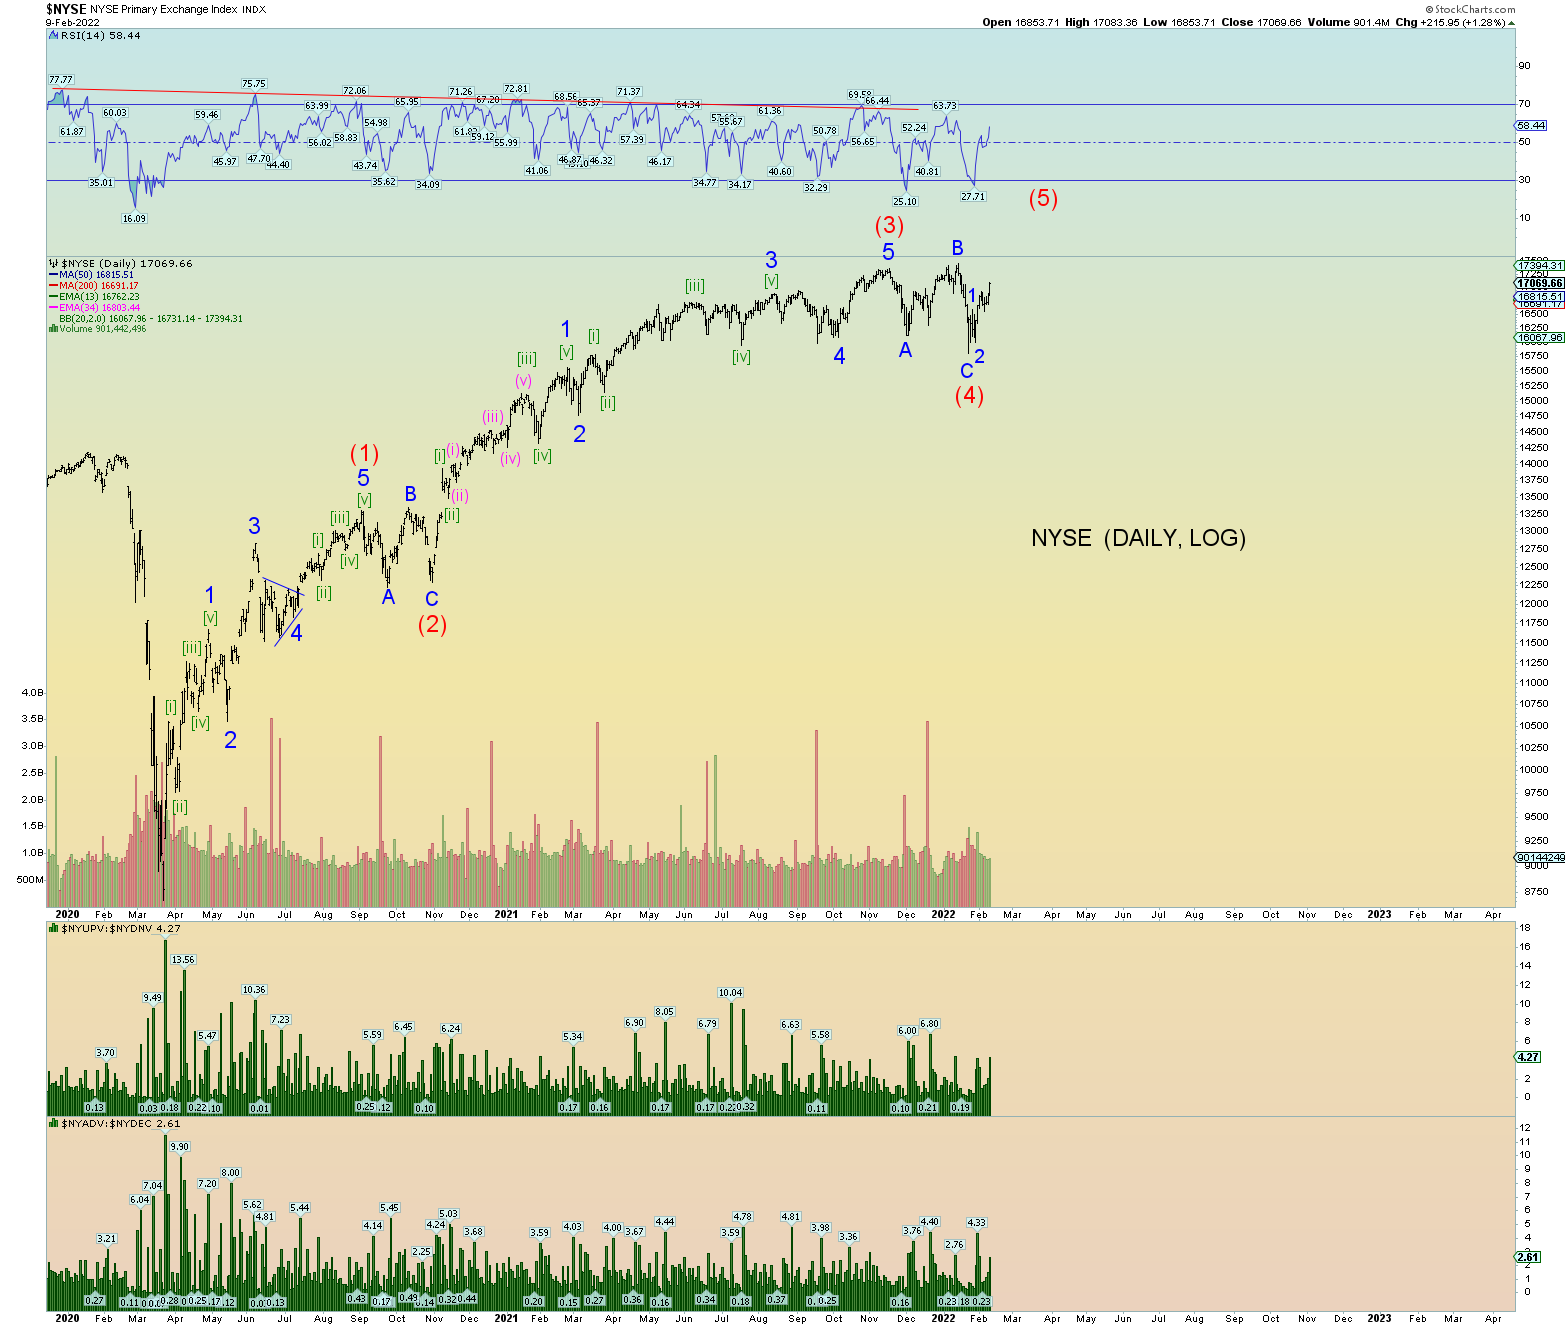
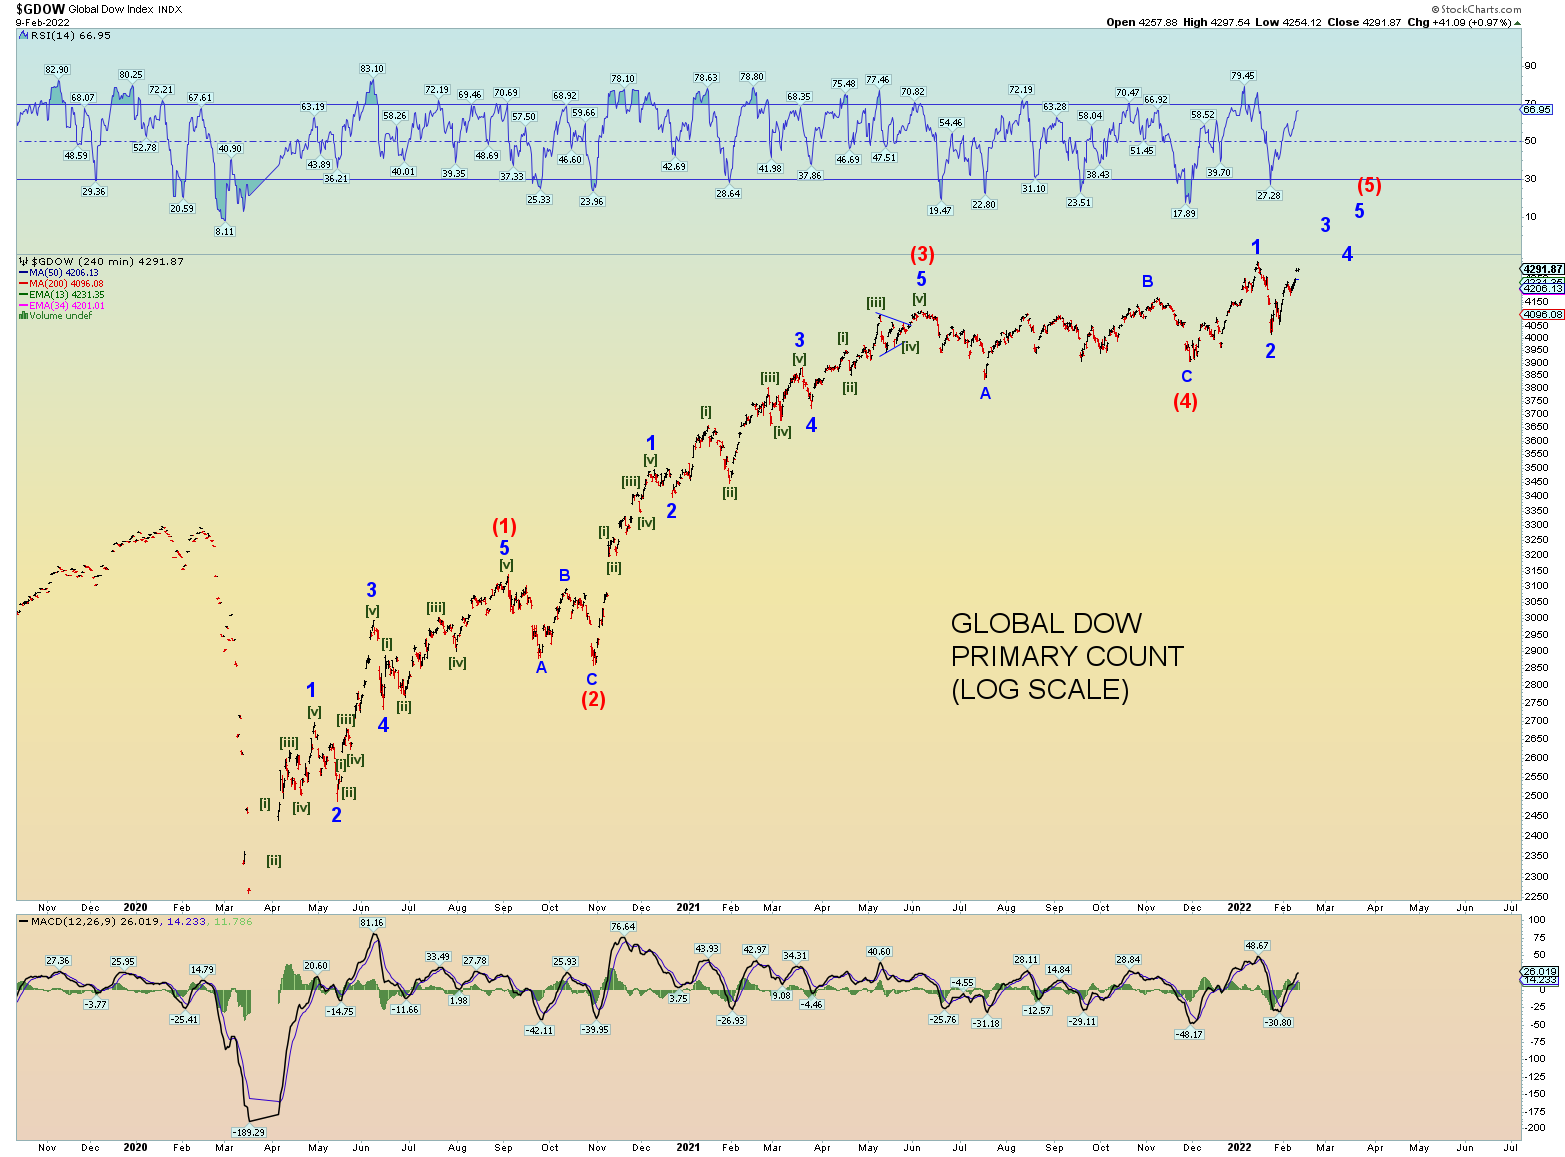
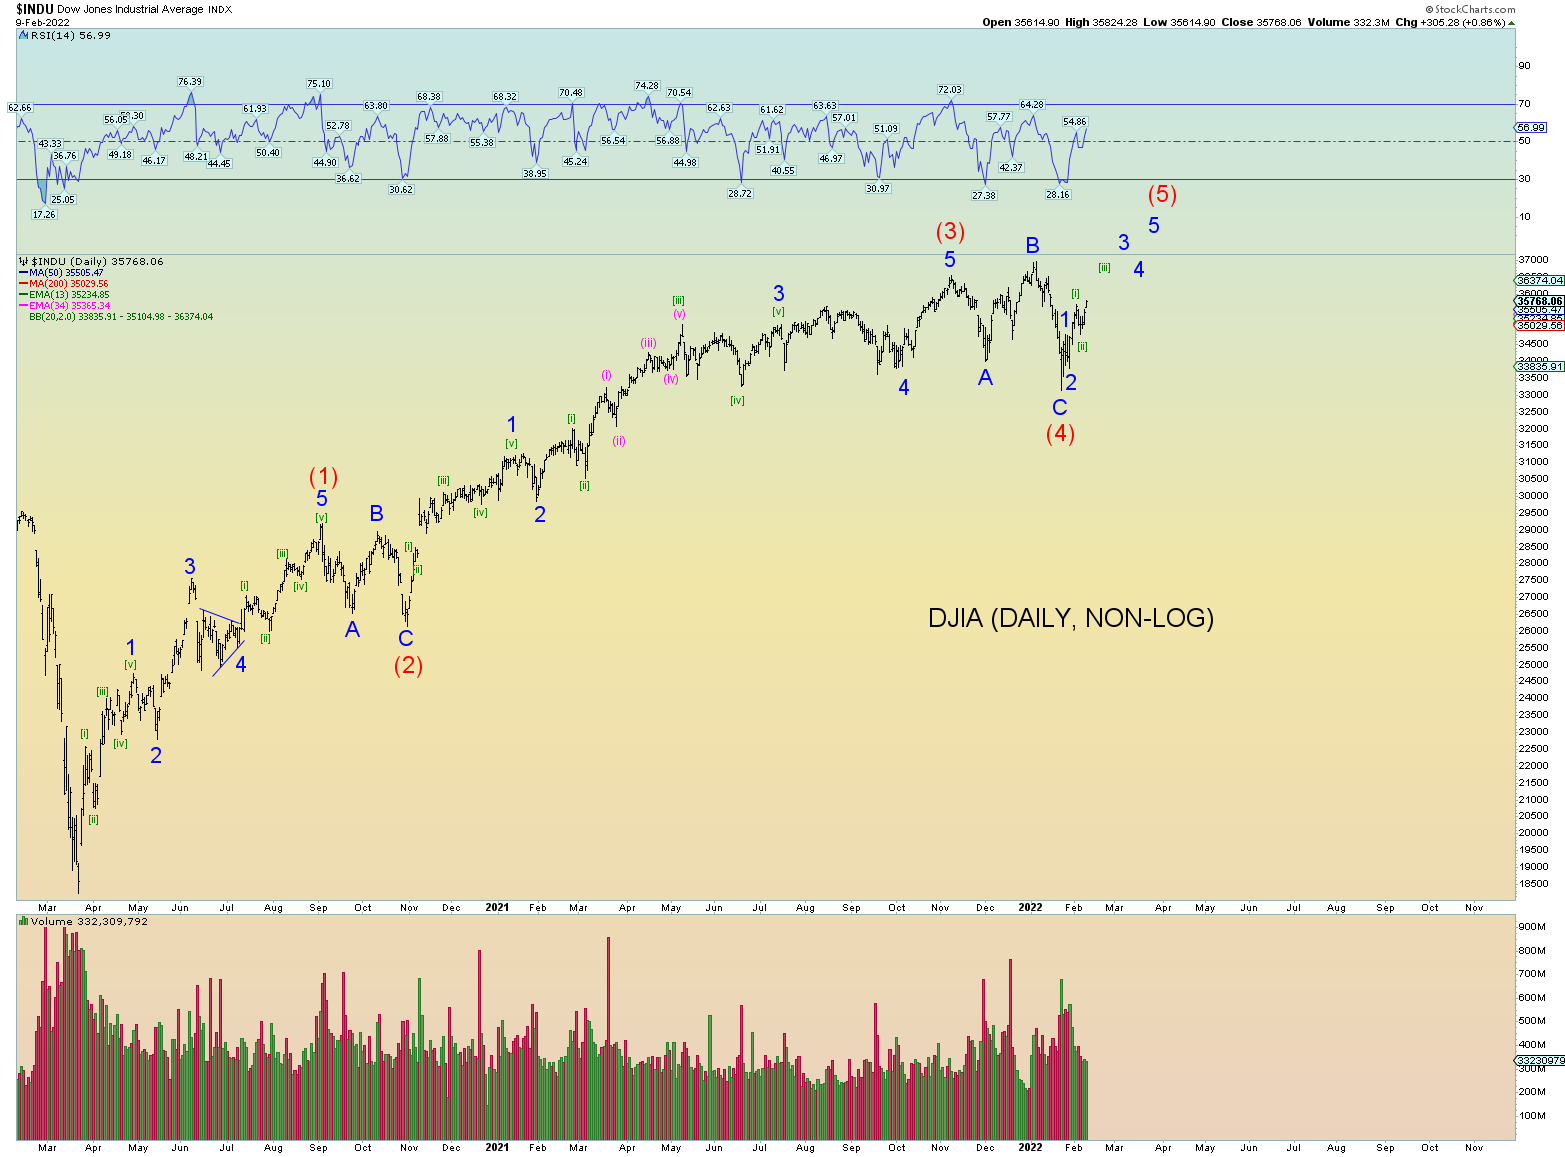
The NASDAQ Composite is still about 10% from its peak. The S&P500 would come close to making a new all-time high if we continue to chug upwards.
I would think any new high in the DOW and or NYSE would result in a fractured topping process whereas the Composite and Wilshire 5000 do not make a new high. The S&P 500 would probably make it.
I am projecting ahead obviously since today was internally a strong up day on the NYSE. However, the Wilshire 5000’s pattern says it all. Prices could be merely backtesting the broken neckline as was talked about a few posts ago. So, we shall see.
Last Thursday had what appears is a misprint on the Wilshire 5000. I don’t understand it, it happens every blue moon or so. The spike down I think is false.
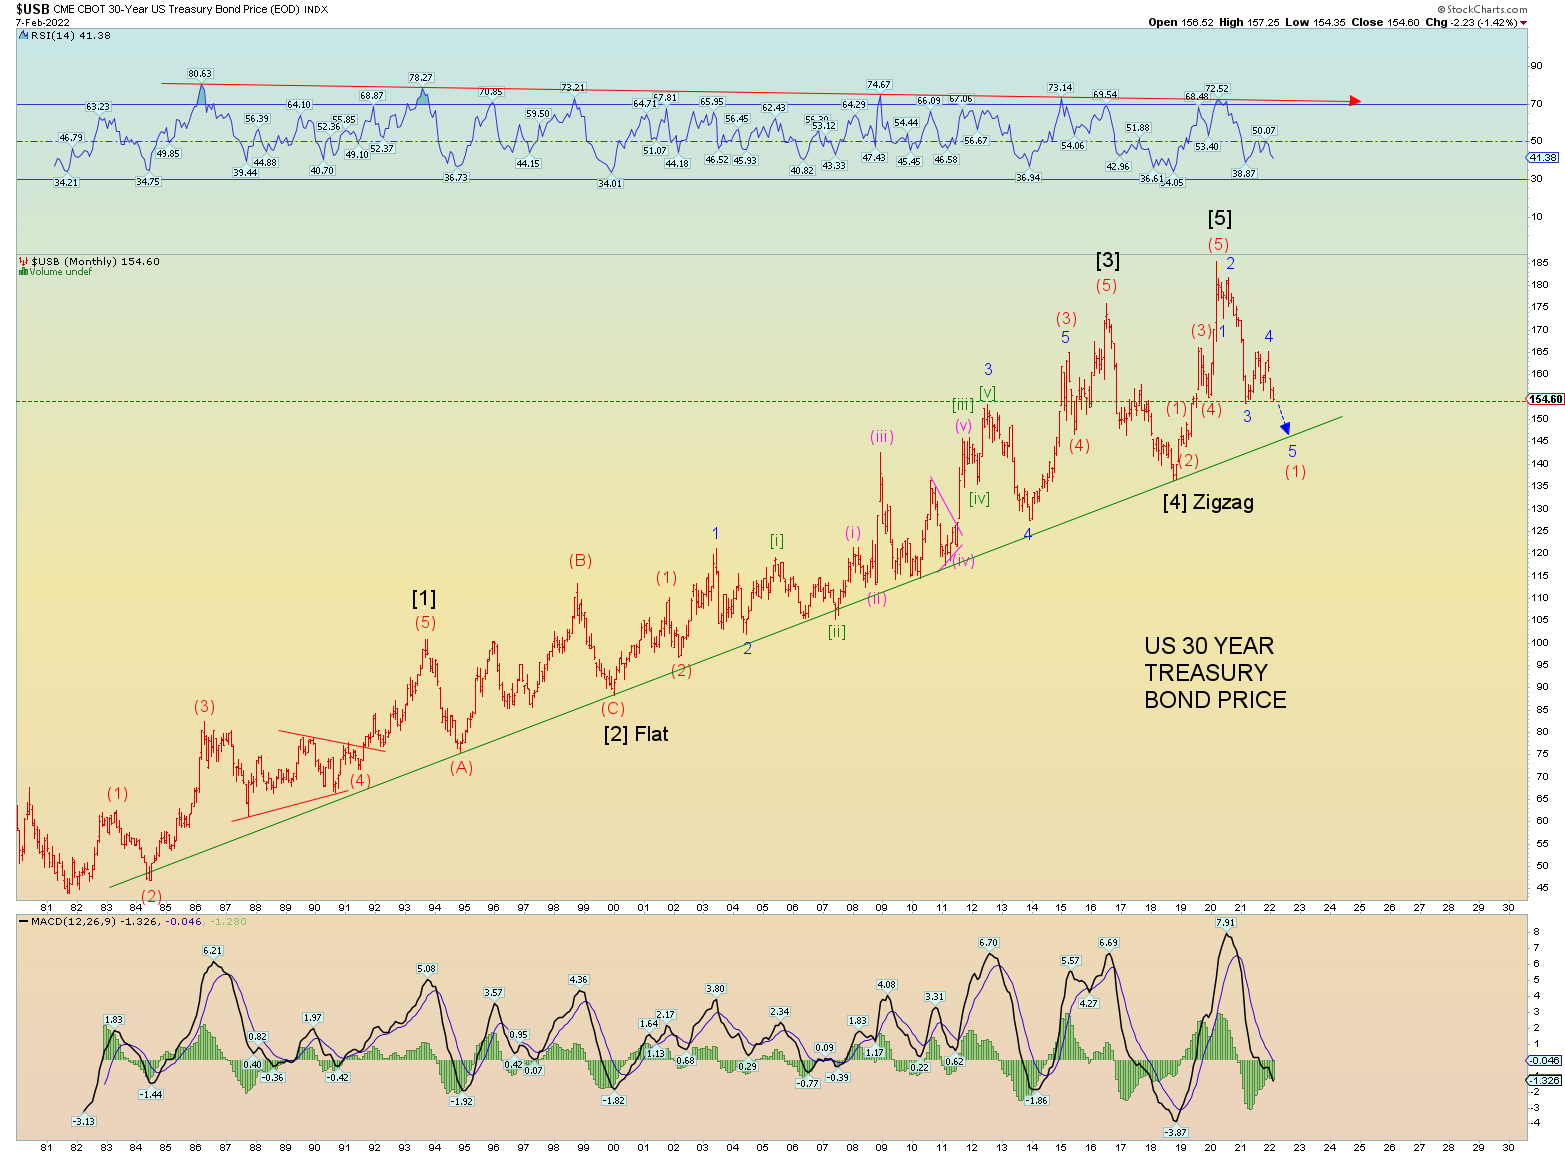
Worldwide bond update. 30-year bond at horizontal support. Expect a move back to the long term trendline support.
10 Year price head and shoulder pattern broken. Downside target shown.
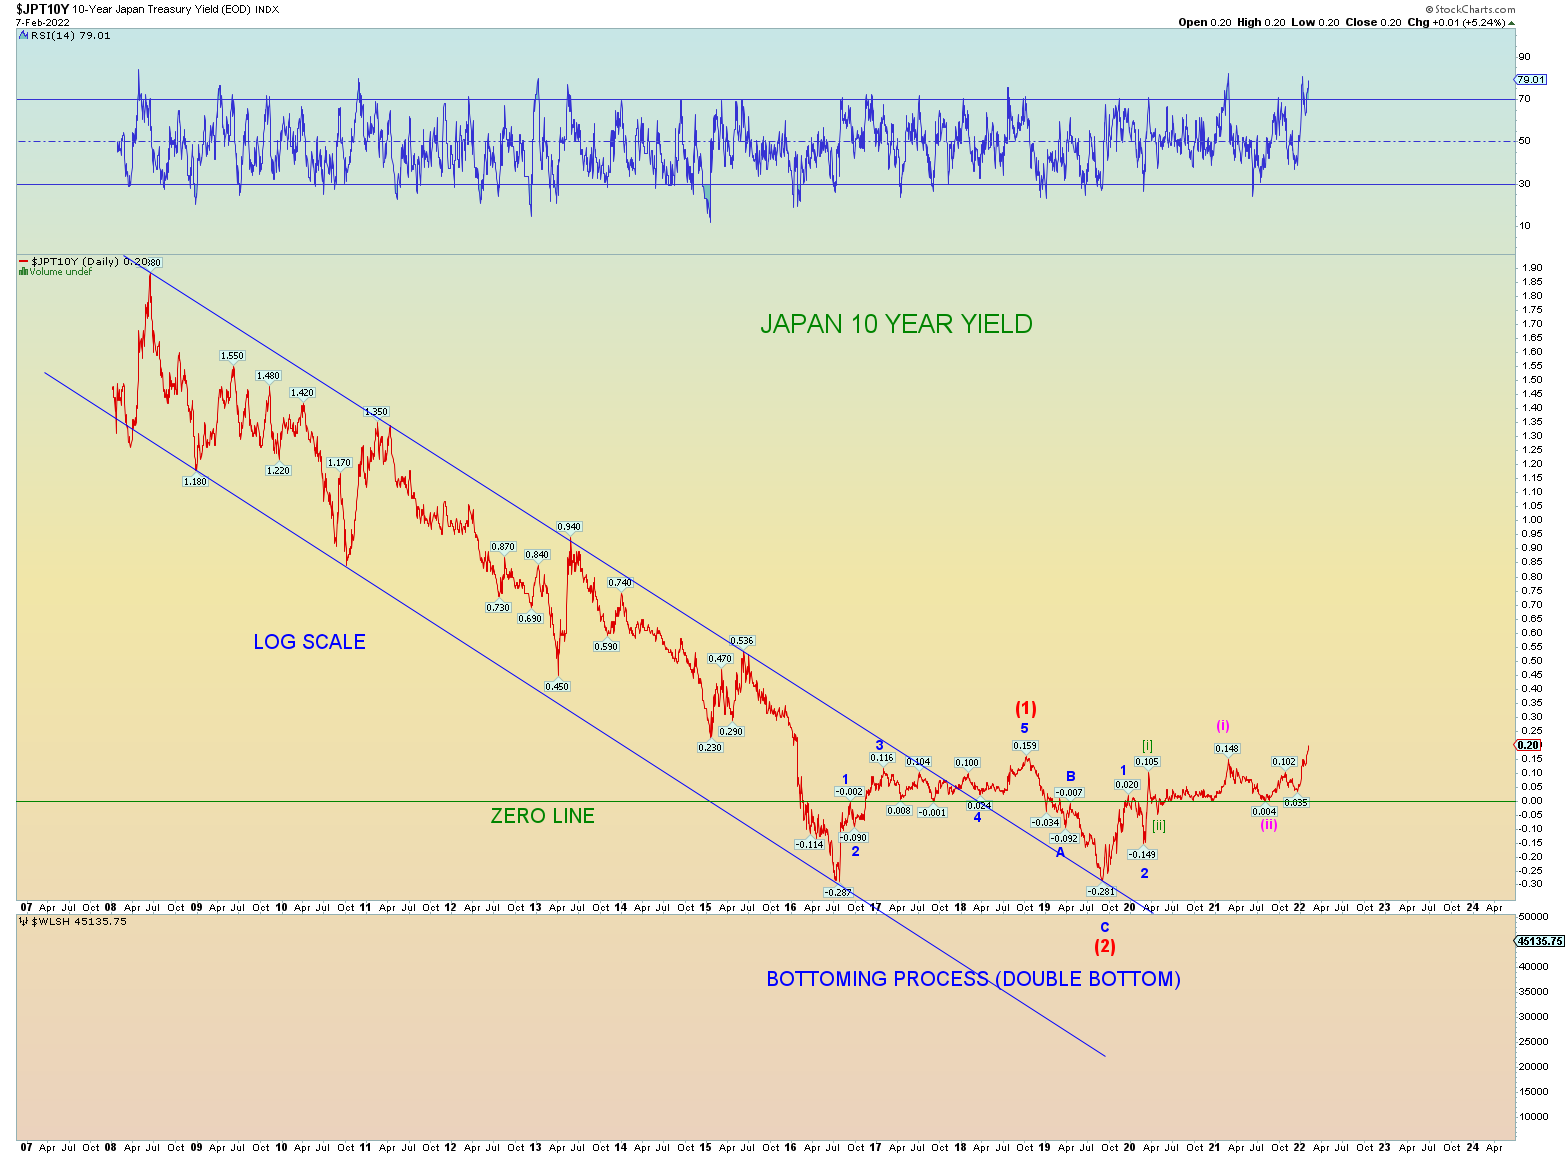
Japan. King of credit debt. Highest 10-year yield since 2015. This is not good. Remember all these channels of yields going lower correlate to massive amounts of debt issued. That is fine if the yields continued lower. But the world hit the bottom and reversed. Never in the history of mankind have we been in this financial time bomb situation before.
It’ll all blow up soon enough.
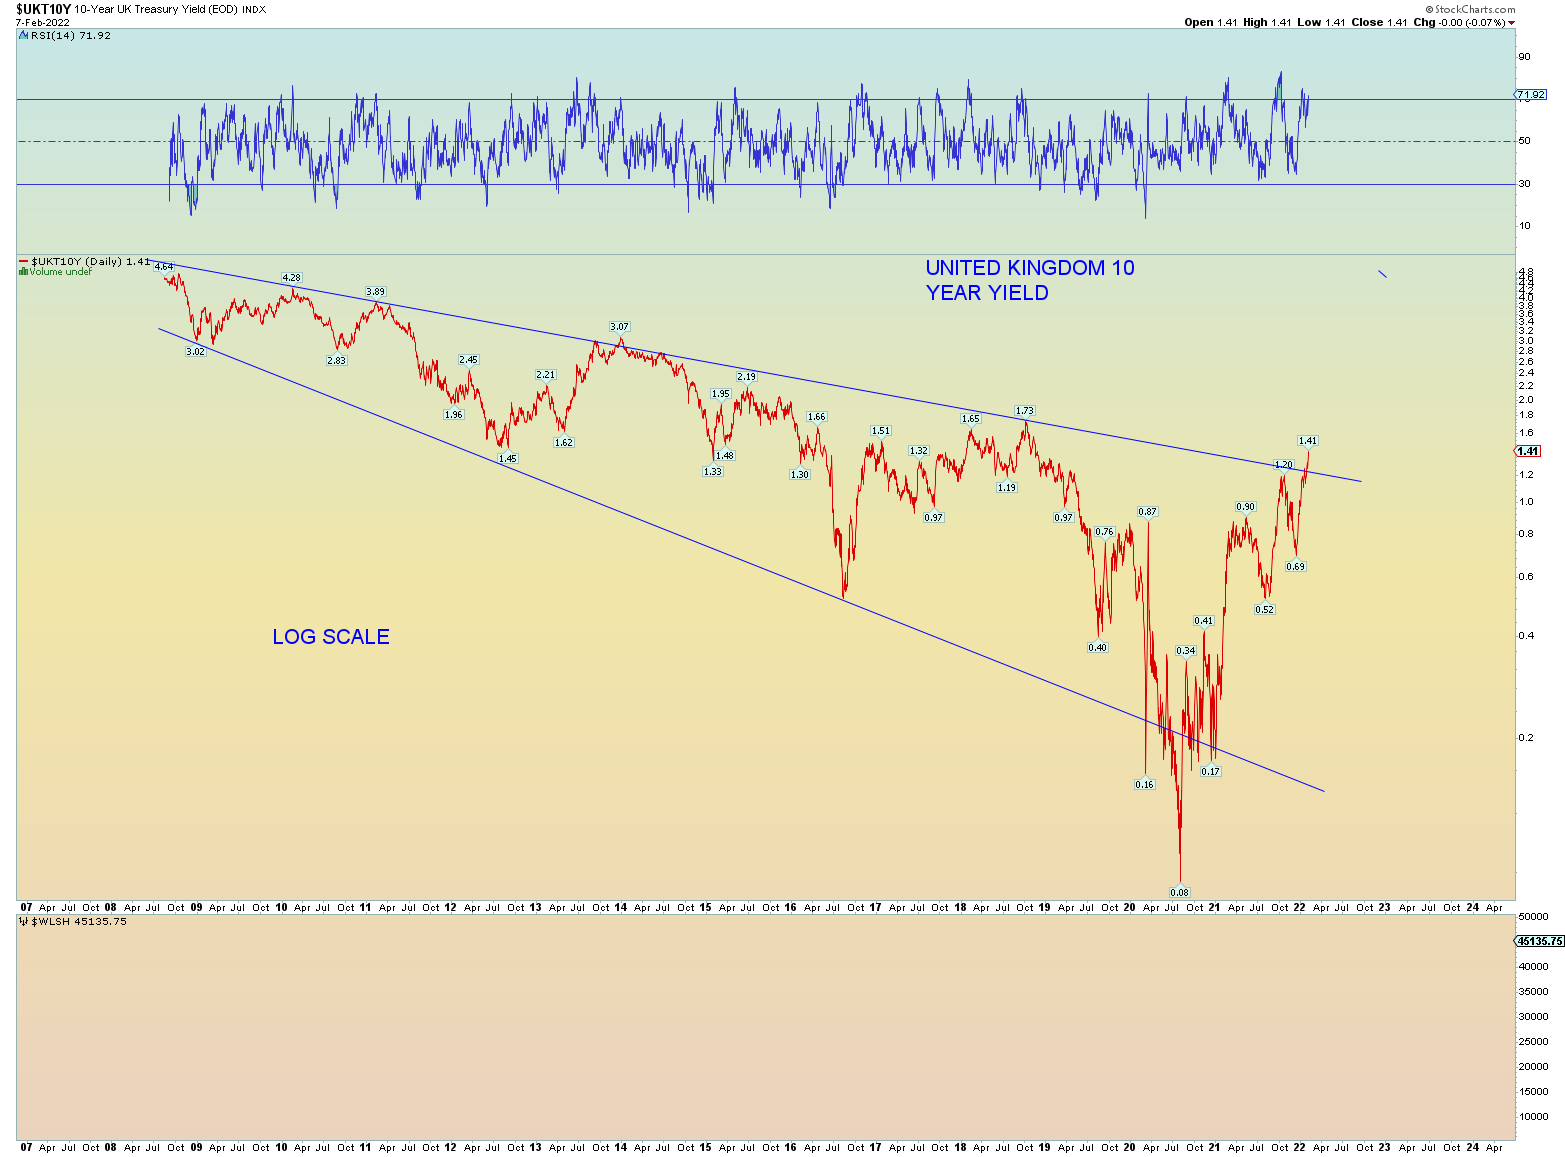
UK looks nicely impulsive upwards.
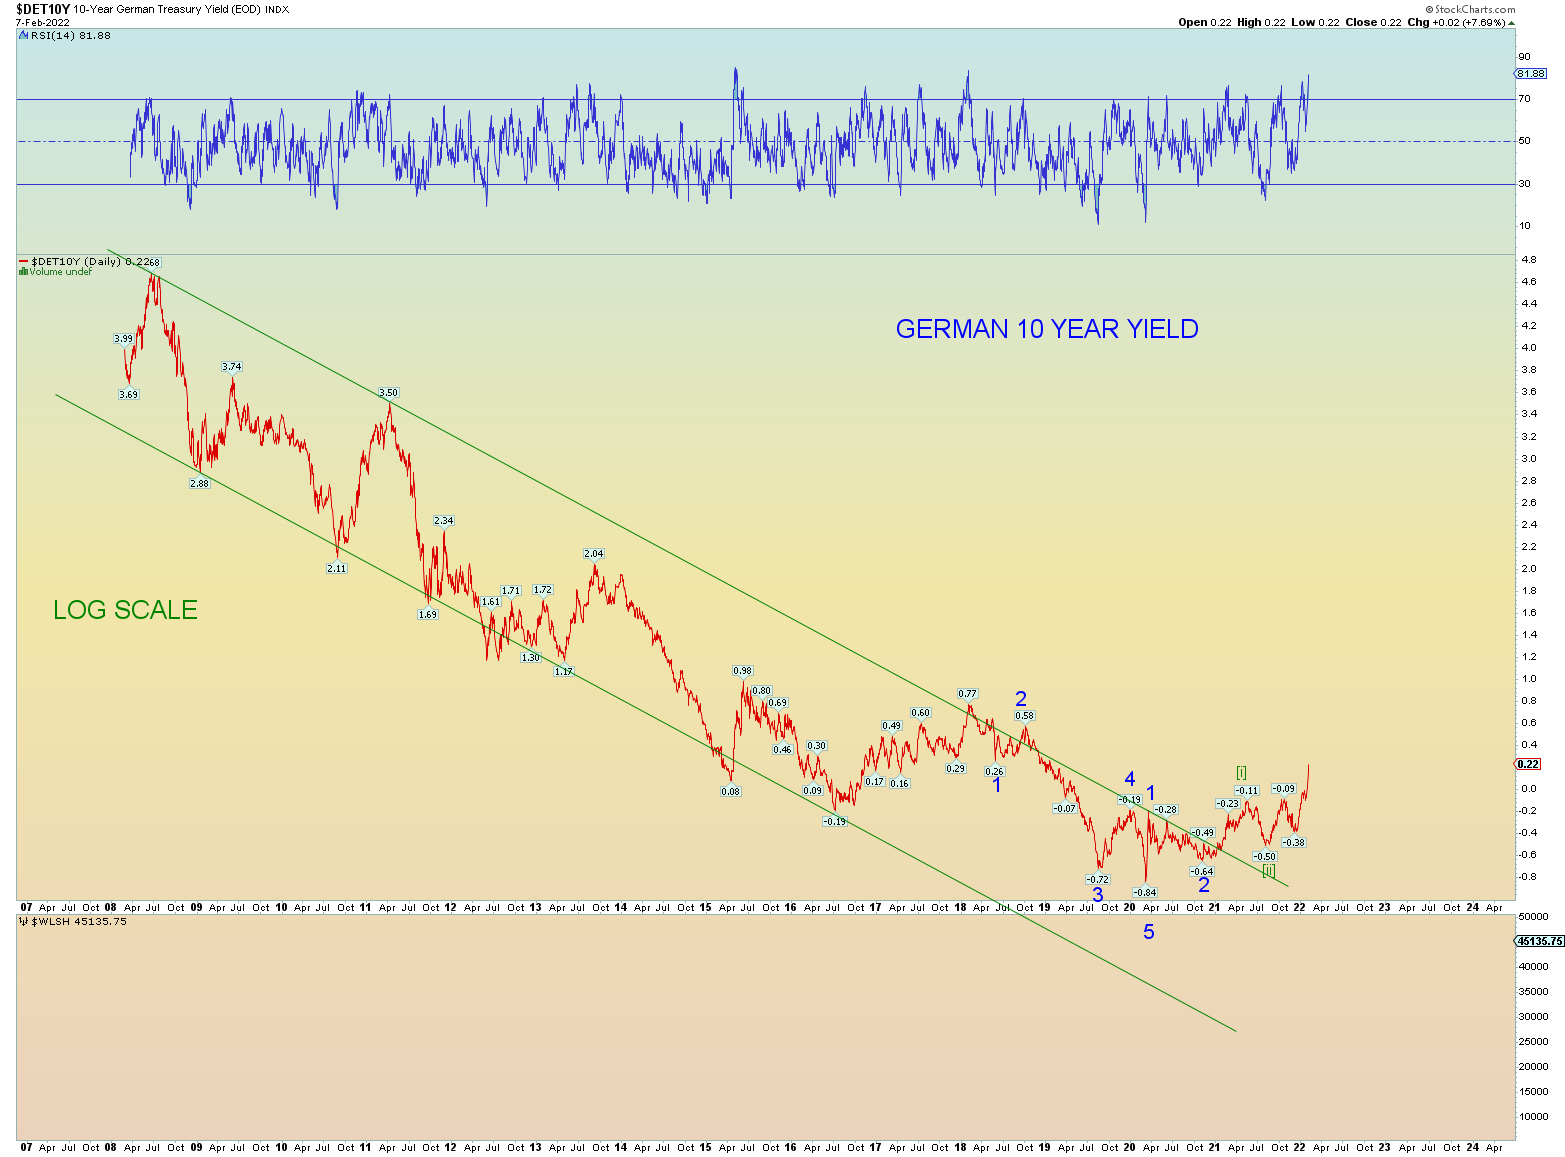
Don’t forget the Germans who also let their yields run negative. Duration risk is oh so dangerous here. Selling will beget more selling which will start a nasty feedback loop. The entire world is a debt bomb primed to explode. This will not be good for stocks.
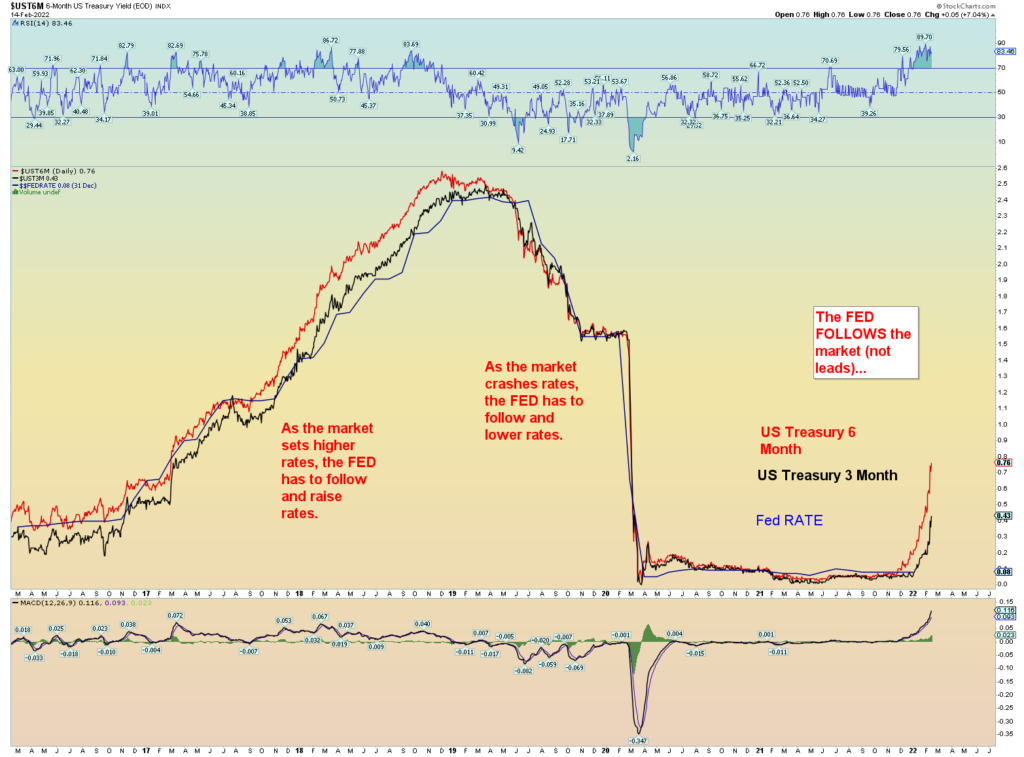
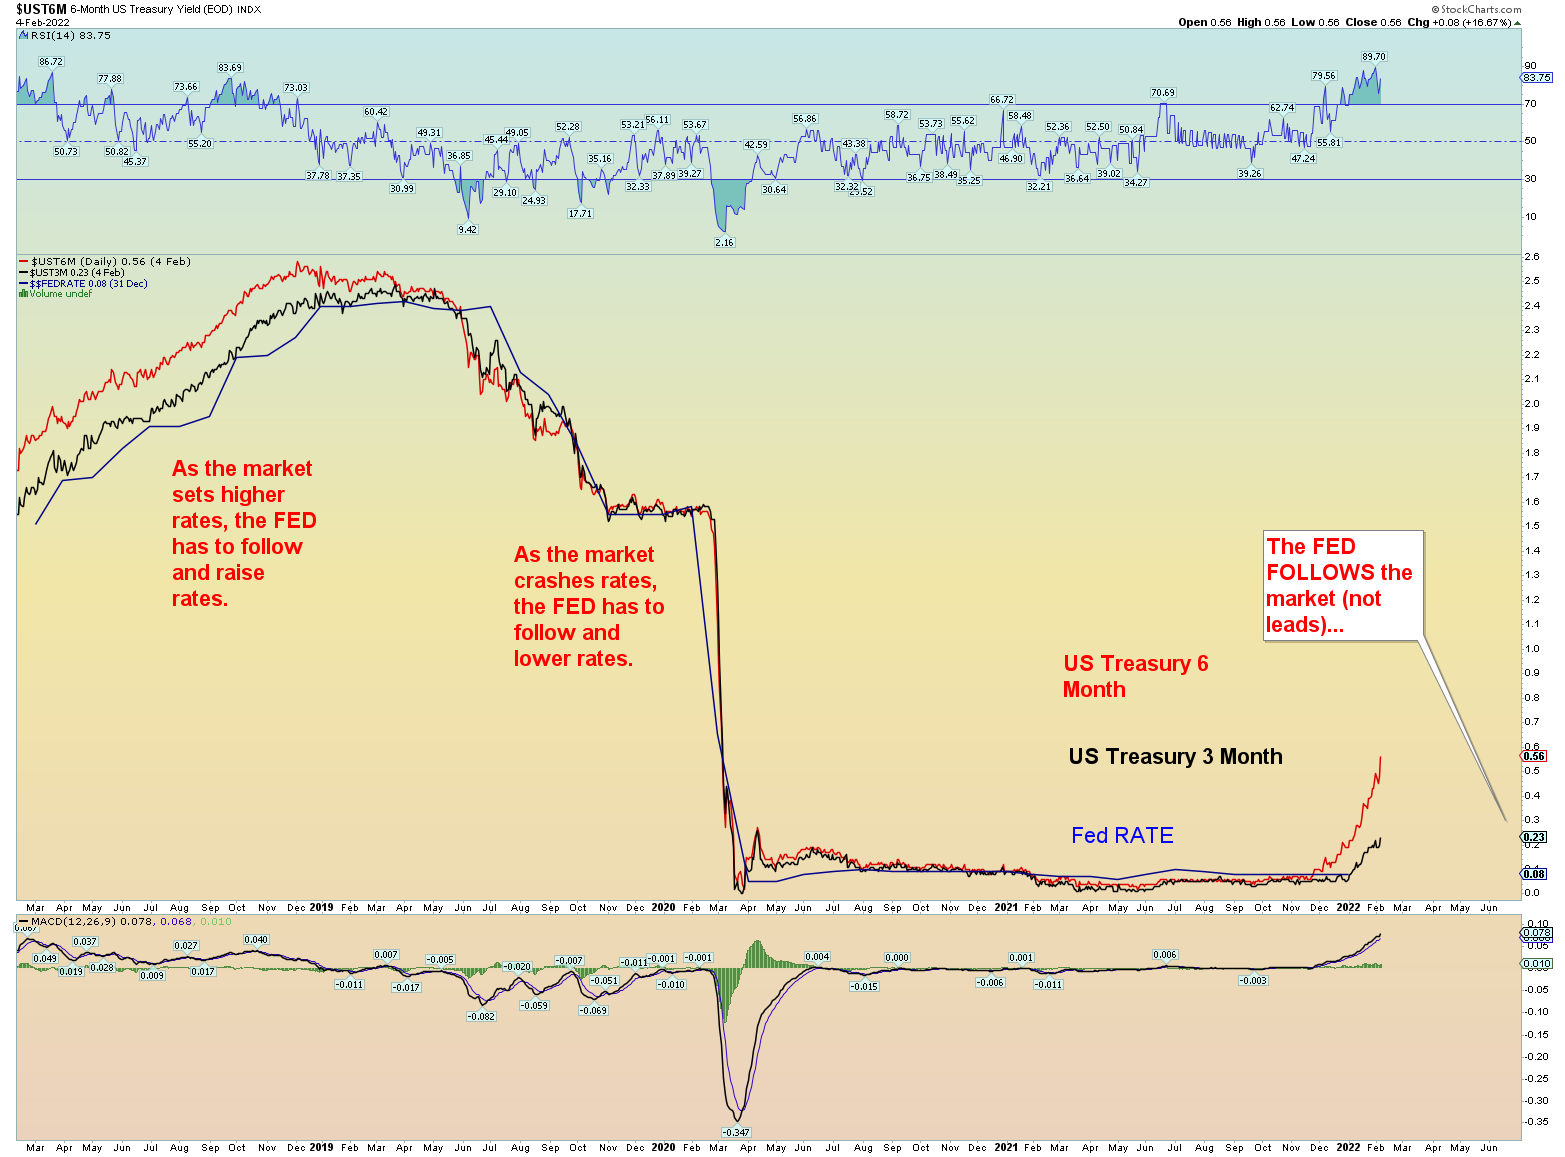
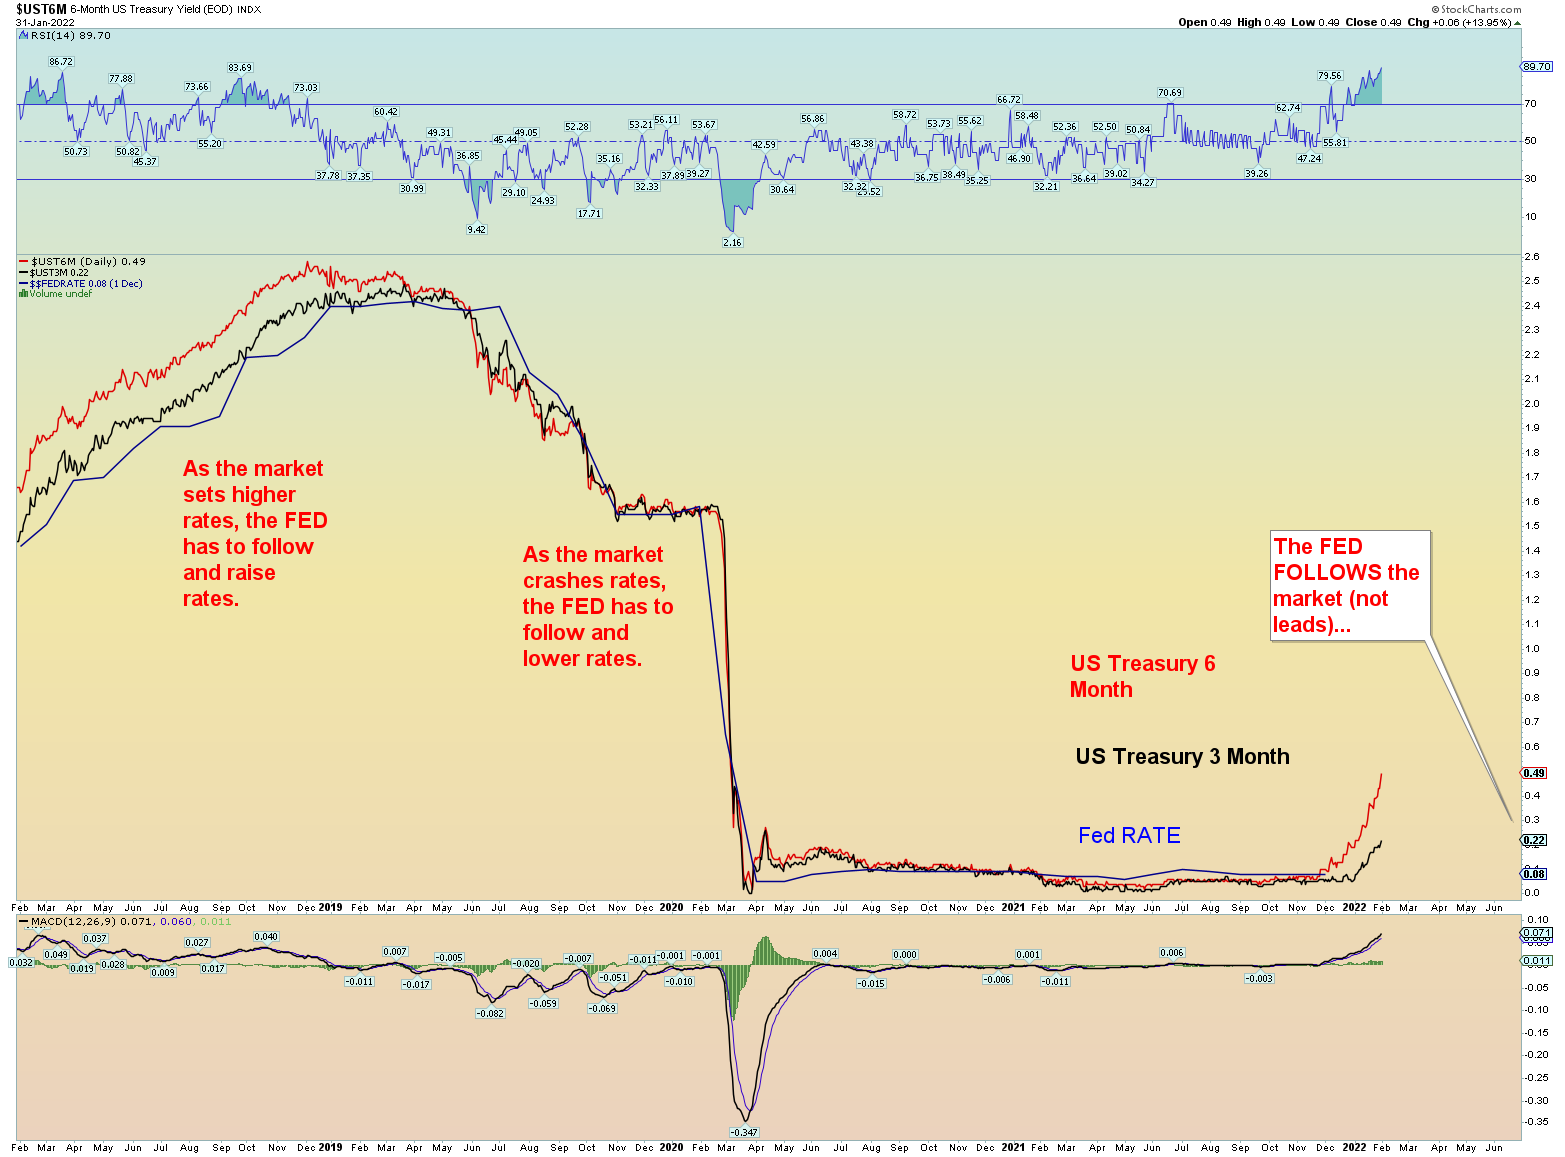
Rate raises are coming. The 3/6-month yield chart is running ahead of the FED and the FED has no choice but to play catch up. LOL, if the 3-month yield bursts toward .40 – .50 range and the 6 month considerably higher, the FED might actually raise it more than a quarter point…. wouldn’t that be a kick to the face for the stock market?
Look at that RSI momentum.
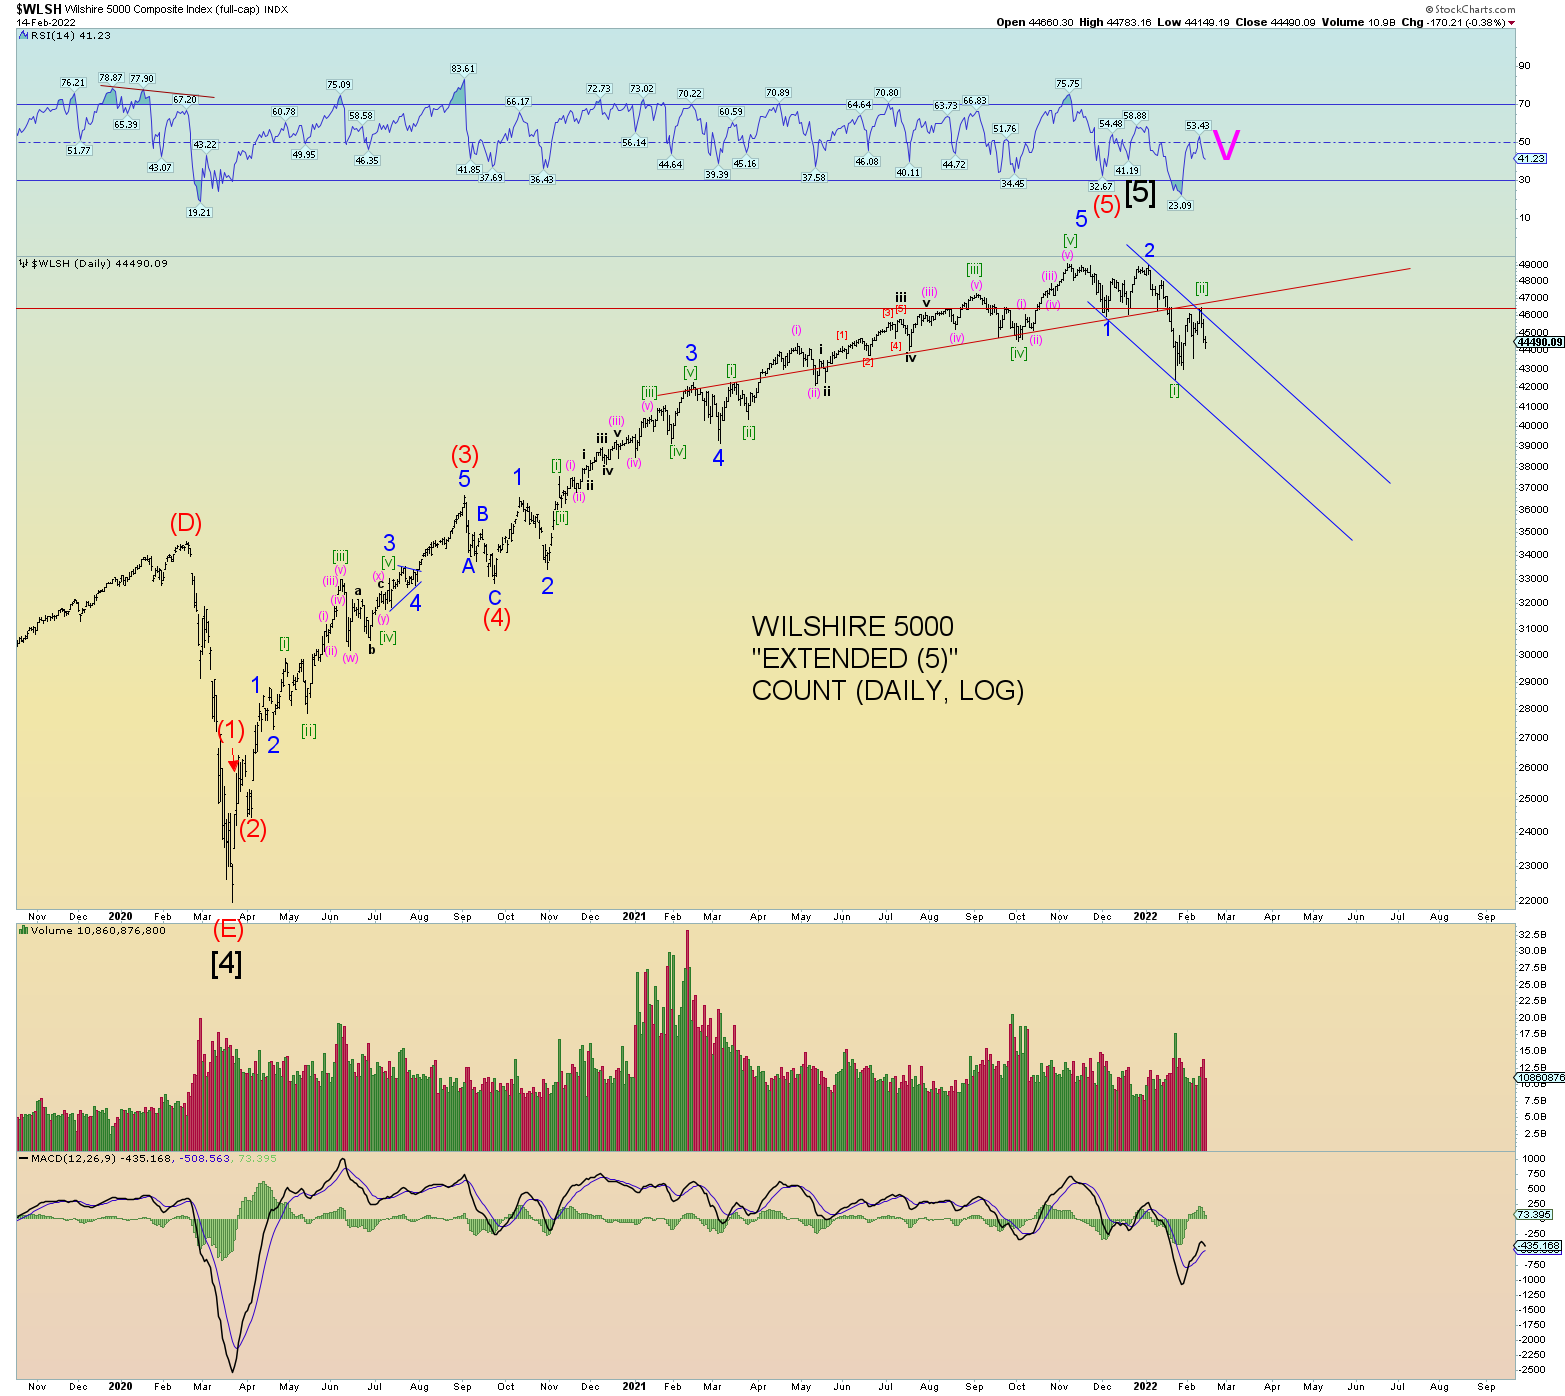
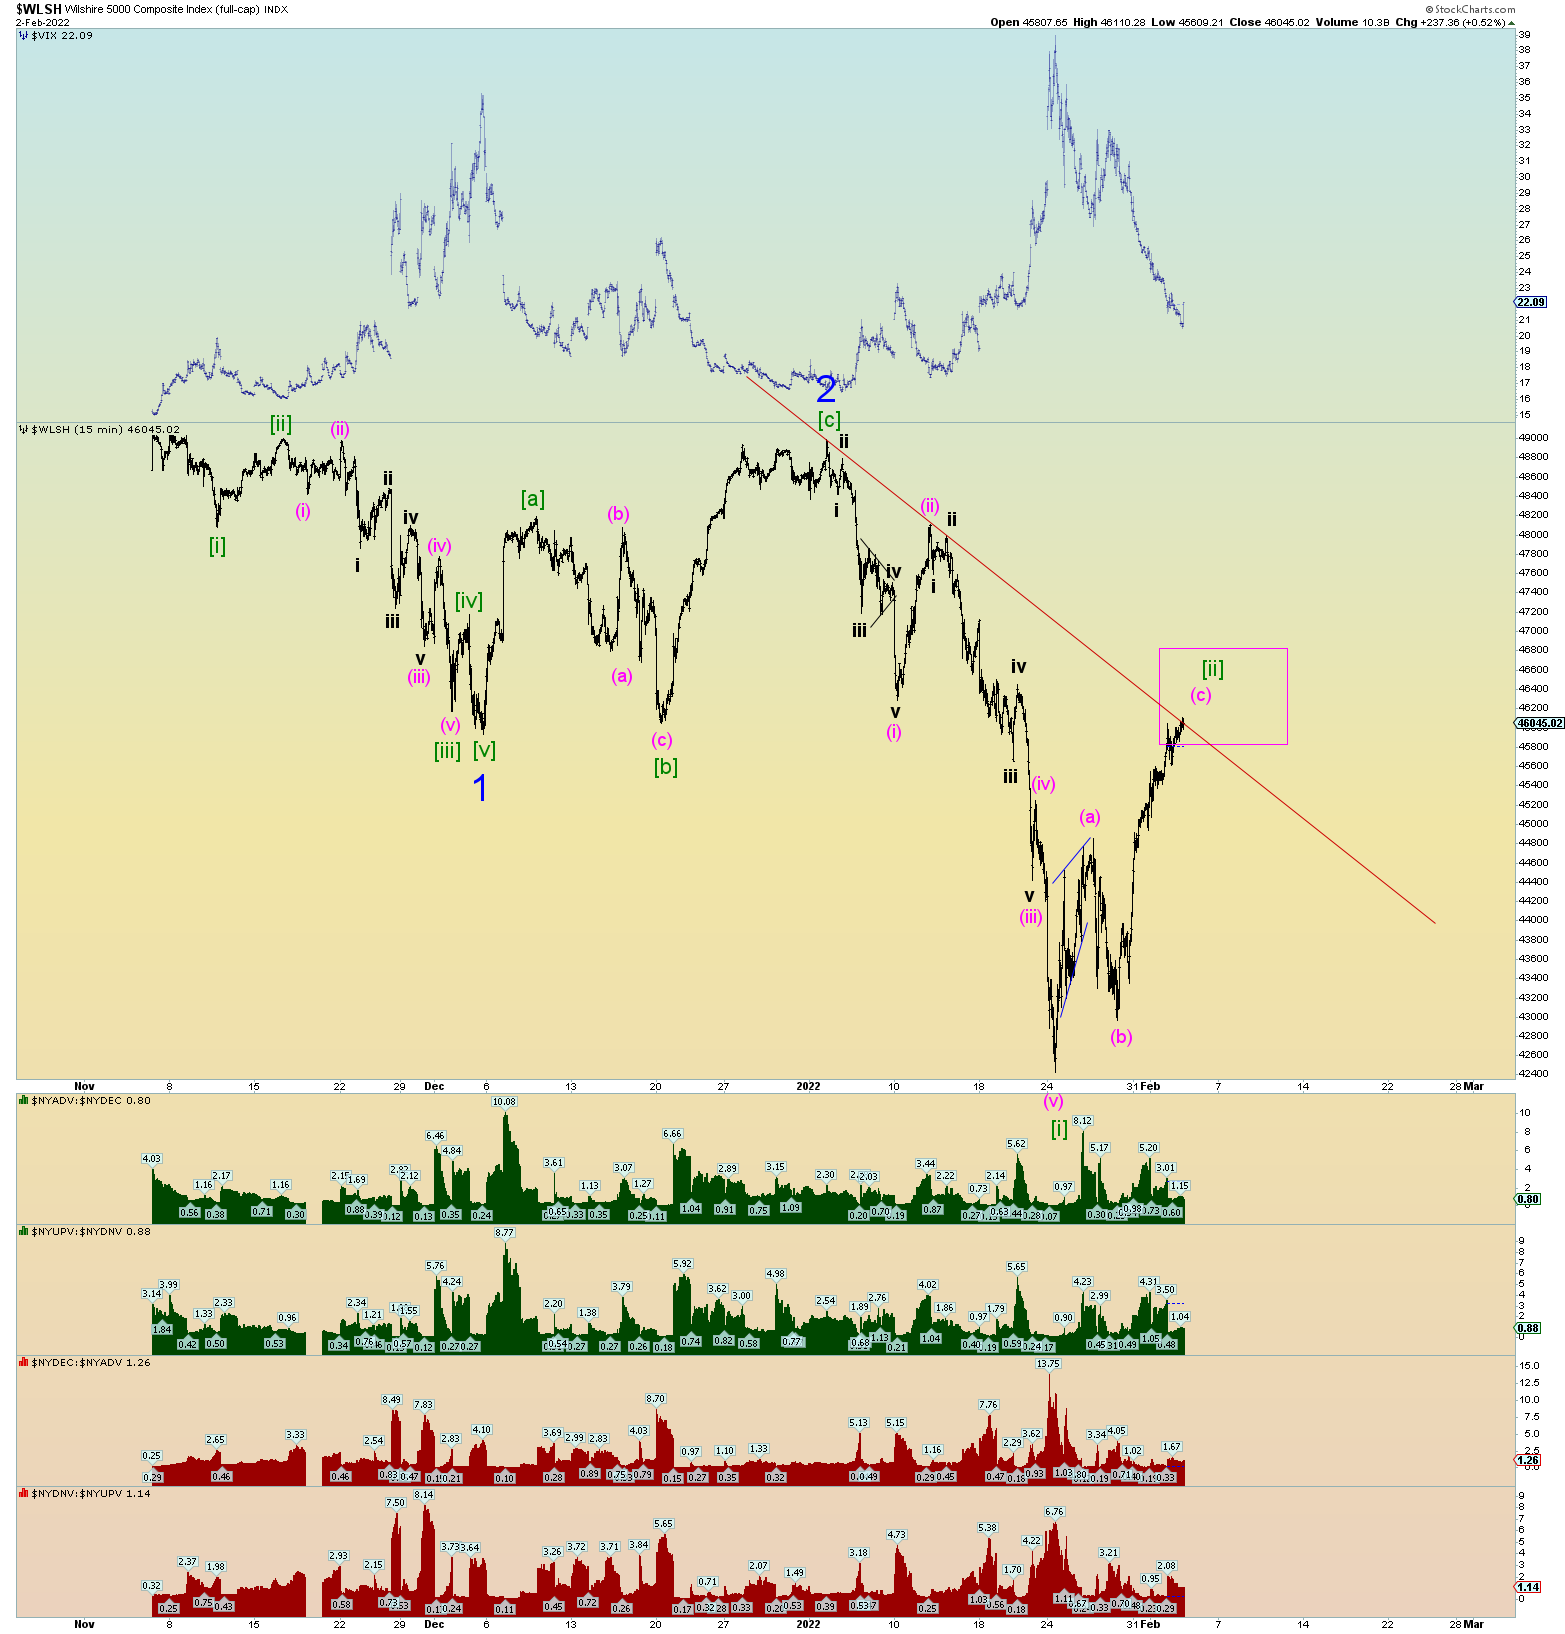
The Wilshire 5000’s primary bearish count has now whittled down to Minor 1 -2, Minute [i] – [ii] wave structure.
From a head and shoulders topping chart pattern – which broke the neckline and met its lower target as shown in previous week’s posts – we now have prices attempting a backtest of the broken neckline.
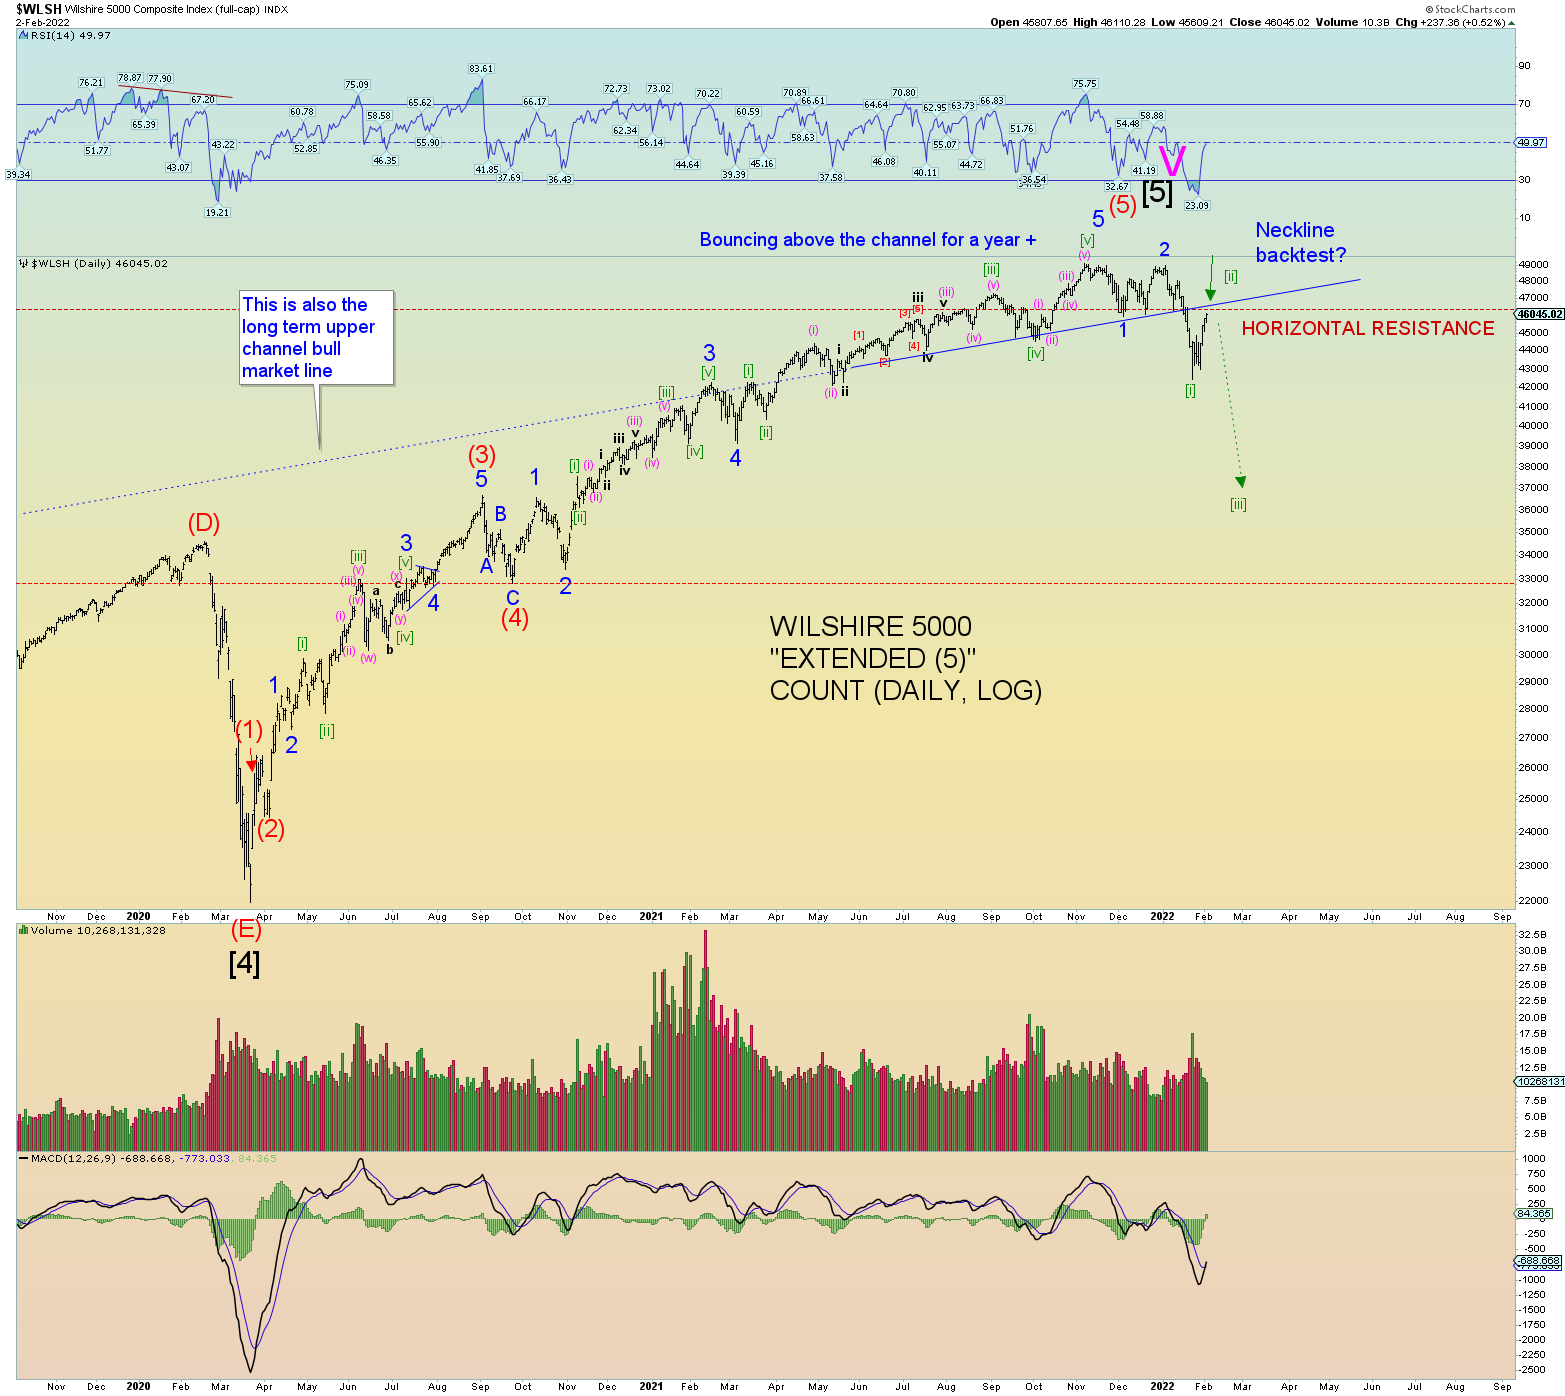
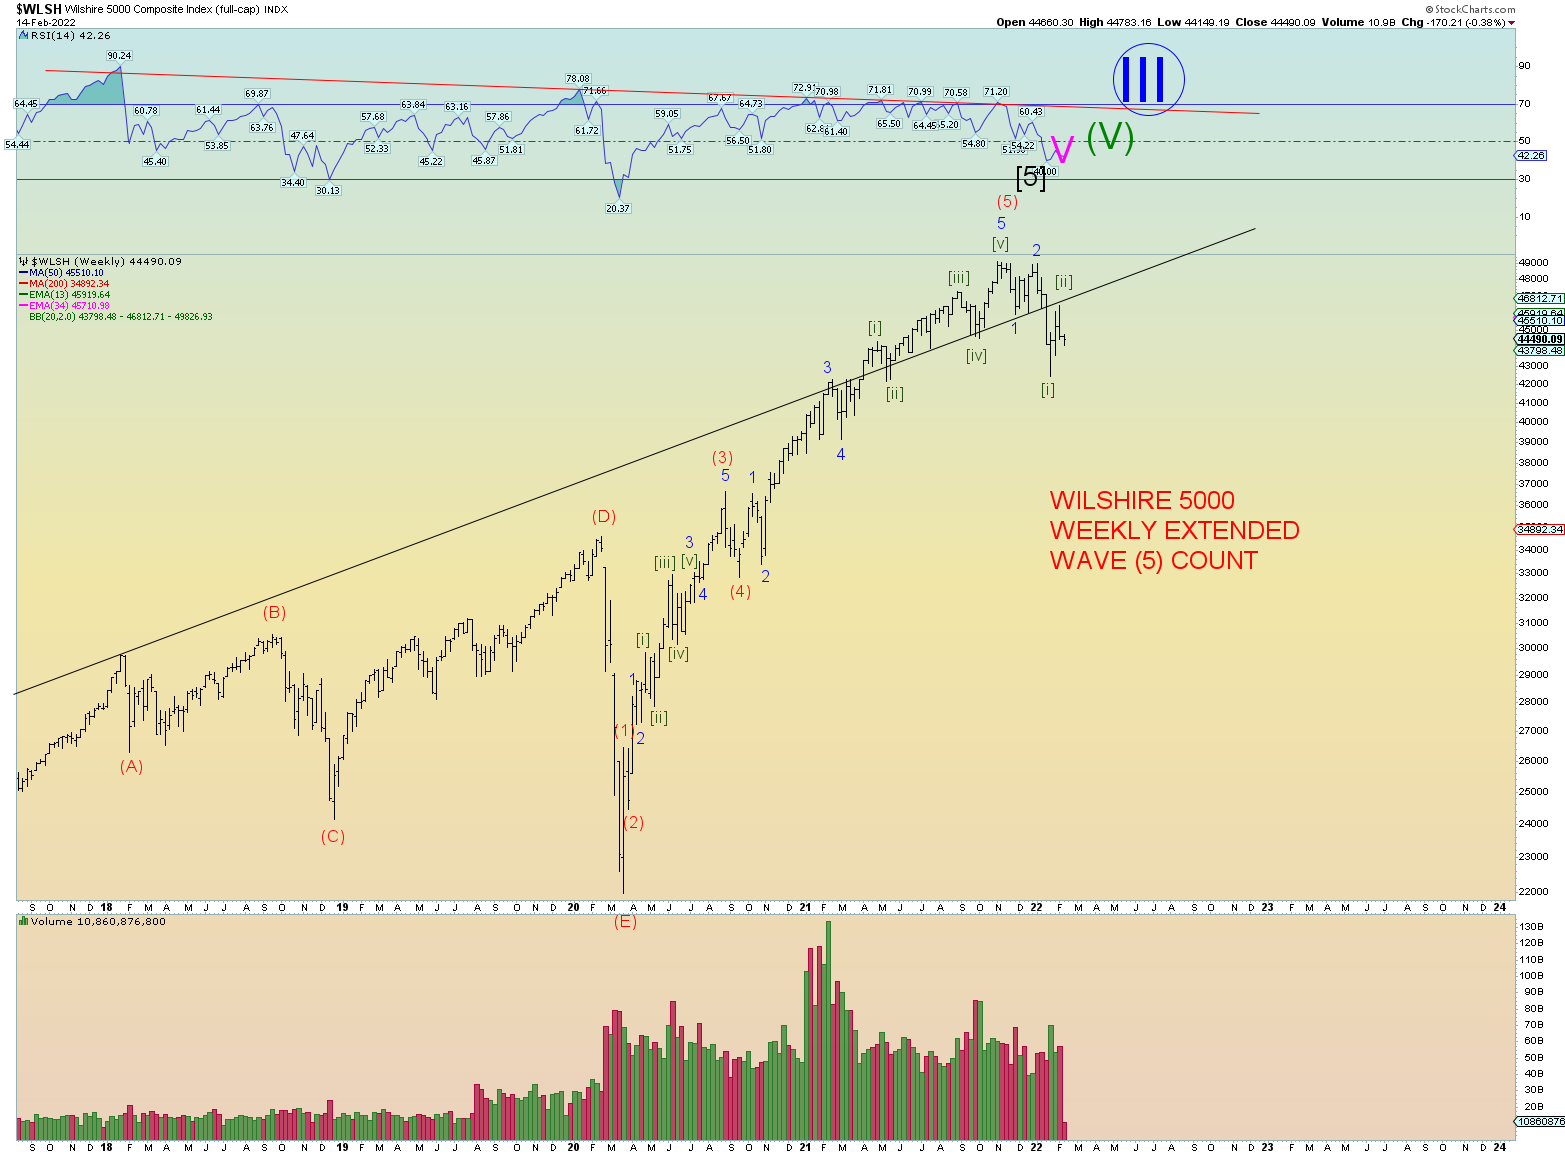
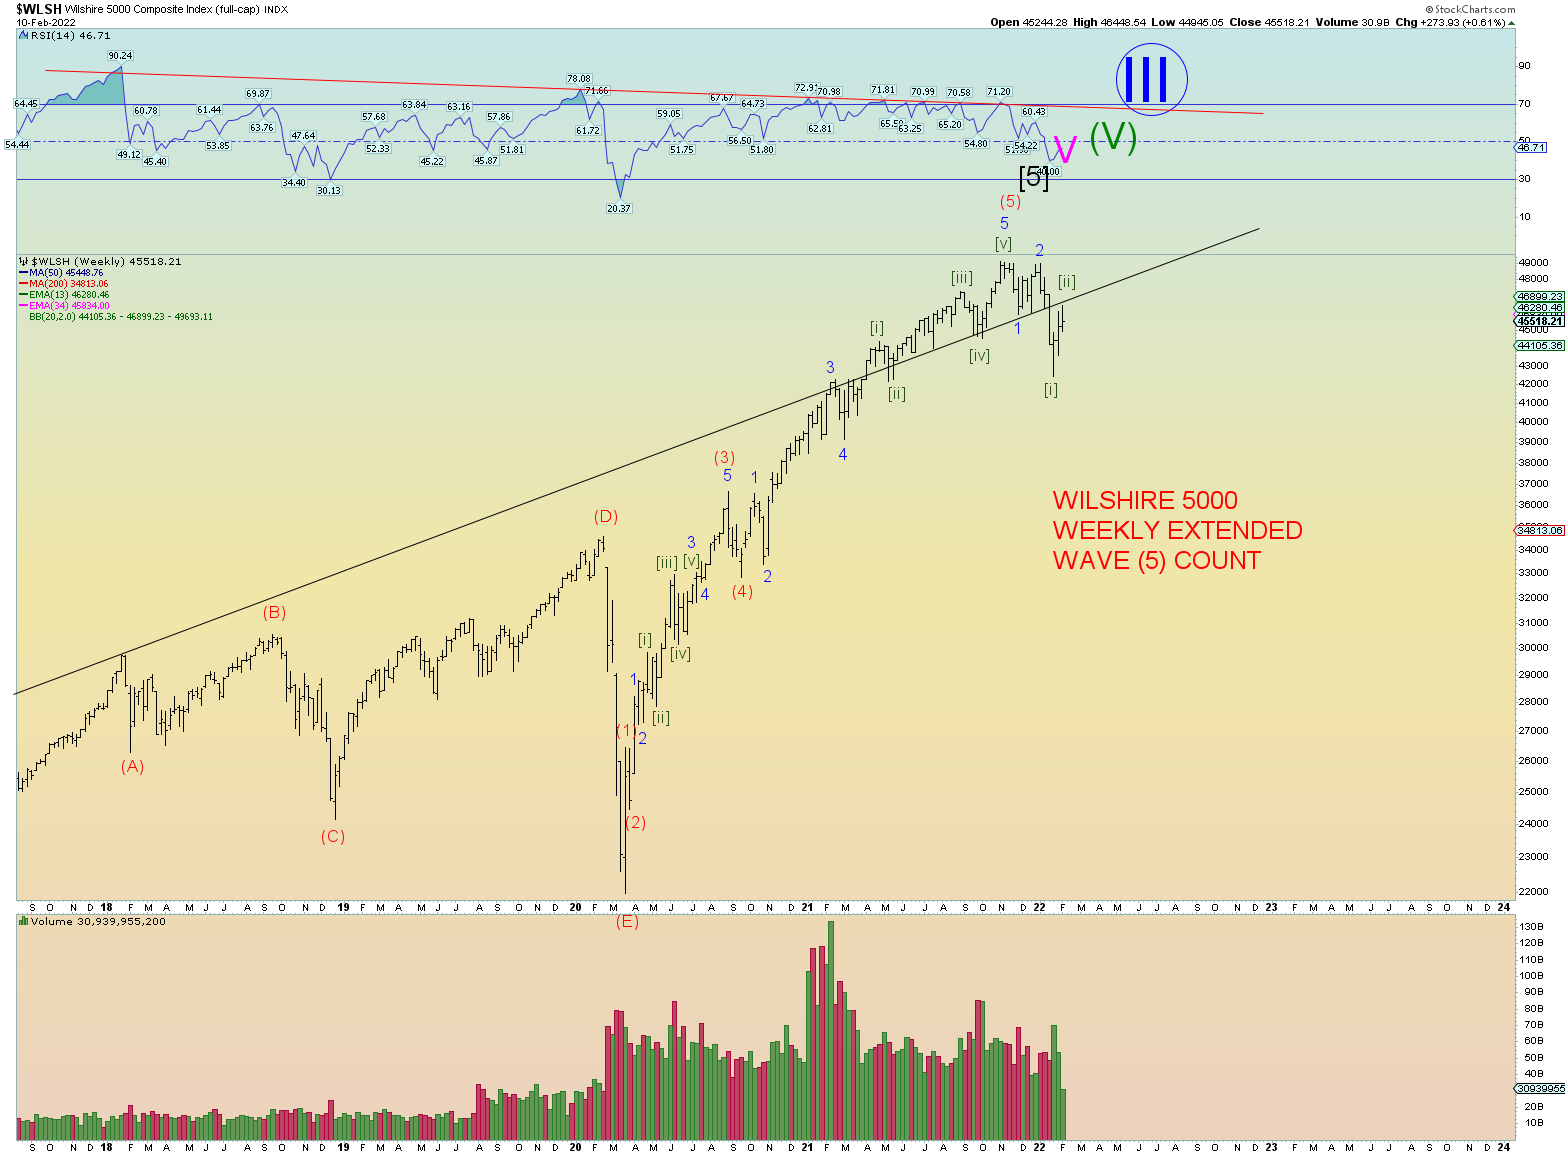
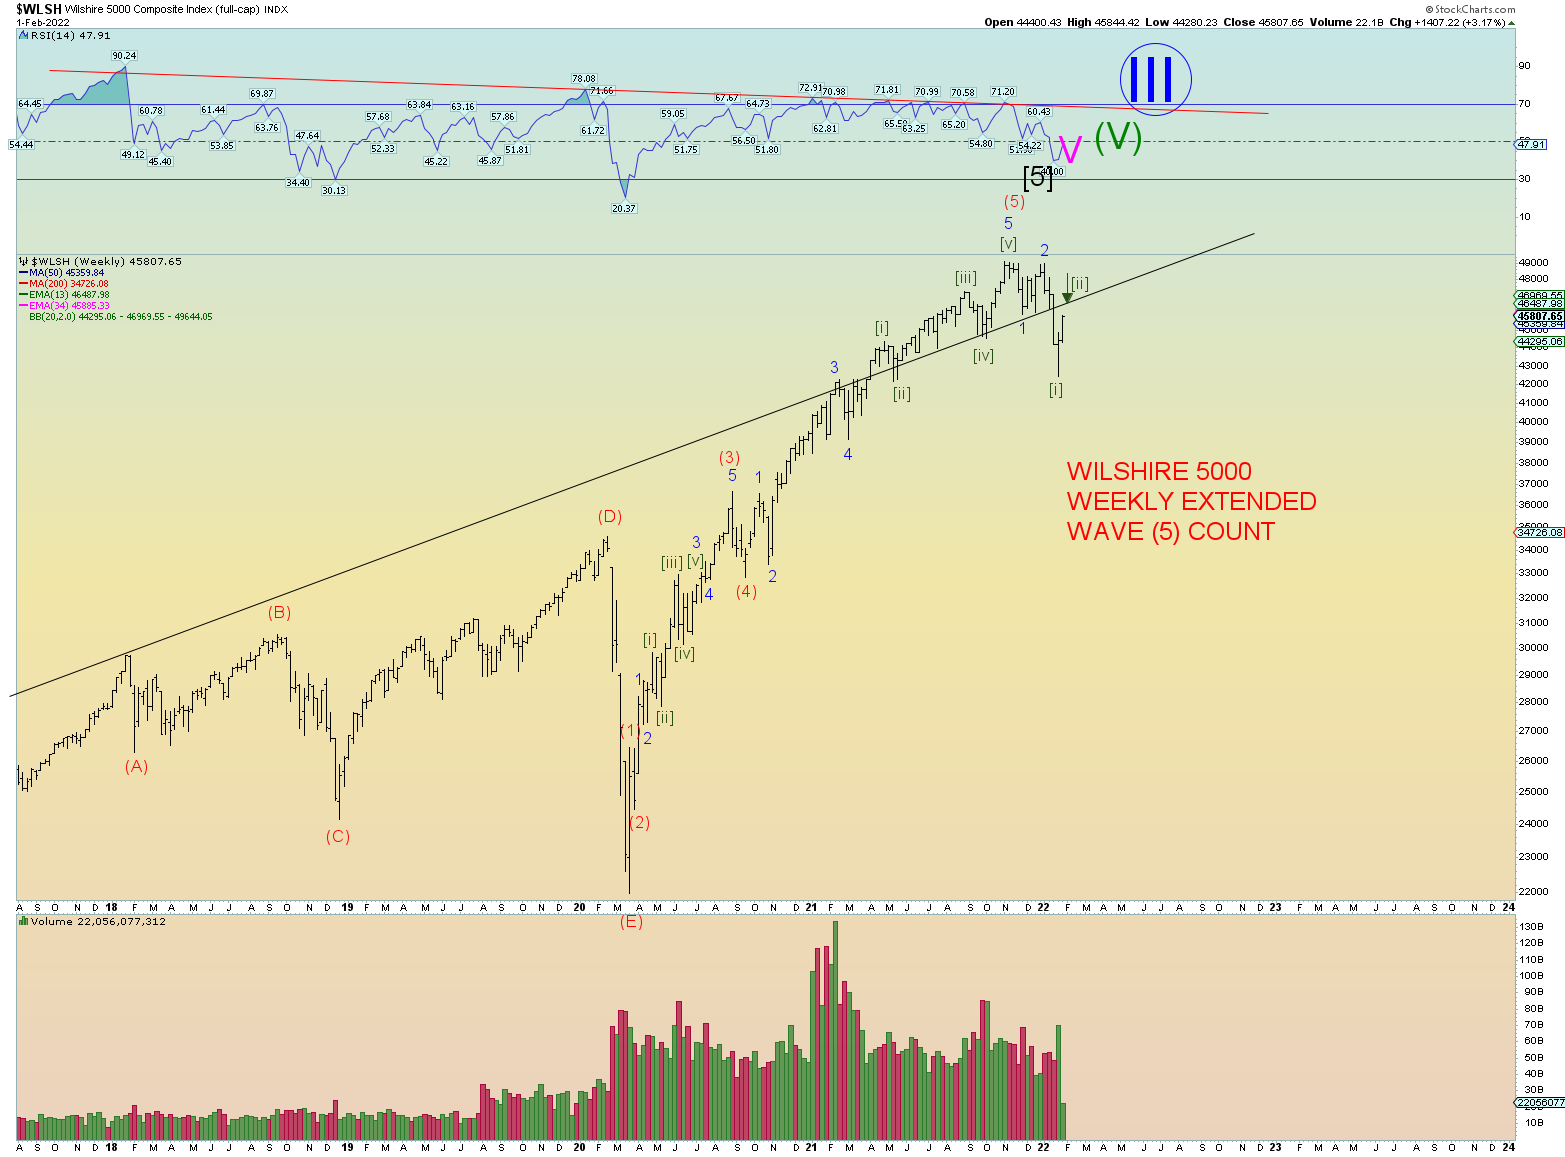
The short-term neckline pattern happens to align with the long-term upper channel line as shown on the weekly.
Therefore, the neckline “backtest” is not only of the head and shoulders topping chart pattern, but one could say the entire bull market upper channel line.
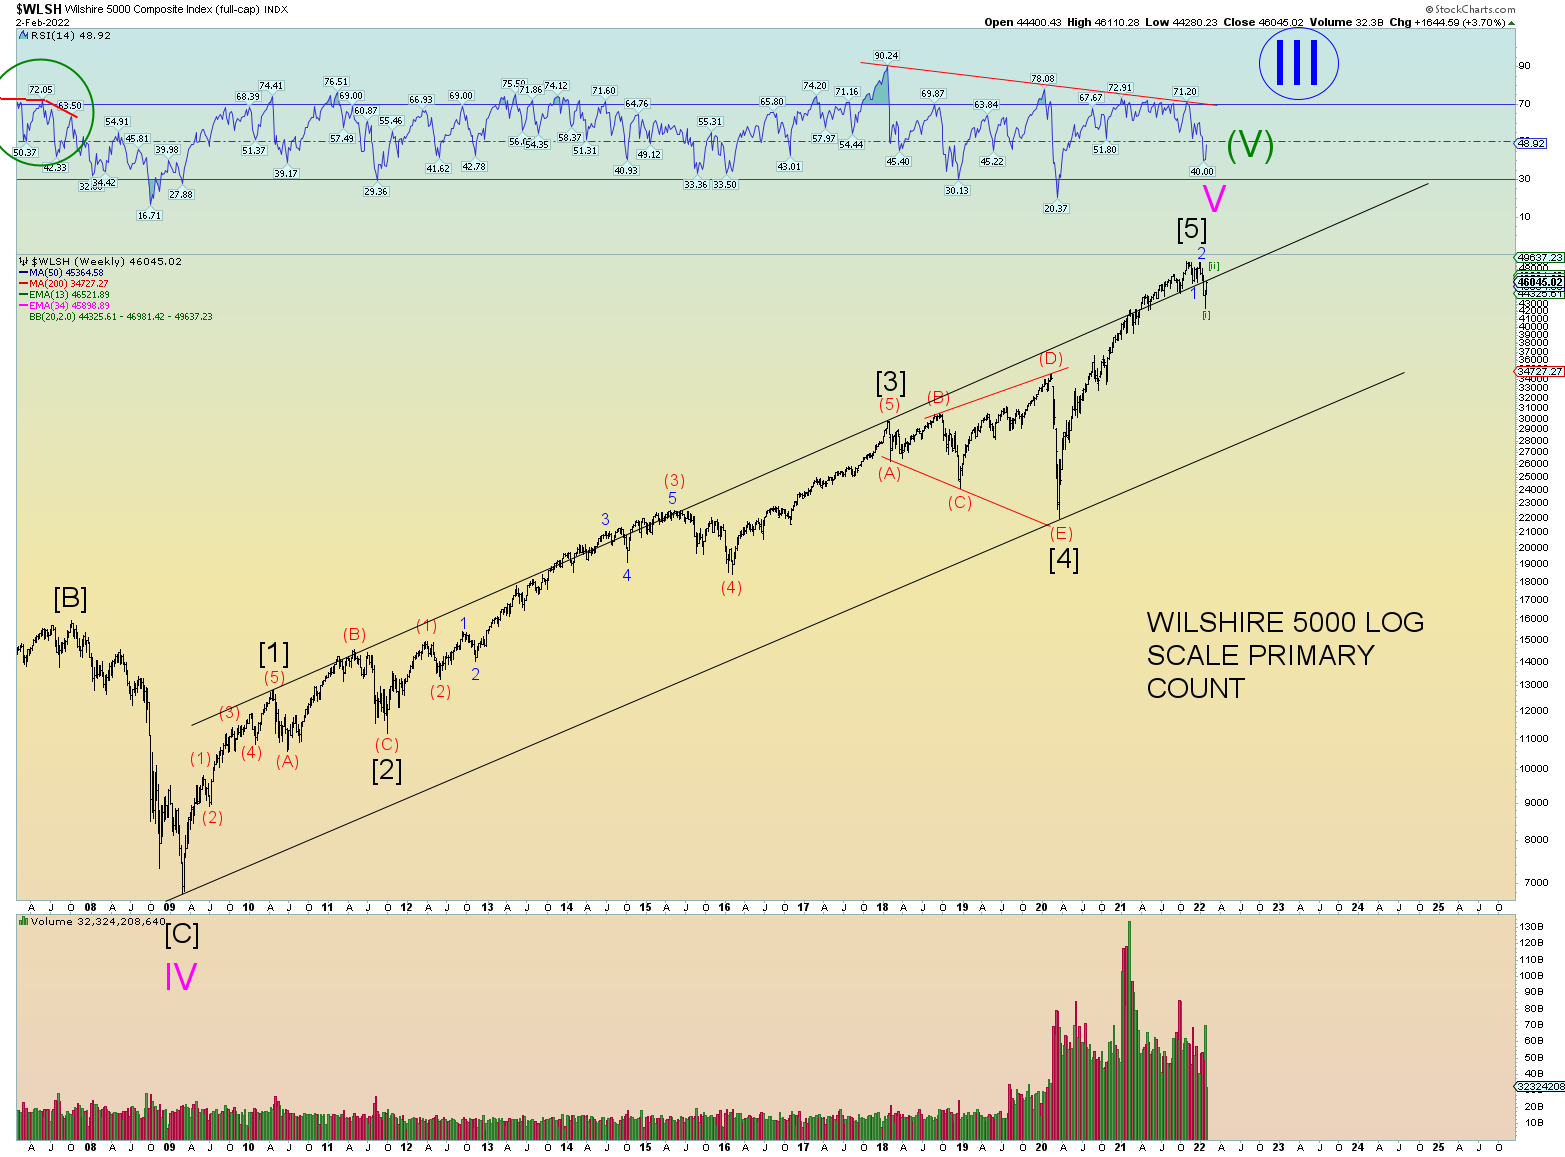
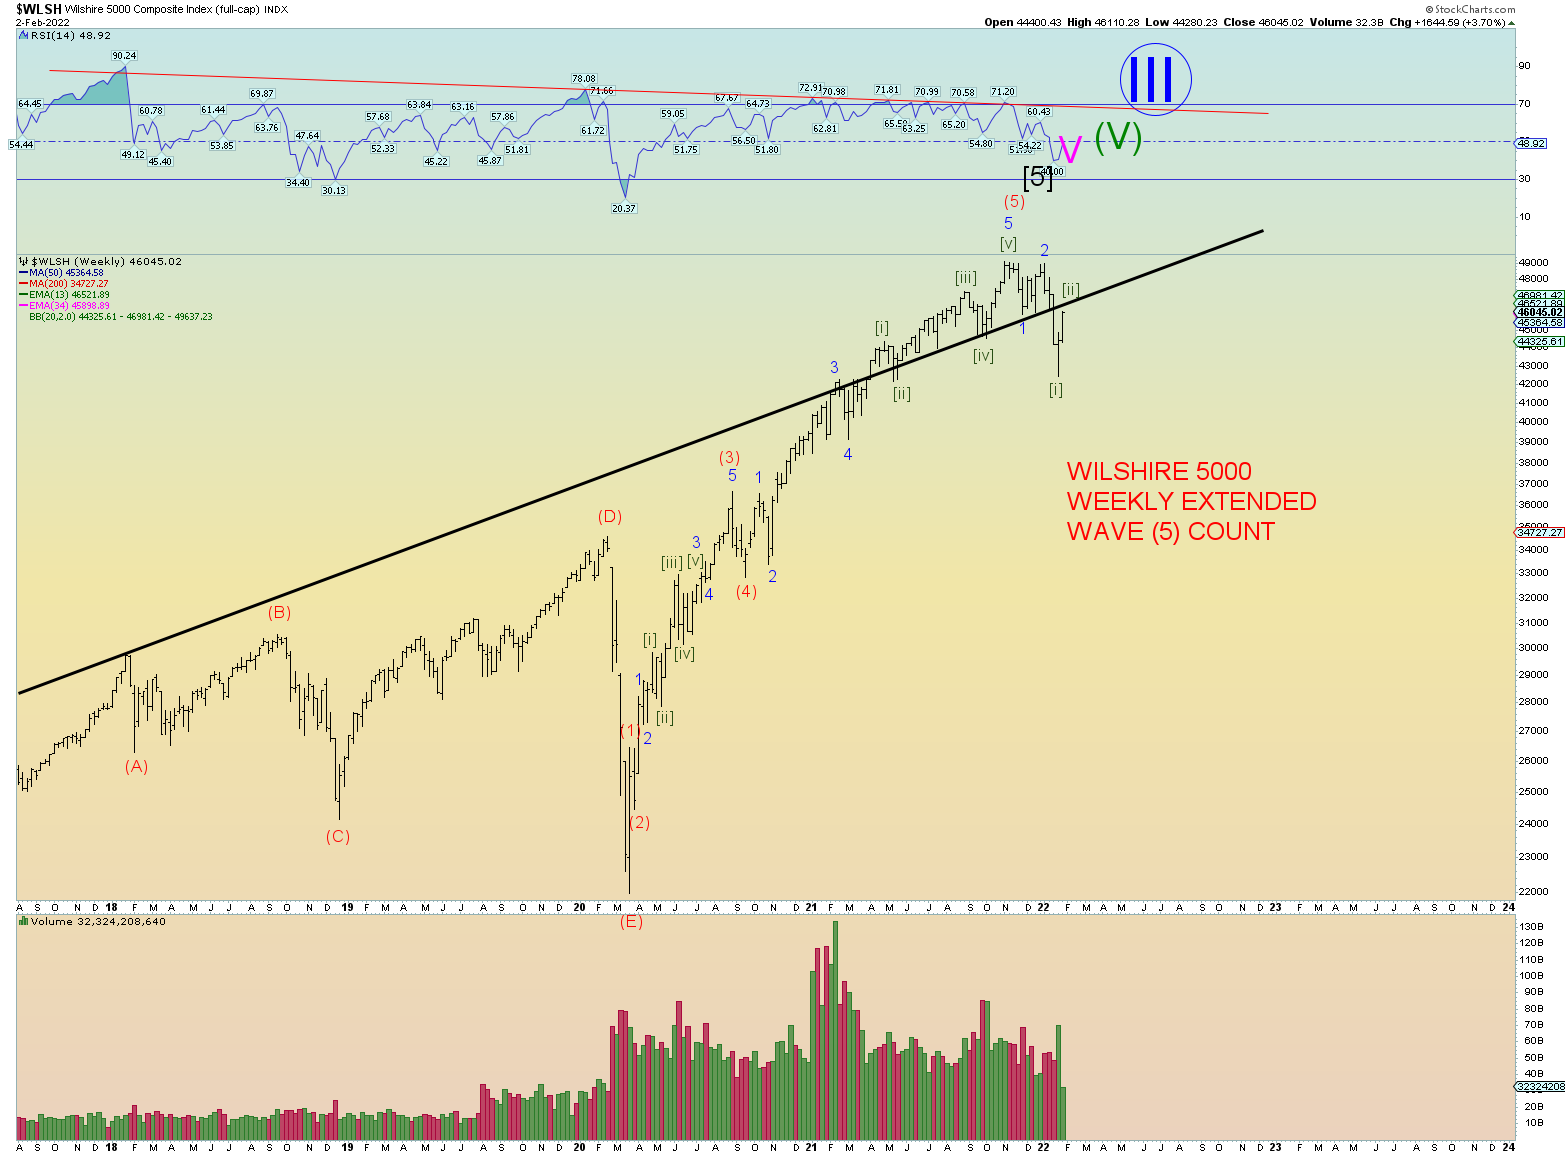
Zooming in on the weekly, prices are more or less at that upper channel. The upper channel line had provided support for the overextended wave (5) for well over a year. Prices fell violently through, and they need to regain this key trendline in order for the bull market to continue. It’s that simple.
If the neckline/channel line is rejected – which the primary count is that prices will be rejected – then an even more violent bear wave down in Minute [iii] of Minor 3 should occur. Basically, it would be a loss of support in search of the next support. And that is the key question. Where is next support other than the recent pivot price low of Minute [i] of 3 down (which should not prove to be very solid)?
15-minute squiggle count.
CONCLUSION
The chart wave patterns are simple. Prices need to regain the broken head and shoulders neckline – which is also the long-term upper bull channel line – in order for the bull market to continue. The primary count is that prices will not regain this key support line (now acting as key resistance). And thus, the next wave down – Minute [iii] of Minor 3 of Intermediate (1) – will commence. Within the next wave, downside internal market metrics should surpass “90% down days”. This would be the first key internal market metric that would help confirm the count.
The next few days/week should be very interesting.
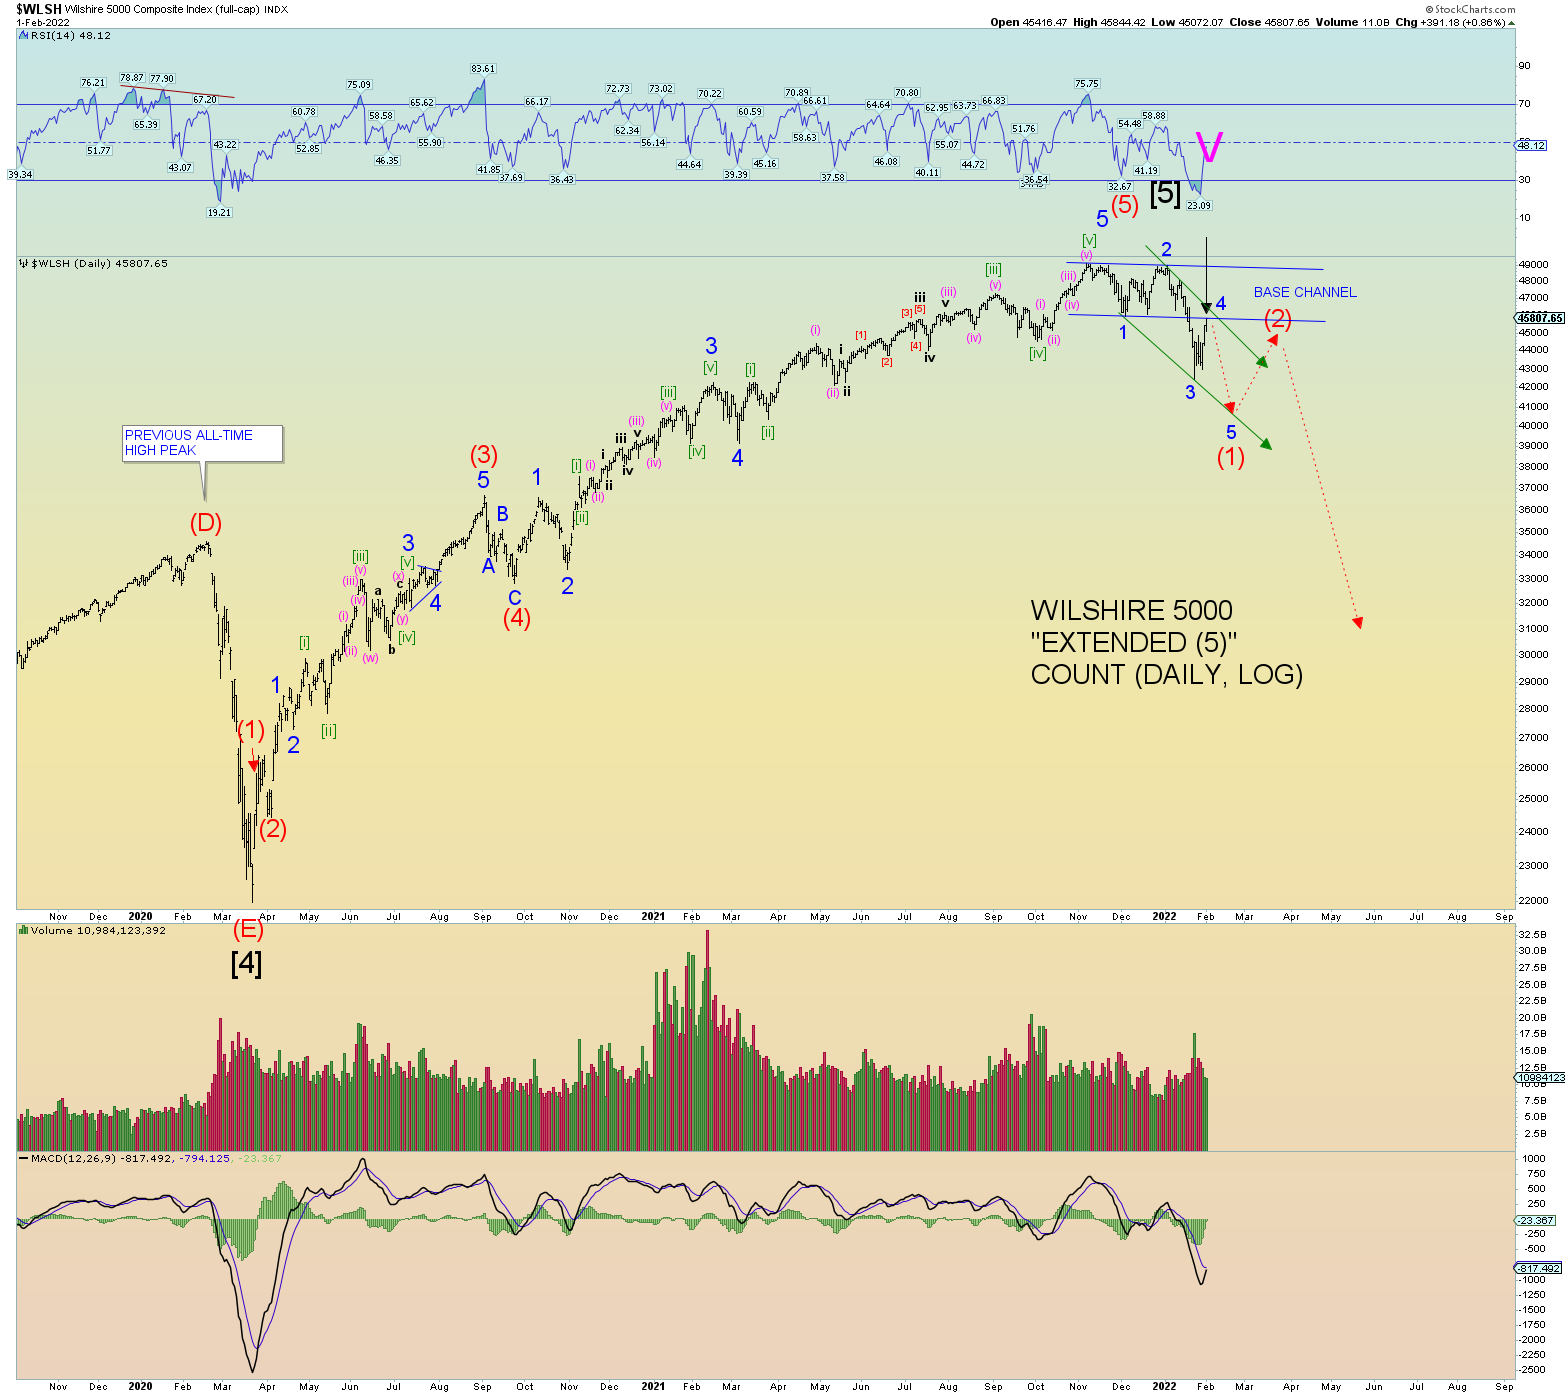
The options are narrowing down about two main bearish counts on the Wilshire 5000, both are similar. The 3rd option is a new all-time high eventually takes place. But we have only just retraced a bit over 50% so far.
Backtest of the base channel.
Or we have a 1 – 2, [i] – [ii] situation. In this count, [ii] should ideally overlap in price within the prior wave 1’s price range.
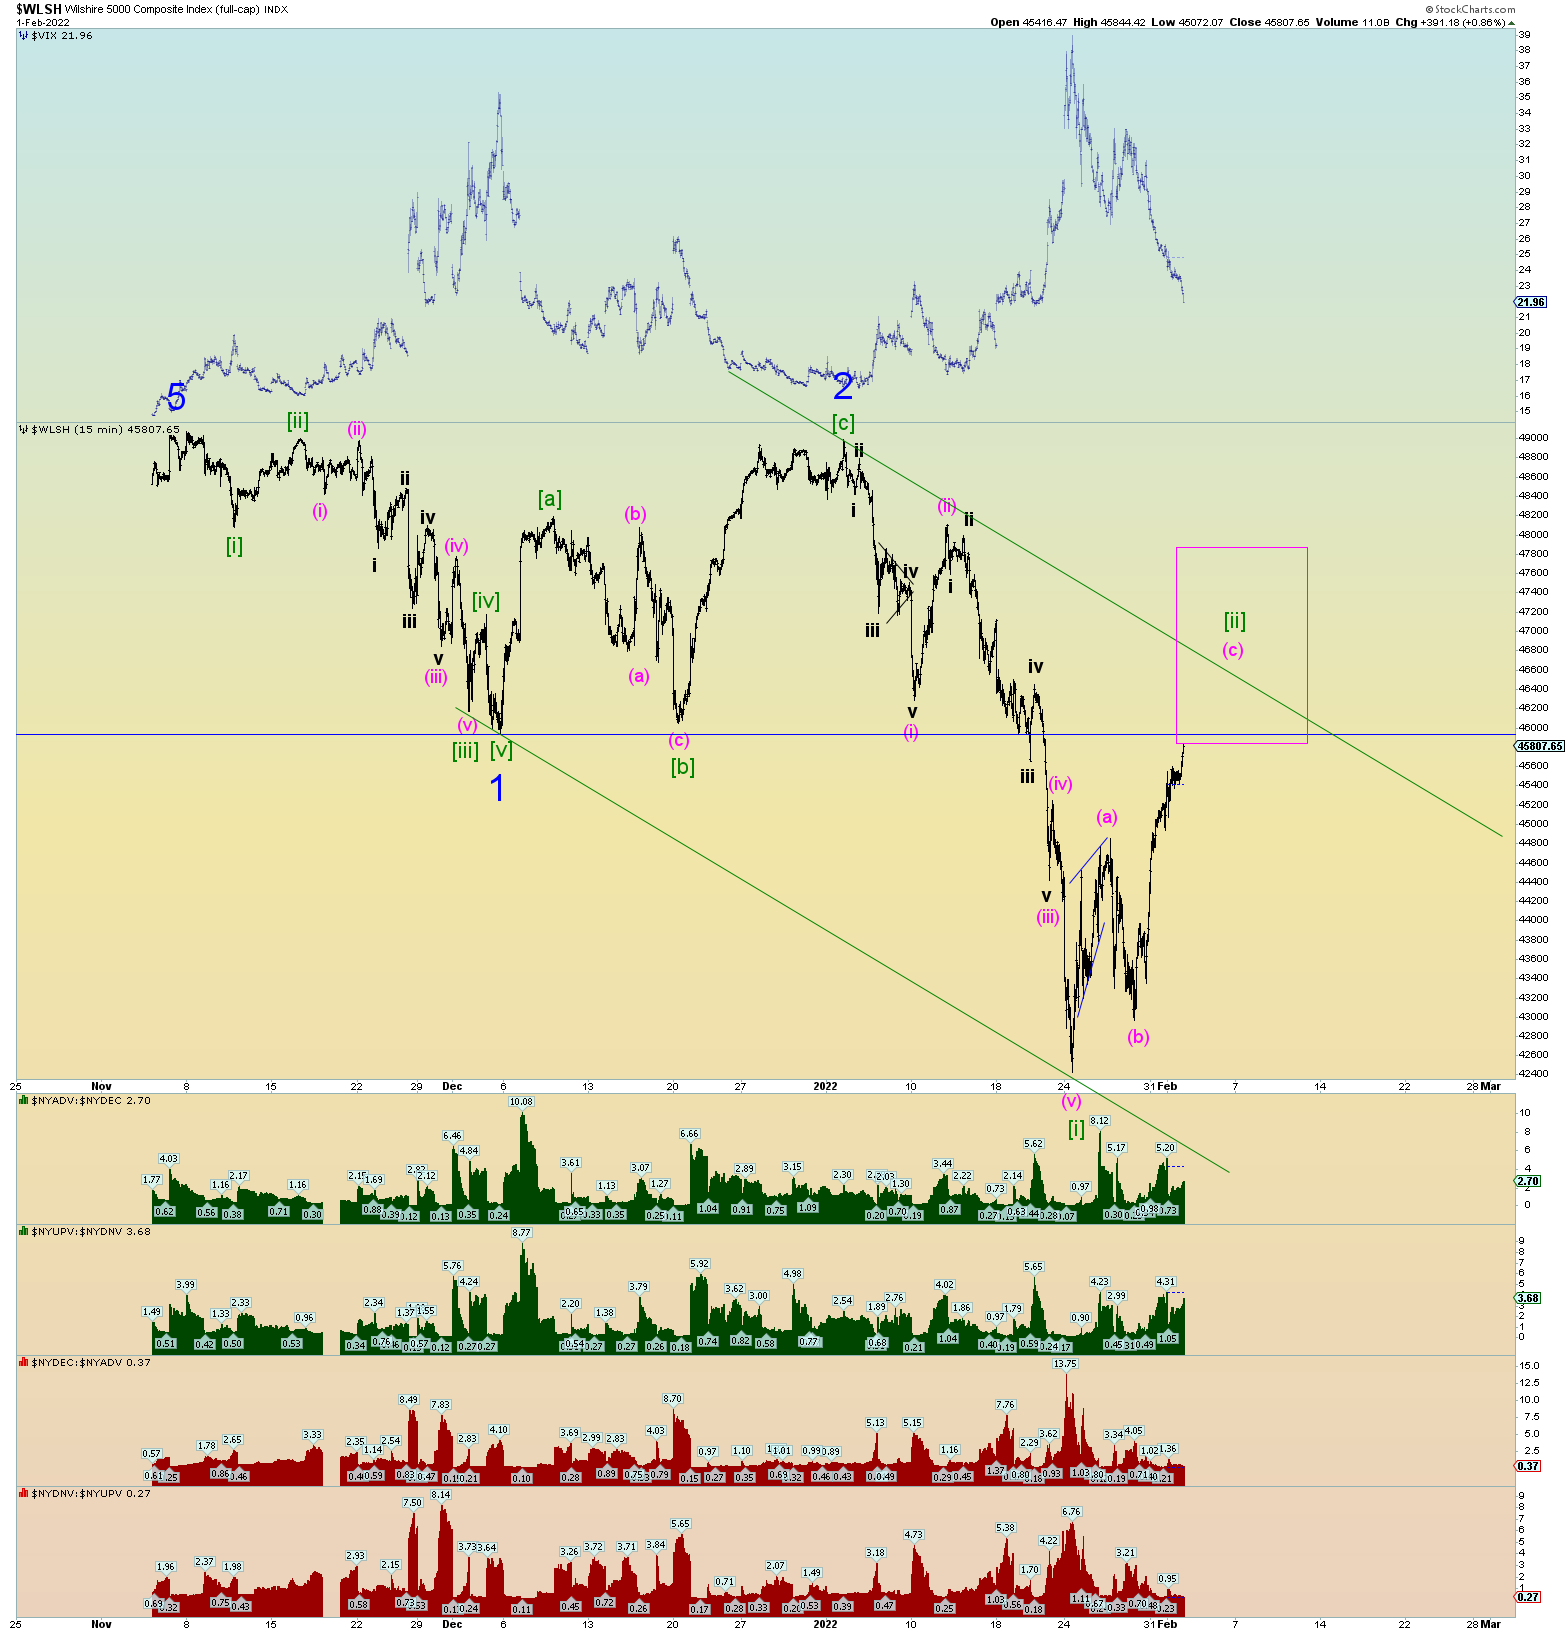
If a 1 – 2, [i] – [ii] count, then a backtest of the long-term upper channel line will be a target.
The bullish option count I mentioned is best shown using the DJIA as it has retraced almost a Fibonacci 61.8% from its peak. Again, I keep mentioning June 2022 is about when the world starts falling apart so maybe the market holds up a few more months as a result. We’ll see. But so far, we have not had a solid five wave down move and certainly internal market measures have not been extreme to the downside. We haven’t had a 90% downside volume day for instance. However, it’s not required.
There are many possibilities with the overall wave structure. But the key point is that there is not yet a conclusive overall 5 wave pattern down on any index yet.
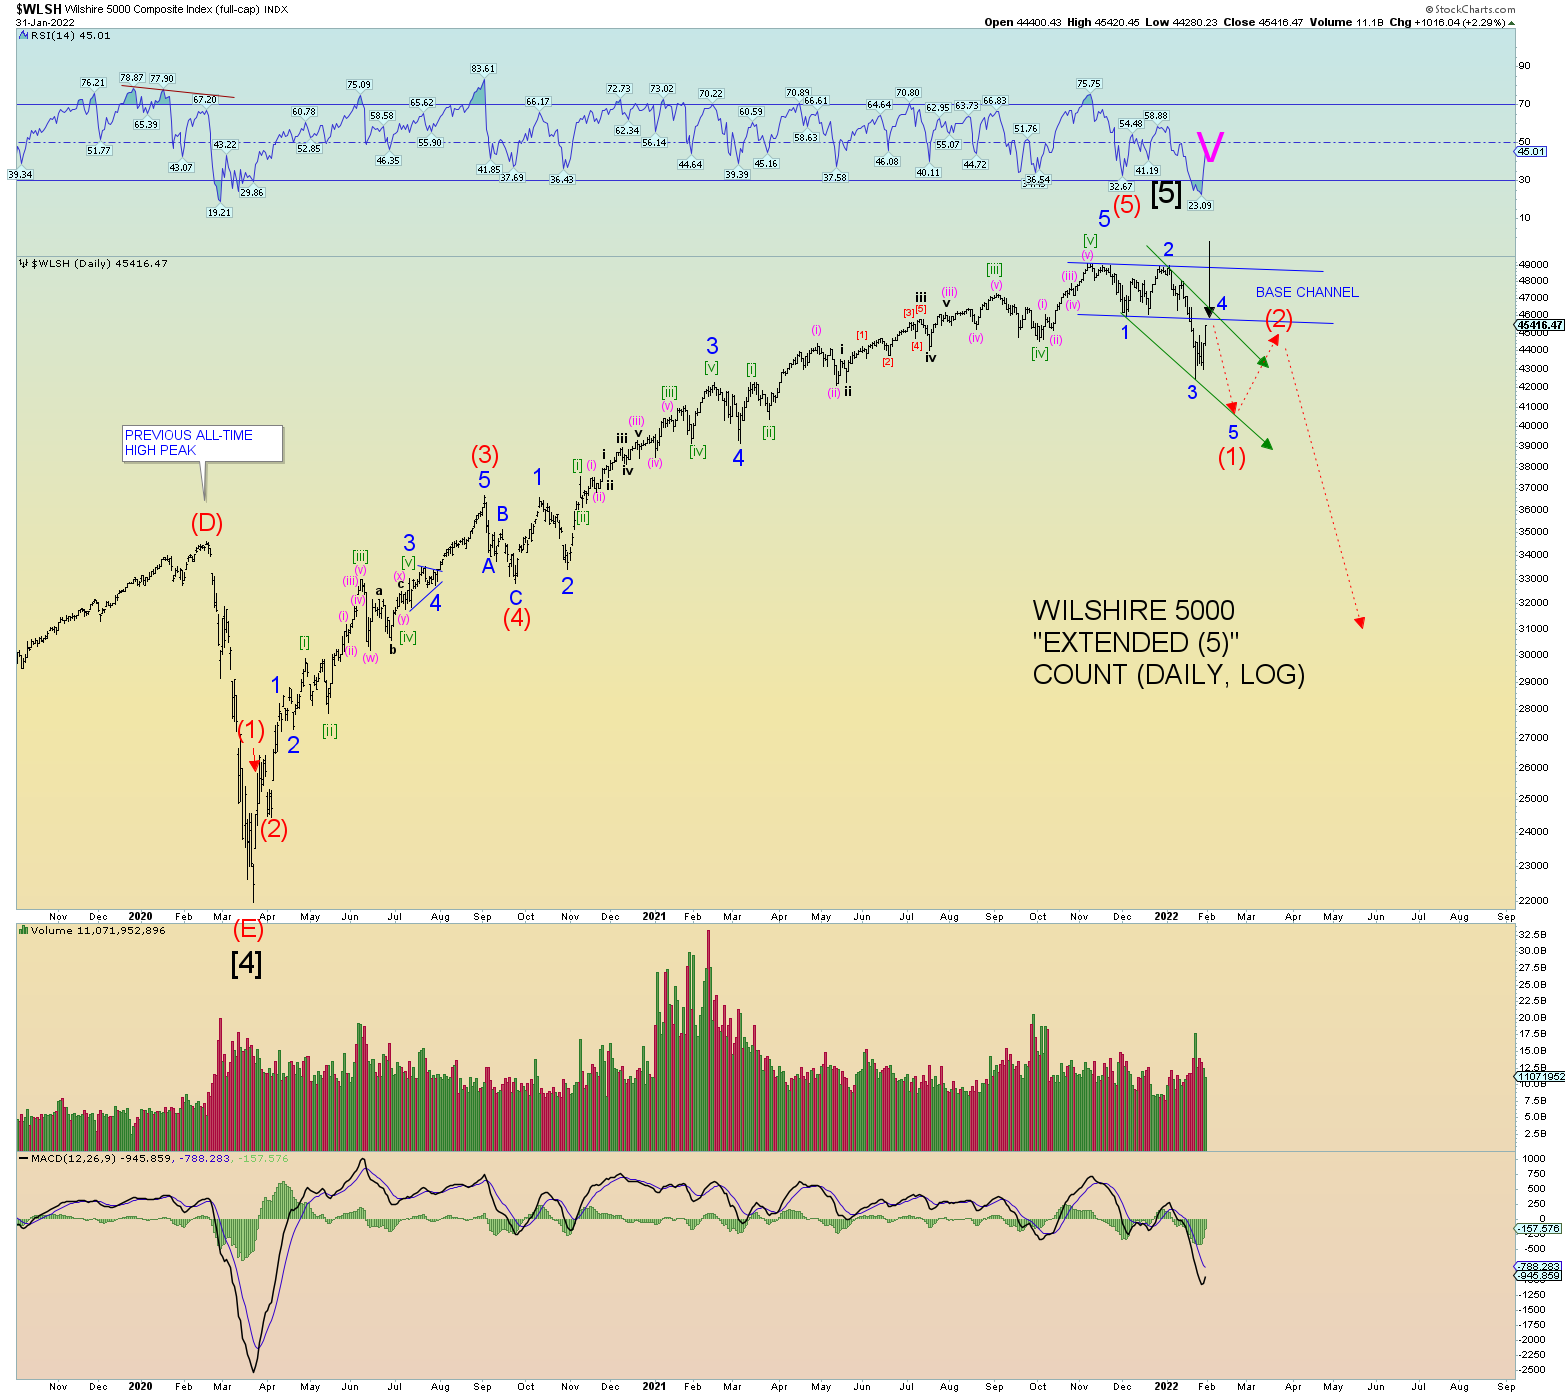
The next few charts show the thinking of potential counts. The first chart is the simplest using the Wilshire 5000. We had a wave 1 – 2 forming a “base channel”, then perhaps wave 3 forming an acceleration channel down, and now wave 4 in the process of a “backtest” of the base channel. Then another lower low would follow forming wave 5 of (1) down.
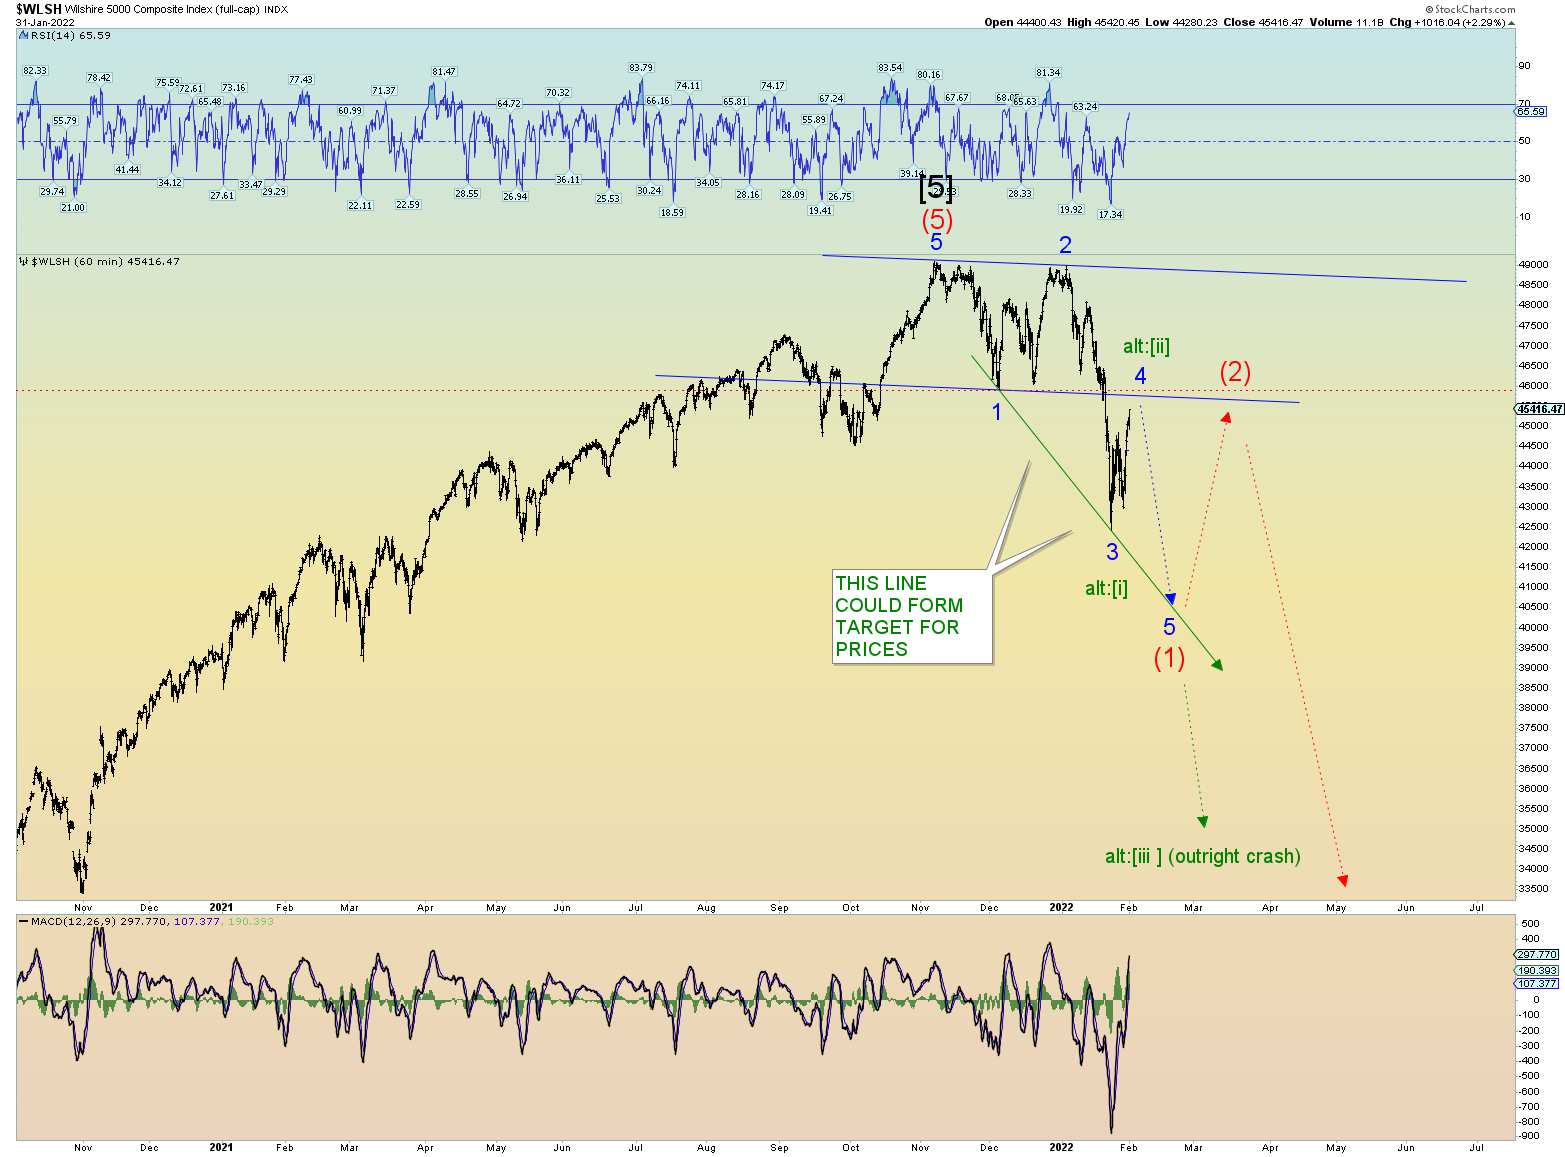
There are of course variations on the above. The next chart includes the alt [i] low and now the market is bouncing in alt [ii]. This is a much more aggressive count. Wave [ii] could very well overlap with Blur Minor 1.
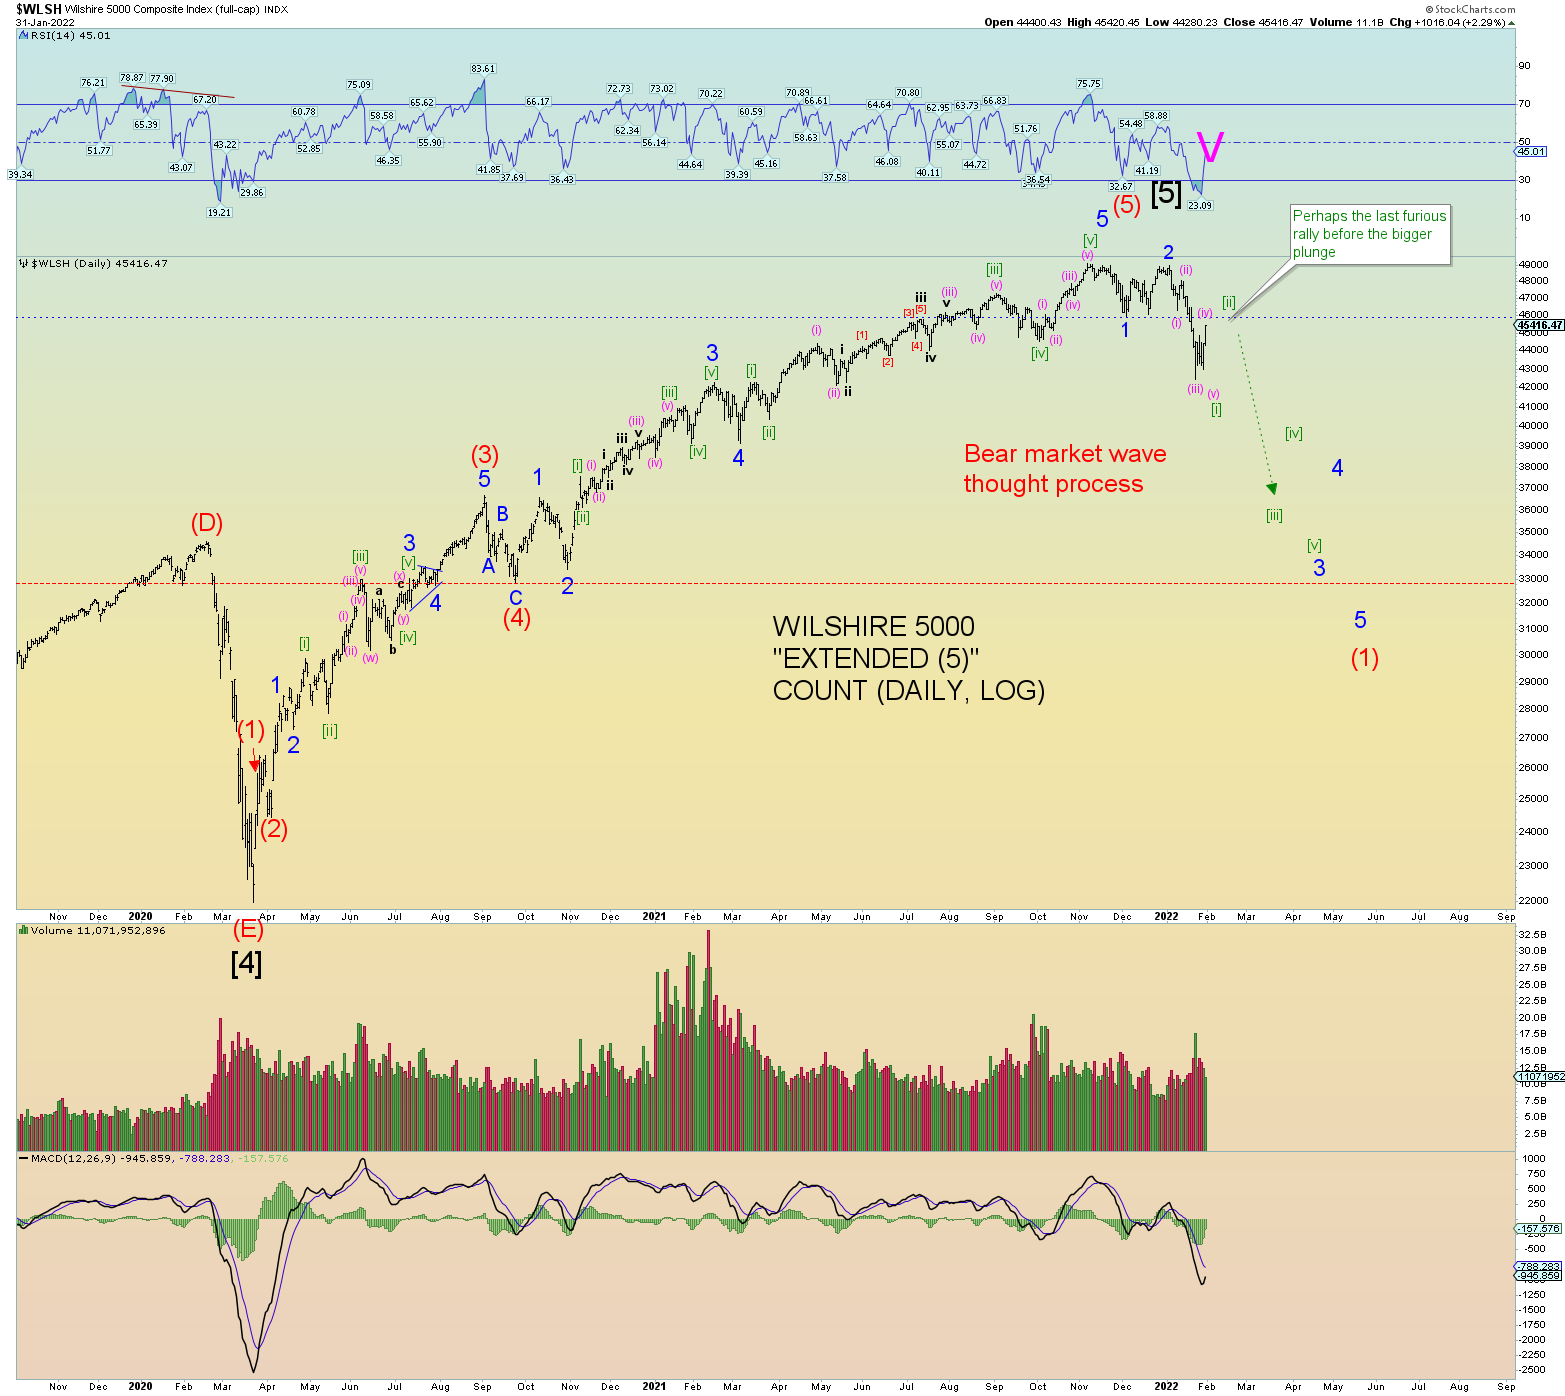
And another view showing a more bearish view of red Intermediate (1) down and some slight internal count variations.
The S&P has its own thing going on as does the NASDAQ and INDU. I show the SPX. I could have given this a few variations, but you get the idea. I realize the wave degrees don’t match well with the Wilshire but ignore that for now the wave structure is what’s important at the moment. We can figure out the wave degrees once a solid structure has formed.
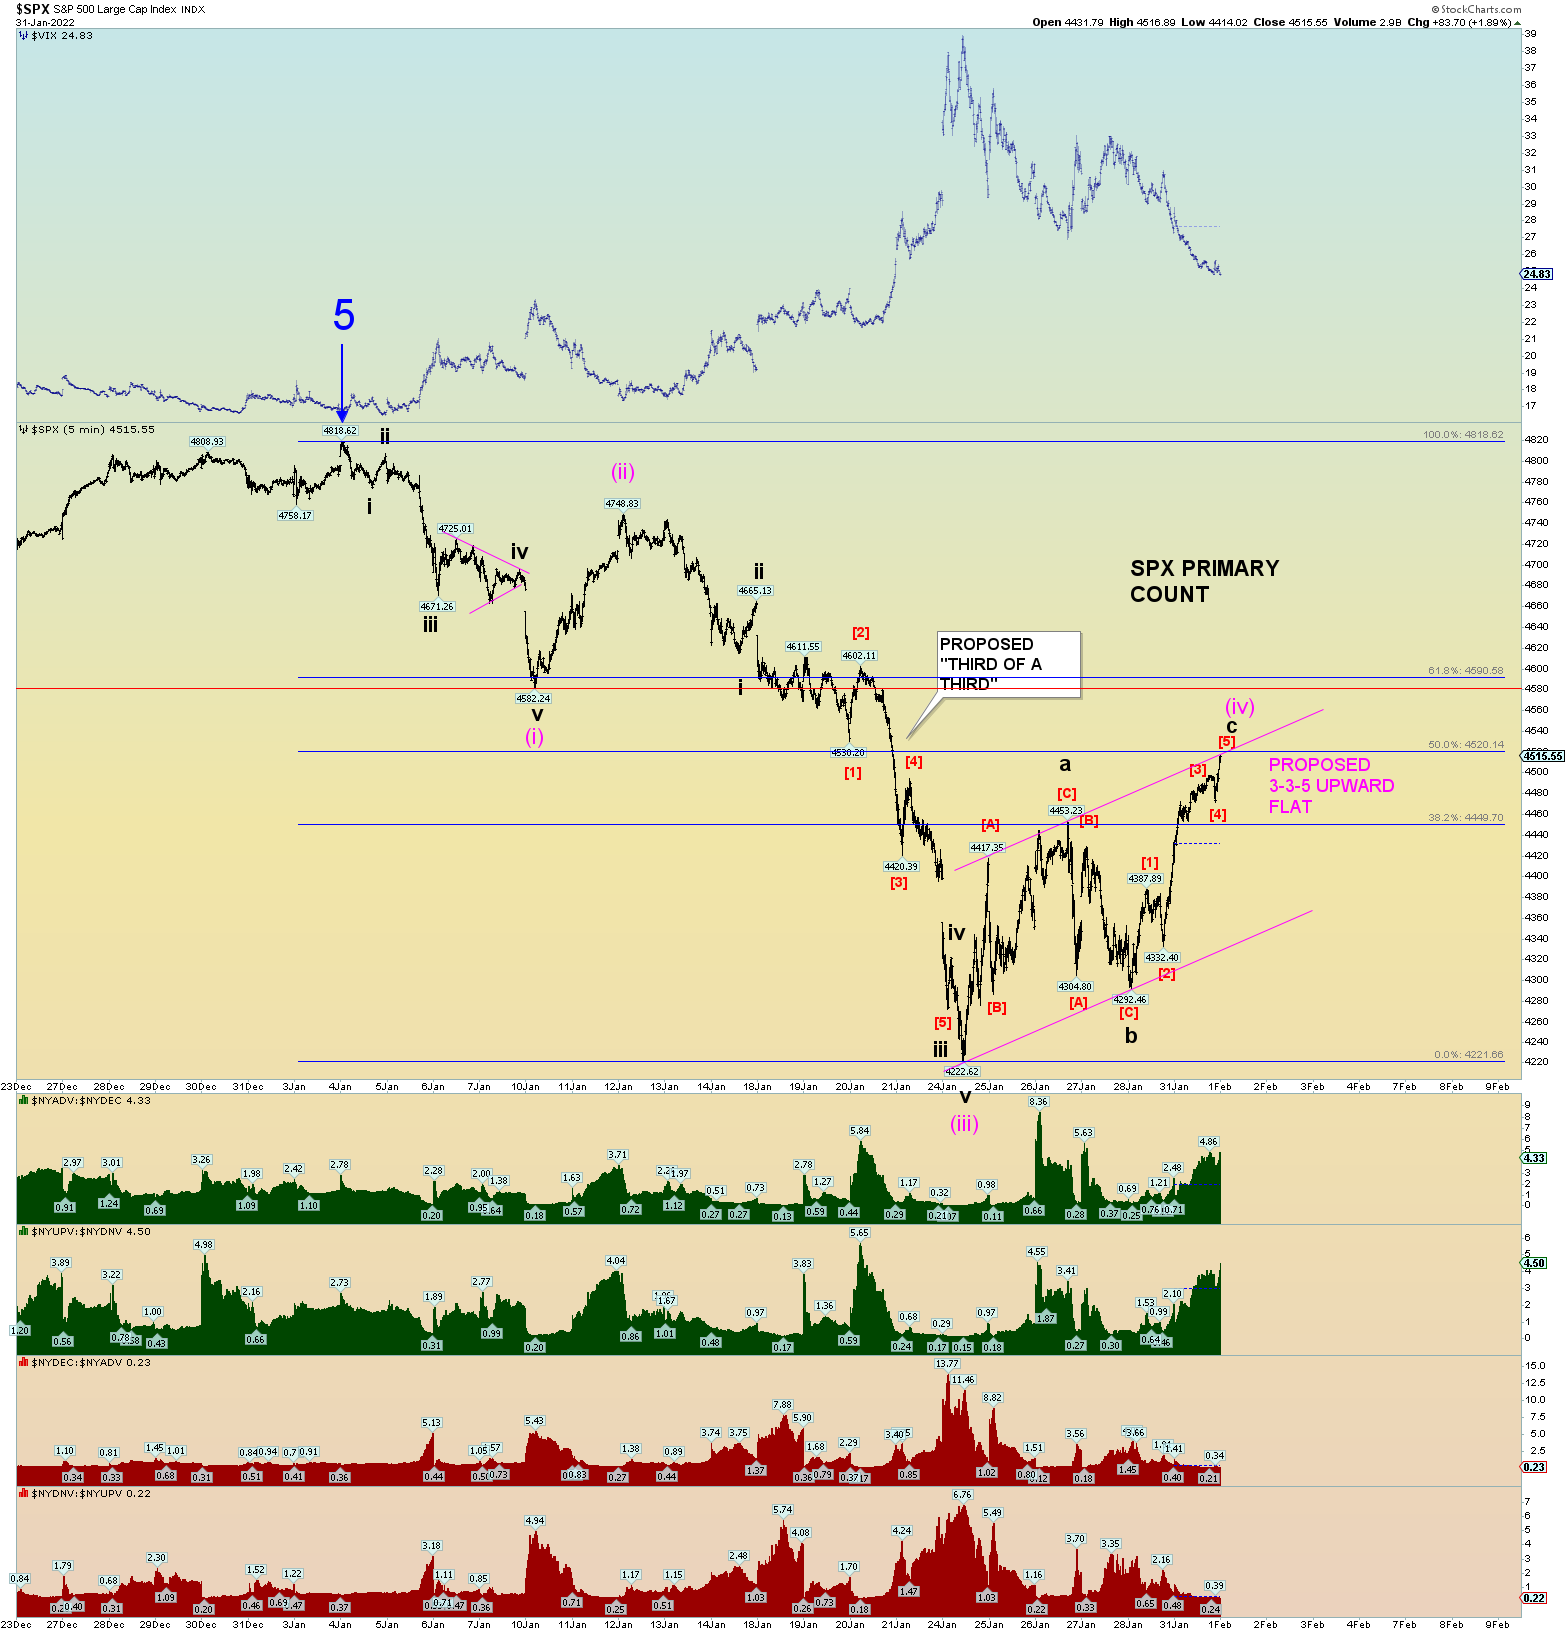
The bottom line is the market at some point requires a lower low to form a bear wave down.
And the FED does not set the (market) interest rates, rather they follow the market. It’s pretty simple: when the 3-month Treasury and 6-month Treasury move (mainly the 3 month), the FED HAS to move with it. I don’t know all the intricate reasons why, but from a layman standpoint it makes perfect sense:
The FED cannot let the FED FUNDS rate differ widely from what the short-term lending market sets or you would have all kinds of perverse arbitrage and market distortions. The MASSIVE interest rate credit derivative swaps market wouldn’t work correctly. And for all intents and purposes, the 3-month treasury is probably the best indicator. If the 3-month rate is .25 or .30 or higher, you can bet the FED will follow and raise rates to keep matching it.
At this rate, I expect indeed the FED to raise rates in March unless these moves suddenly reverse sharply to near zero. Keep an eye on this chart and you will know better than all the gurus on what the FED will do next.
Higher interest rates will CRASH the entire PONZI scheme financial system and cause massive deflation. Oh, you’ll still be paying $18 for lb of ribeye steak (the little guy will get screwed) and $5 for a gallon of gas.
Inflation is not just a result of monetary policy. There is also supply and demand. And we all know they BROKE the supply side of things on purpose. So don’t confuse the two aspects of inflation/deflation. I used to blog about a deflationary collapse with inflationary consumer goods at the lower end. Both are possible.
So as the mom-and-pop stores go under some more, certain corporations will be huge losers. Lots of job losses. Governments and municipalities defaulting on debt. You get the picture.
For example, deflation might result in seeing the NFL (and NBA, NHL, MLB etc.) reduced from 30 teams to 24 (or whatever) due to financial losses eventually incurred when global unemployment skyrockets and the fan base dries up as corporations’ default and go bankrupt and people have no income to spend on overpriced sporting events. Yet if you DO go to the game, you’ll still pay $20 for a piss warm beer.
The whole thing is a time bomb and consumers are in credit card debt up to their ears. They will be the first to IMMEDIATELY feel the effect of higher interest rates. Banks will raise credit card rates THE SAME DAY the FED sets a higher FED funds rate.
The elite don’t care now that they own everything. So what if they lose billions? They’ll still claim the deed to your property and own the power of governments to threaten violence upon you to be removed or jailed or killed.
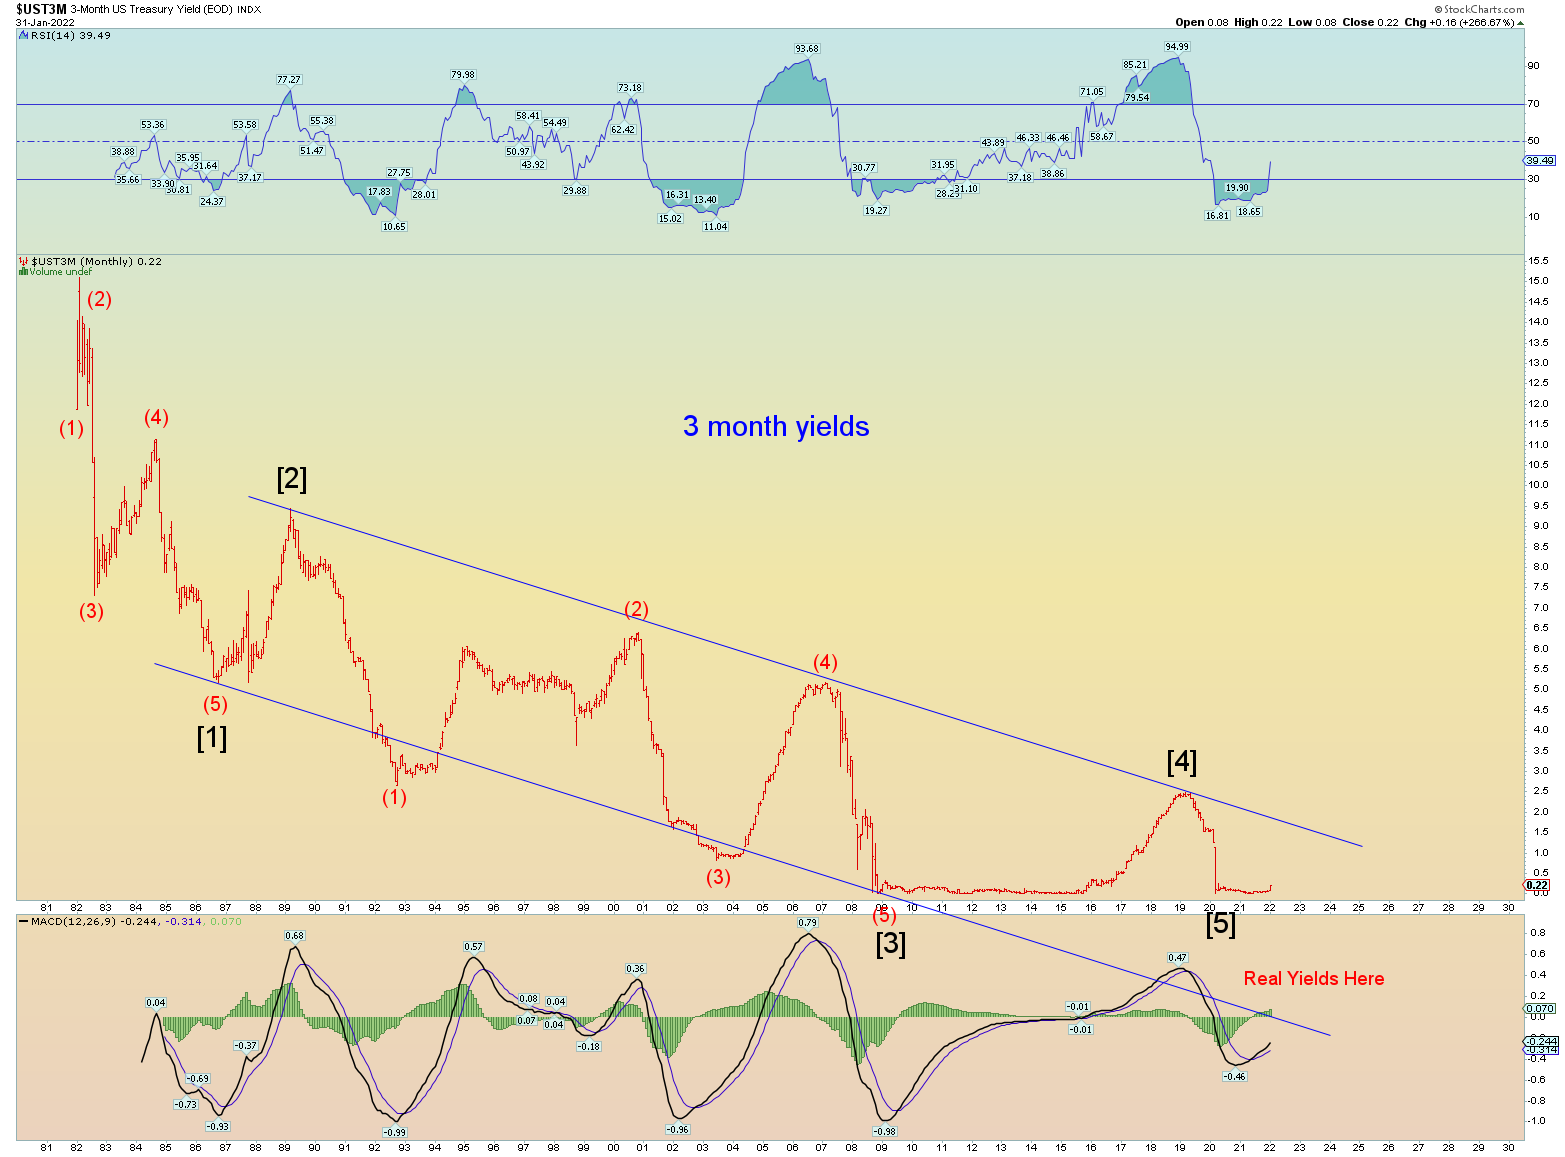
Why will this sucker reverse and head higher? Well, a 40+ year down channel has no more room to down channel any longer. This down channel IS the PONZI system. The PONZI needed lower and lower rates for the debt scheme to keep working. Now that we are out of “fools” to add to the Ponzi scheme, the jig is up. The elites know it. The FED knows it. This “plandemic” was all about control of the people for the coming financial system collapse.
Klaus Schwab really does want you eating bugs, living in a cement one-room apartment with no car, or better yet dead from a “vaccine”.
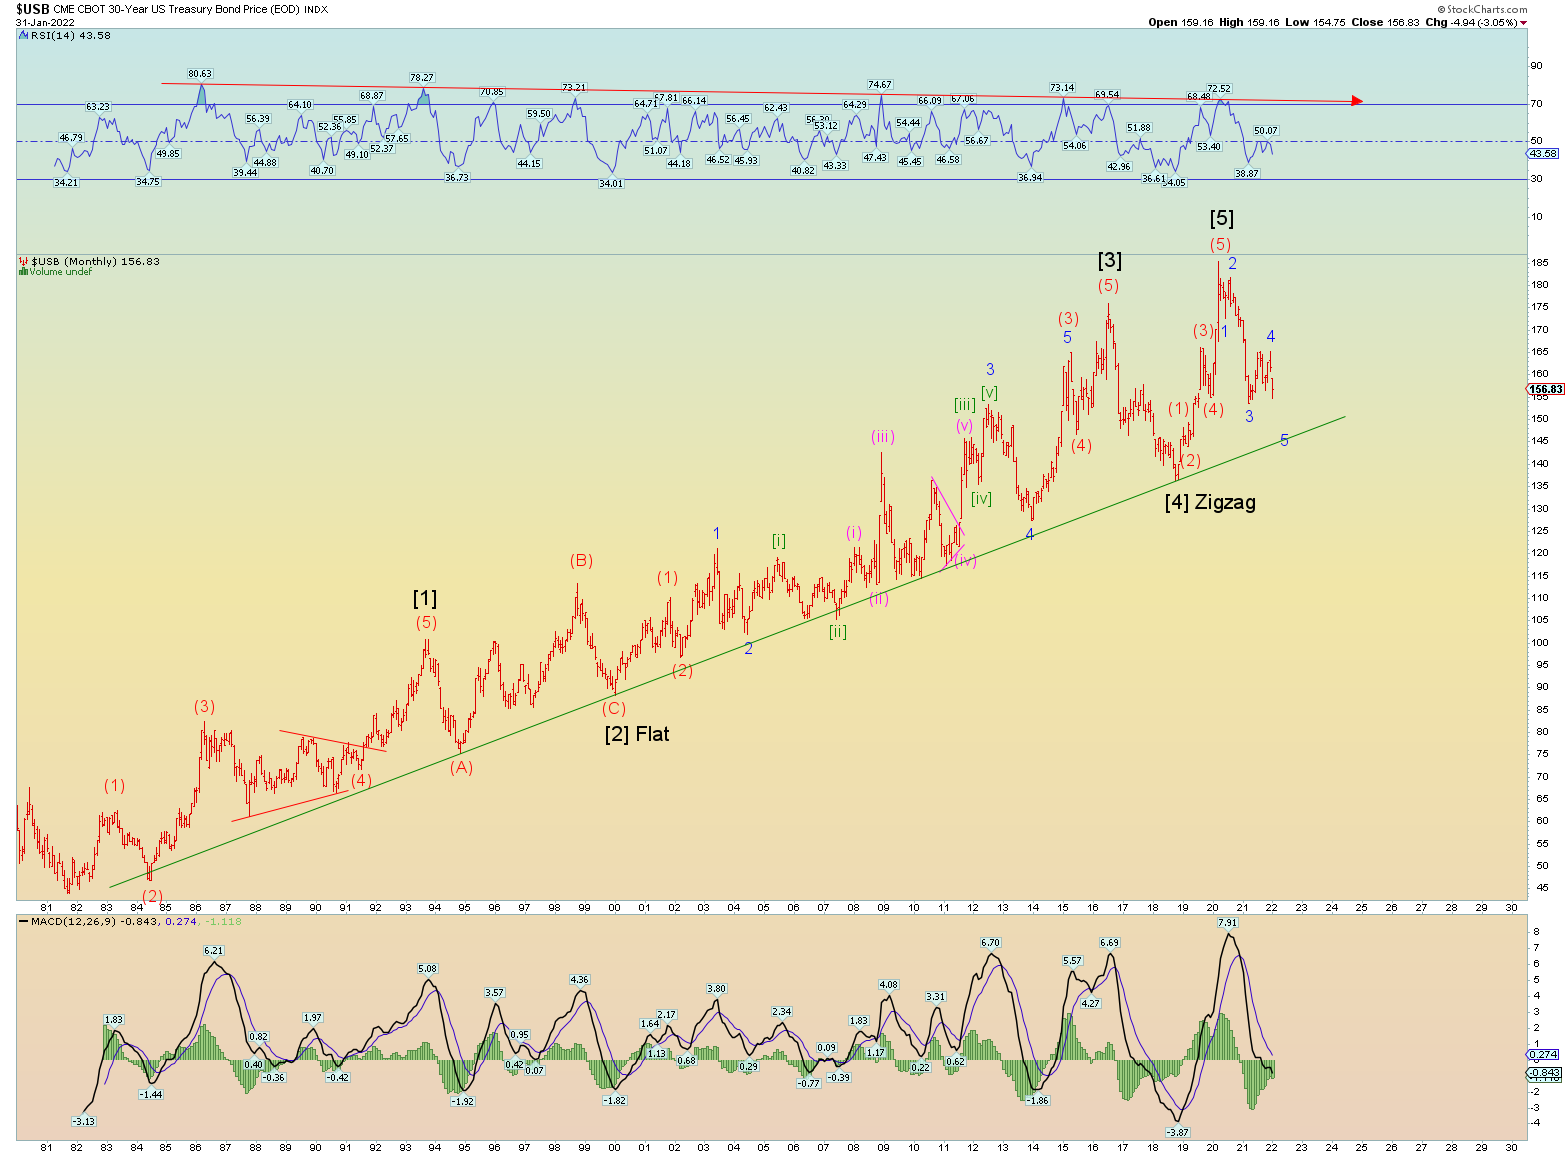
Massive warfare is coming once the worldwide Ponzi financial system collapses. My best guess for warfare is still a projection of June/July/August 2022….this year when the weather gets warmer. Wars always start in the Spring/summer.
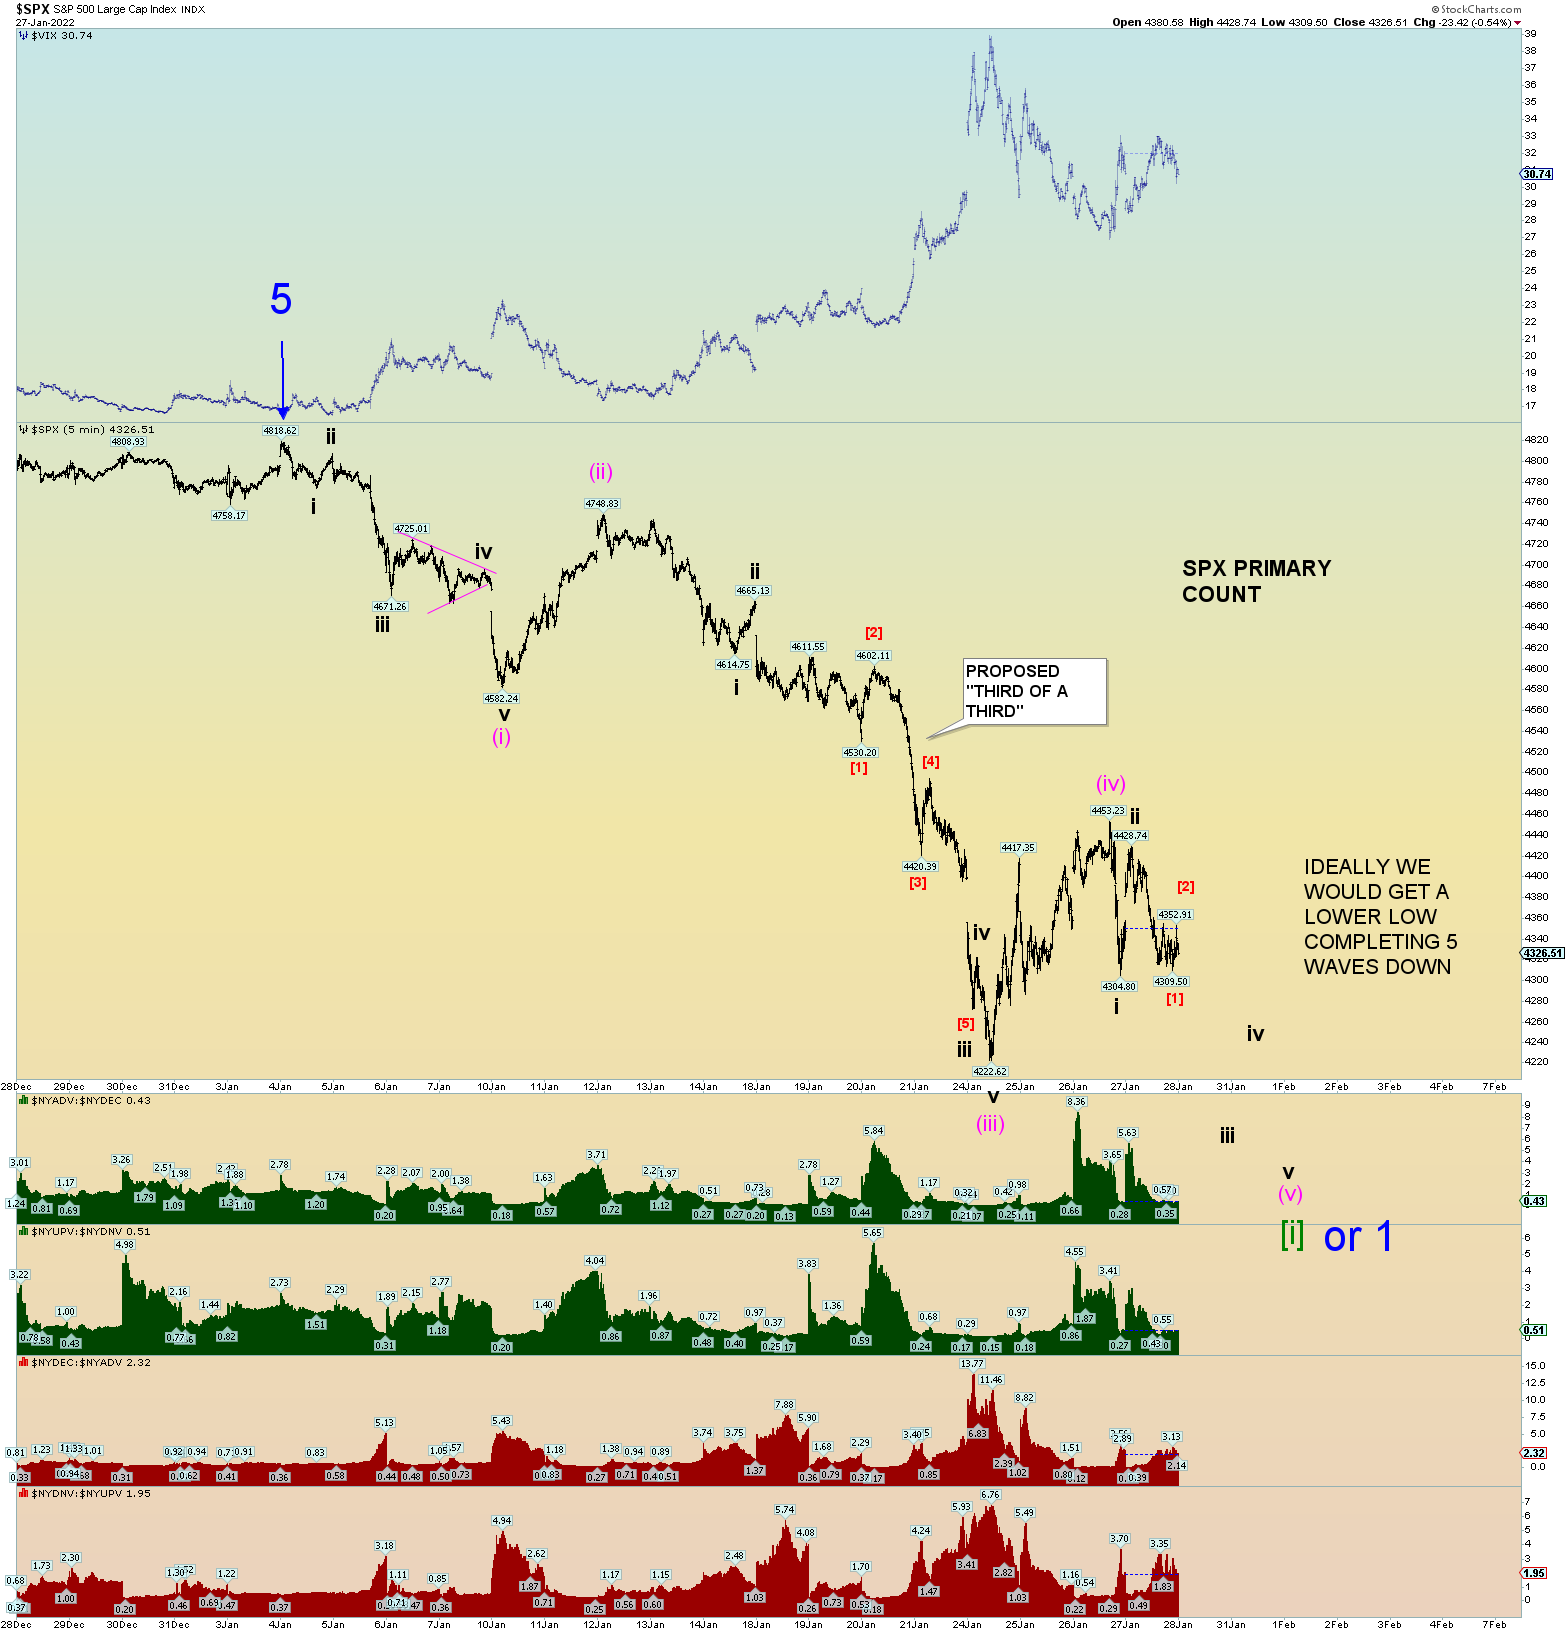
The primary count is that the market is working lower to form an overall initial impulse 5 wave count. The SPX is the best index for illustrative purposes. It has a very different starting peak than the Wilshire 5000.
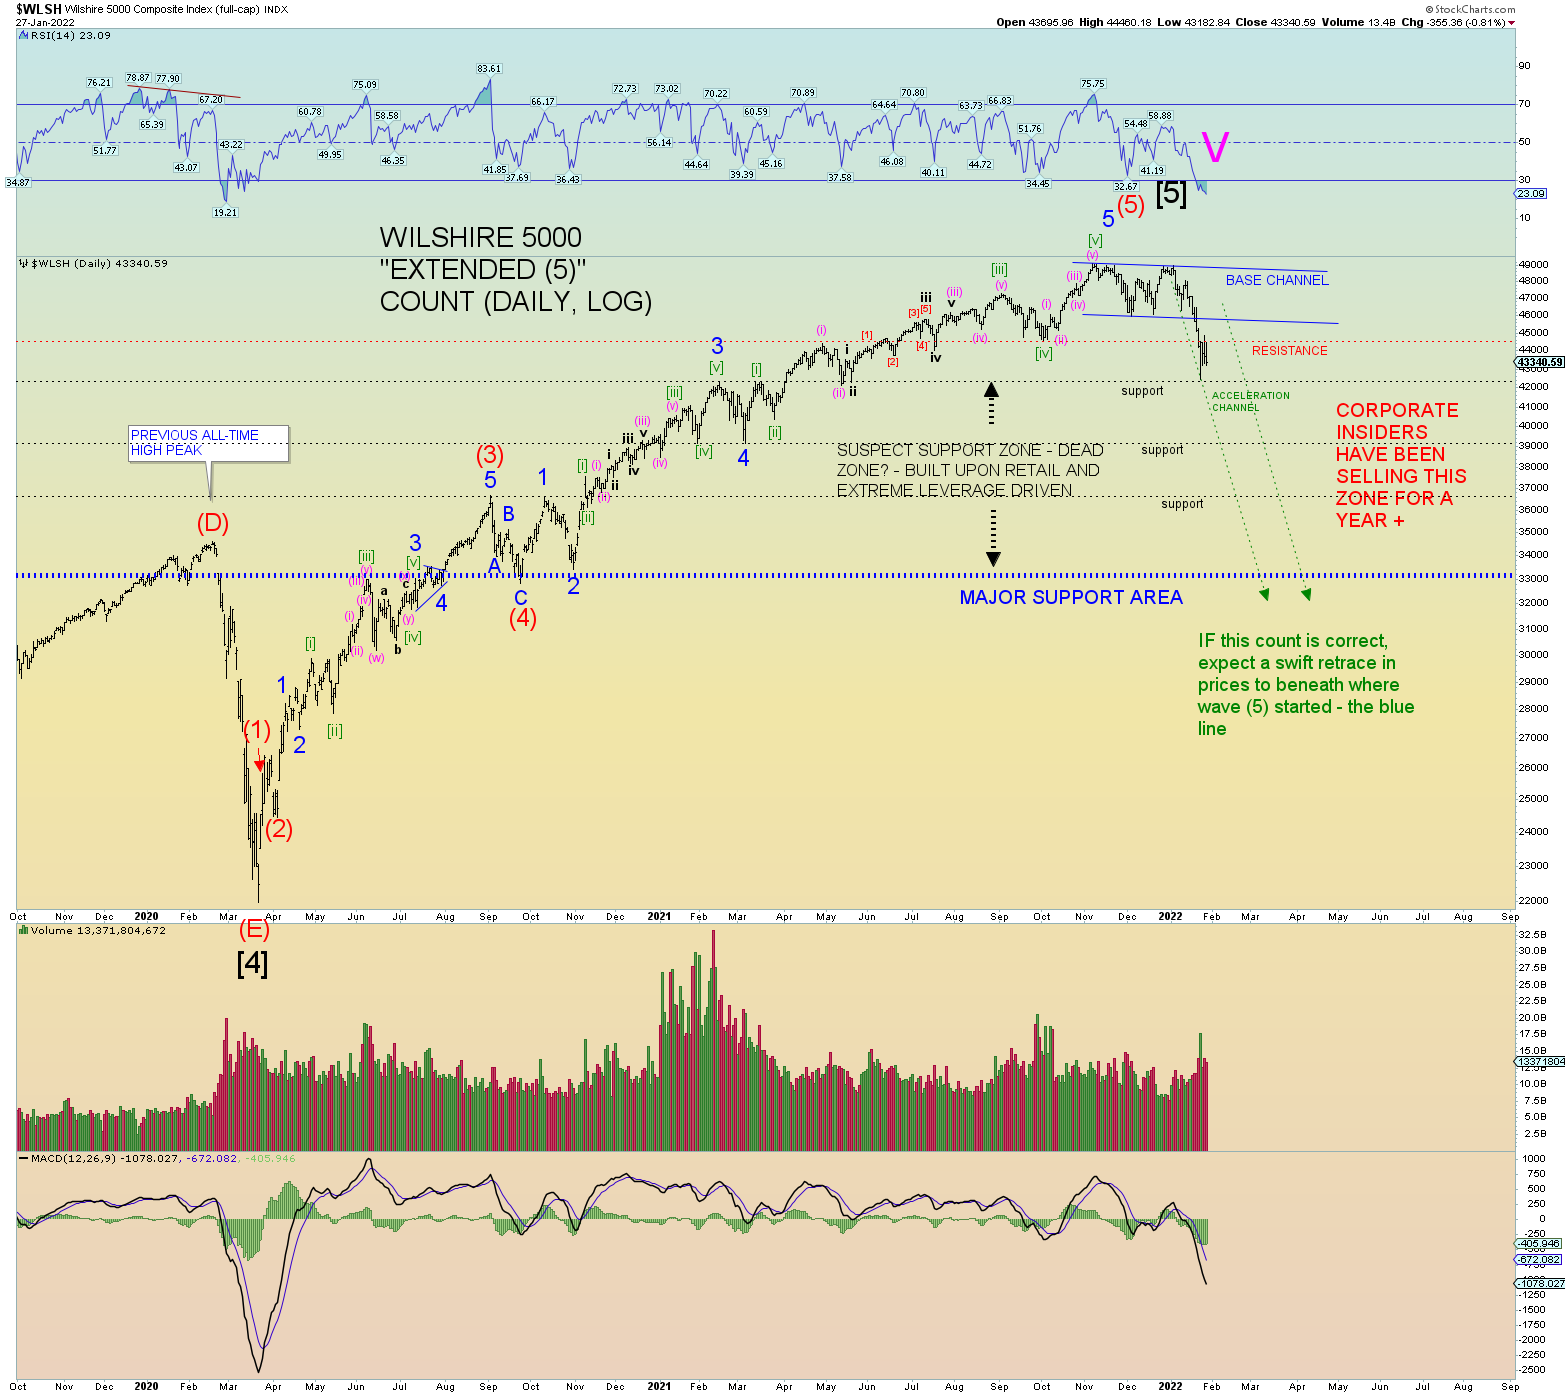
Overall, for the Wilshire 5000, the bigger picture projected for the next few months is a collapse in prices. The theory is that if Intermediate red wave (5) was indeed an extended, ridiculous wave structure built on leverage and retail buying, the pattern predicts that a swift retrace of prices to beneath where wave (5) started would be the next wave structure (which has begun). This following chart shows that potential.
The green down channel represents the acceleration channel of a wave 3 down move. For now, I painted it wide to give the benefit of the doubt for the market as there may be a more violent bounce than so far has happened. Note how the collapse in March/April 2020 was also very steep and (even more) narrow. It is an example of how fast the market can move to the downside. I am not making any predictions for now other than we have to rely on the wave structures as it goes.
However, as I said, if the market was in an extended (5), expect a swift collapse in prices. It would be an approximate 33% down move from absolute peak for the first Intermediate wave (1) down. Wave (5) up was built exclusively on retail and extreme market leverage so extreme leverage works the same in reverse and usually way more deadly. Again, note the steep, fast 2020 collapse in prices which everyone has forgotten apparently. Therefore wave (1) down will basically be a retrace of wave (5) up and a little more for good measure. That’s the theory anyway.
I would expect JUNK to lose quite a bit also.