MARKET COMMENTARY
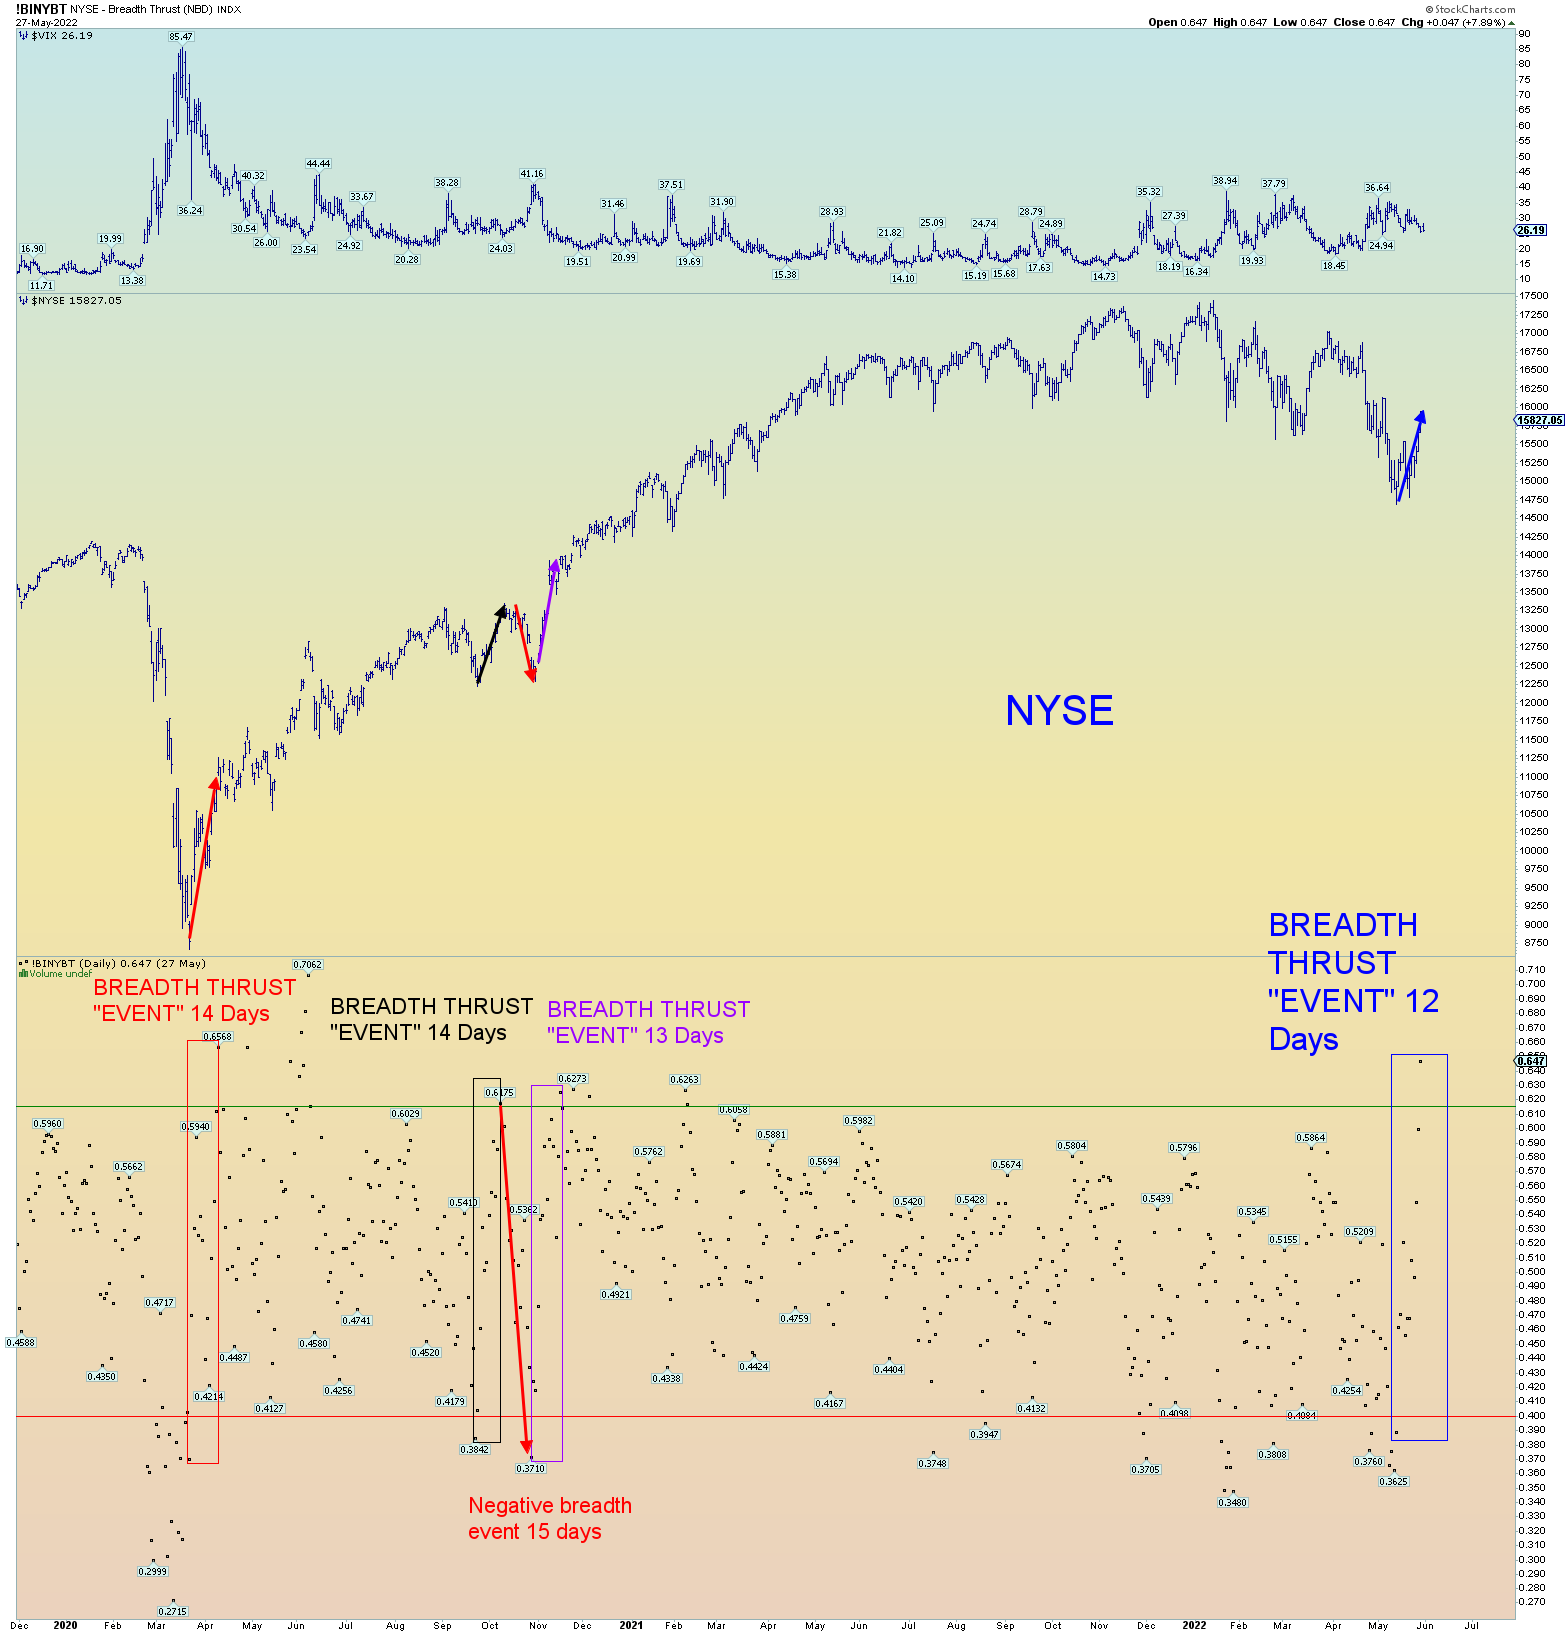
The New York Stock Exchange experienced a “breadth thrust” event last Friday. In fact, it was the fastest and maybe the strongest breadth thrust event since the March 2020 low. It would probably take a negative breadth thrust event to cancel it out and drive prices down in Intermediate 3 of (3). But before that can happen, the market needs to find the top of proposed Minor 2 first.
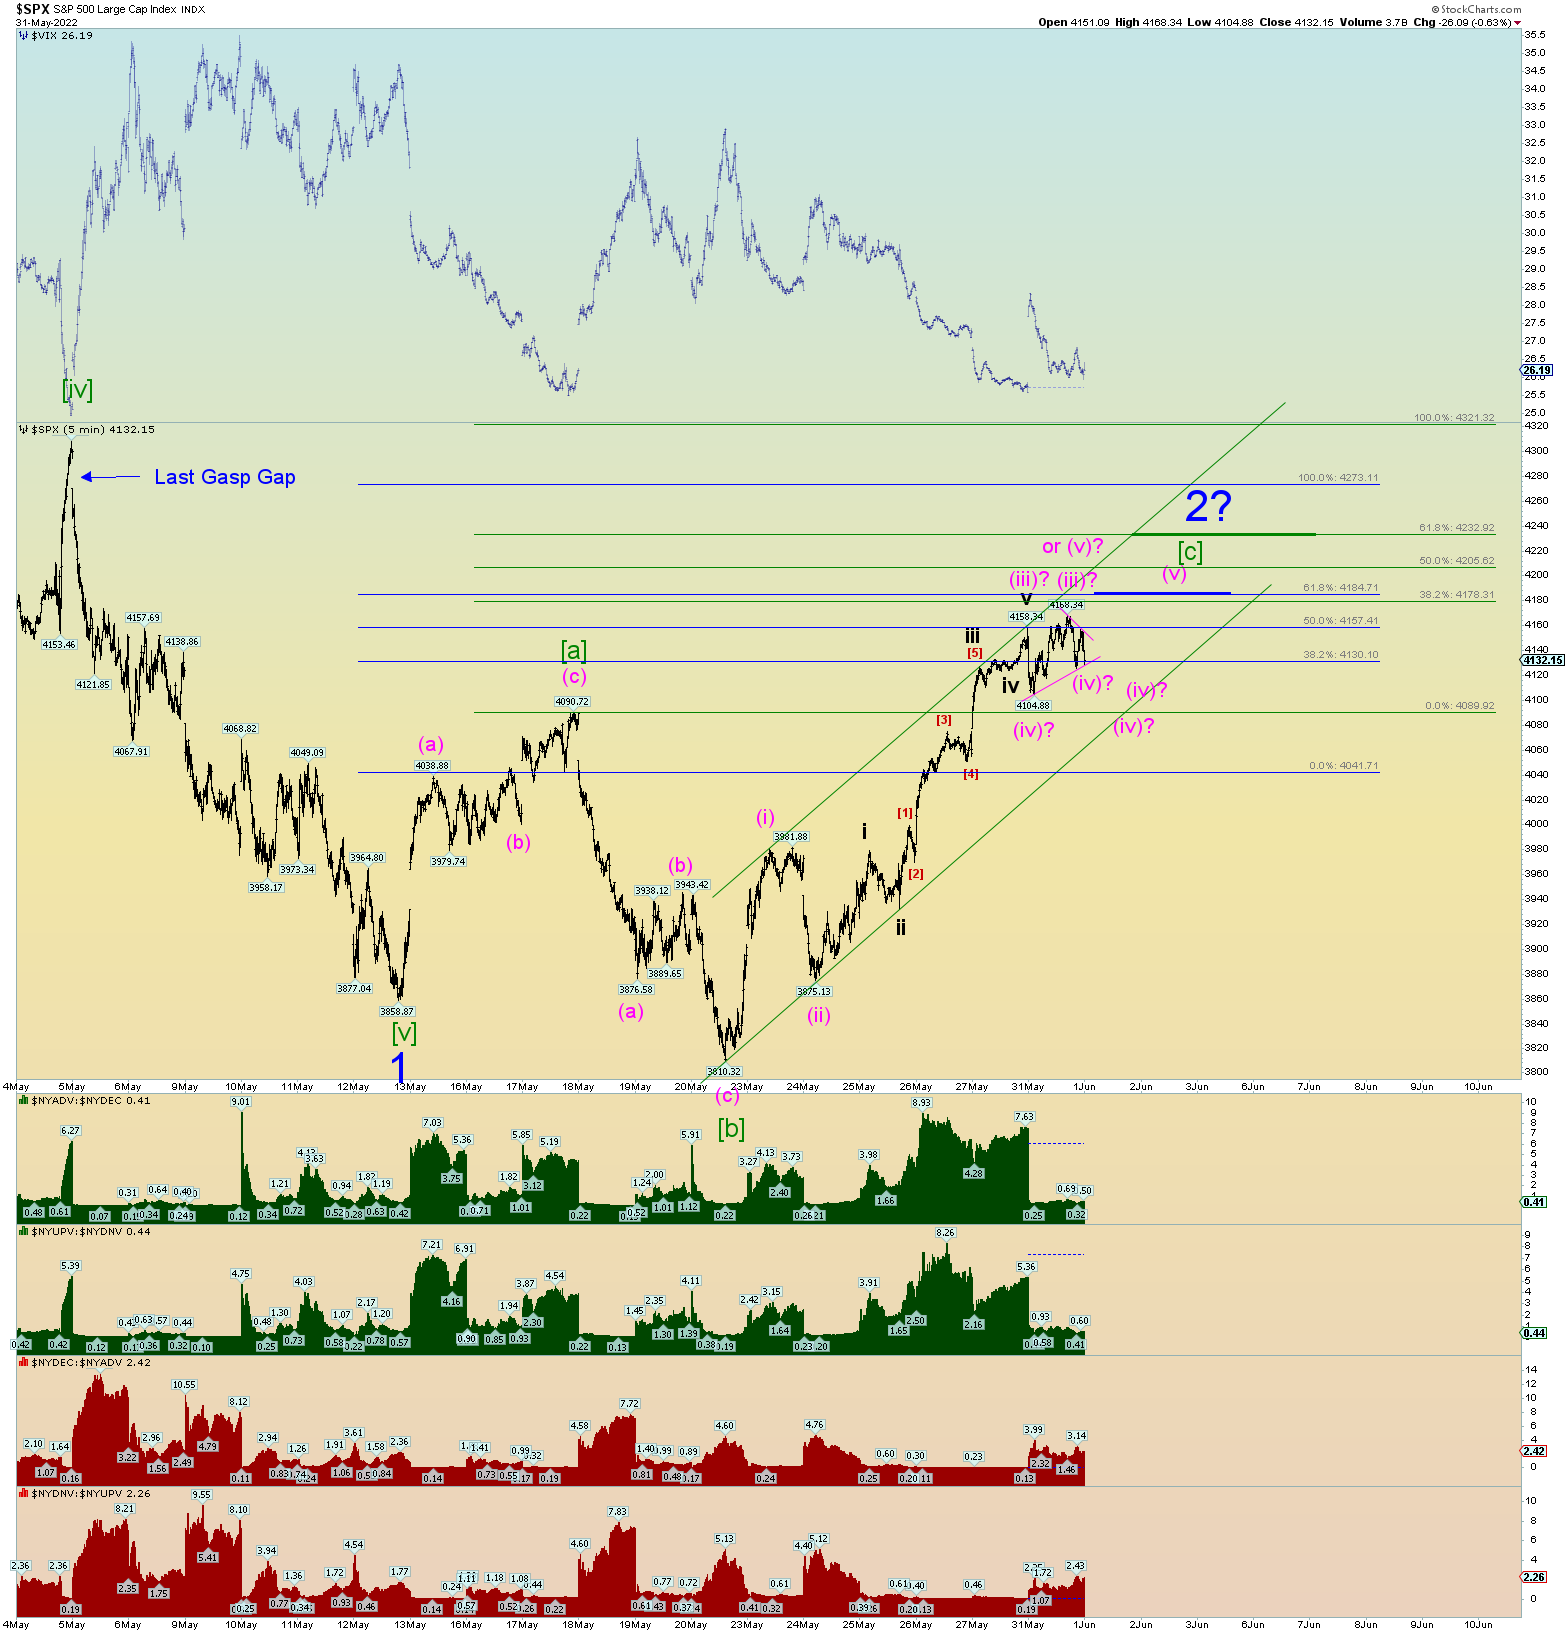
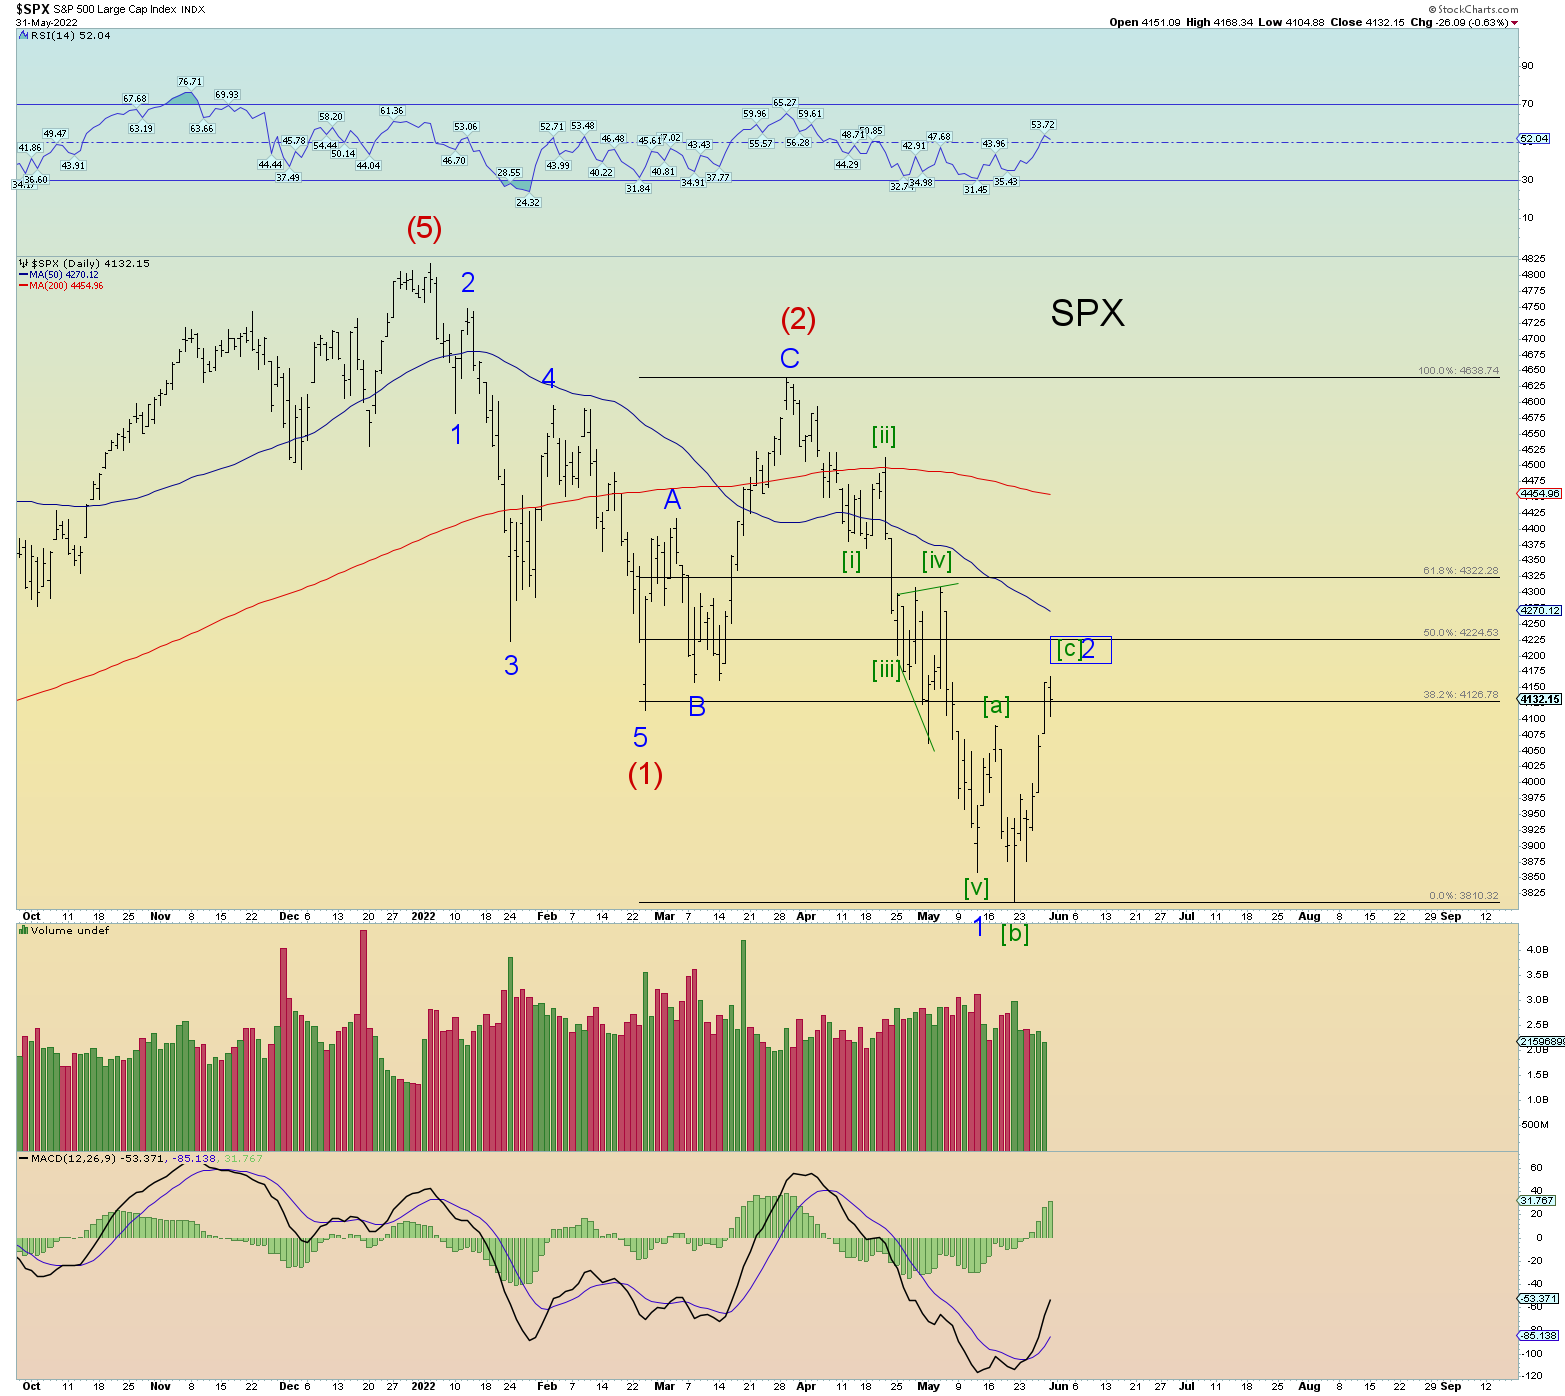
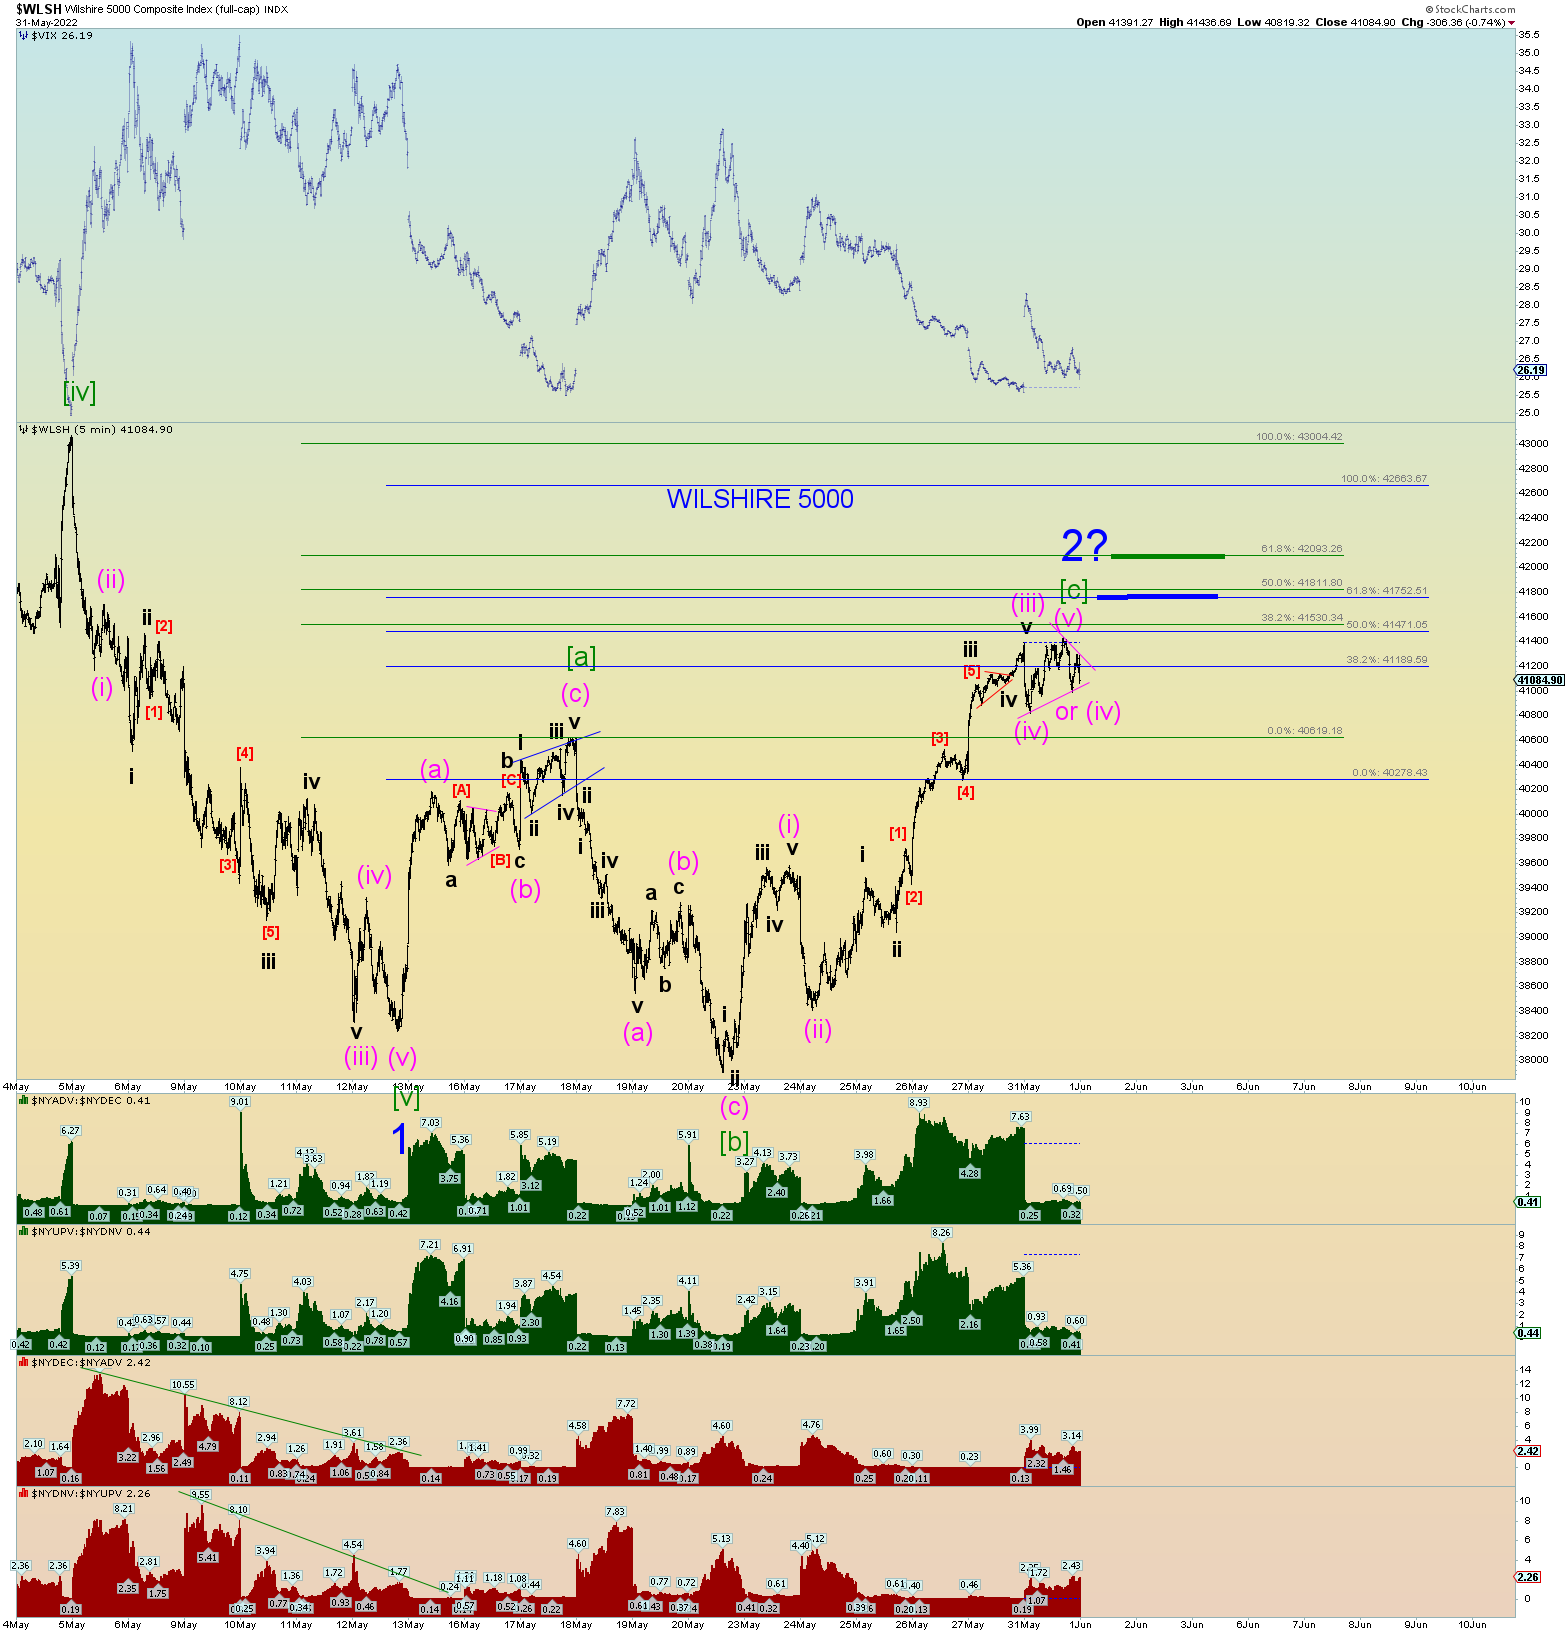
The following SPX chart sums up the short-term squiggles. In other words, there is a bunch of squiggle options. It may resolve itself by end of day tomorrow.
The ideal target range for the SPX expanded Minor 2 flat is 4185 – 4233. Considering today closed at 4132, there is a potential 100-point uprising left in the market.
Again, the NYSE’s breadth thrust event. There is an excellent track record for these events including events that occurred in the past 20 years. This is why I would think it’ll take a negative event of a more extreme to negate the positive event. A plunge in breadth to the downside. If we are soon to start Minor 3 of (3) down, then this is to be expected. We’ll see, I guess.
At the moment, this is a very strong reason for the bullish case of potential much bigger upside in prices to come. The next 10 – 12 days will be telling.
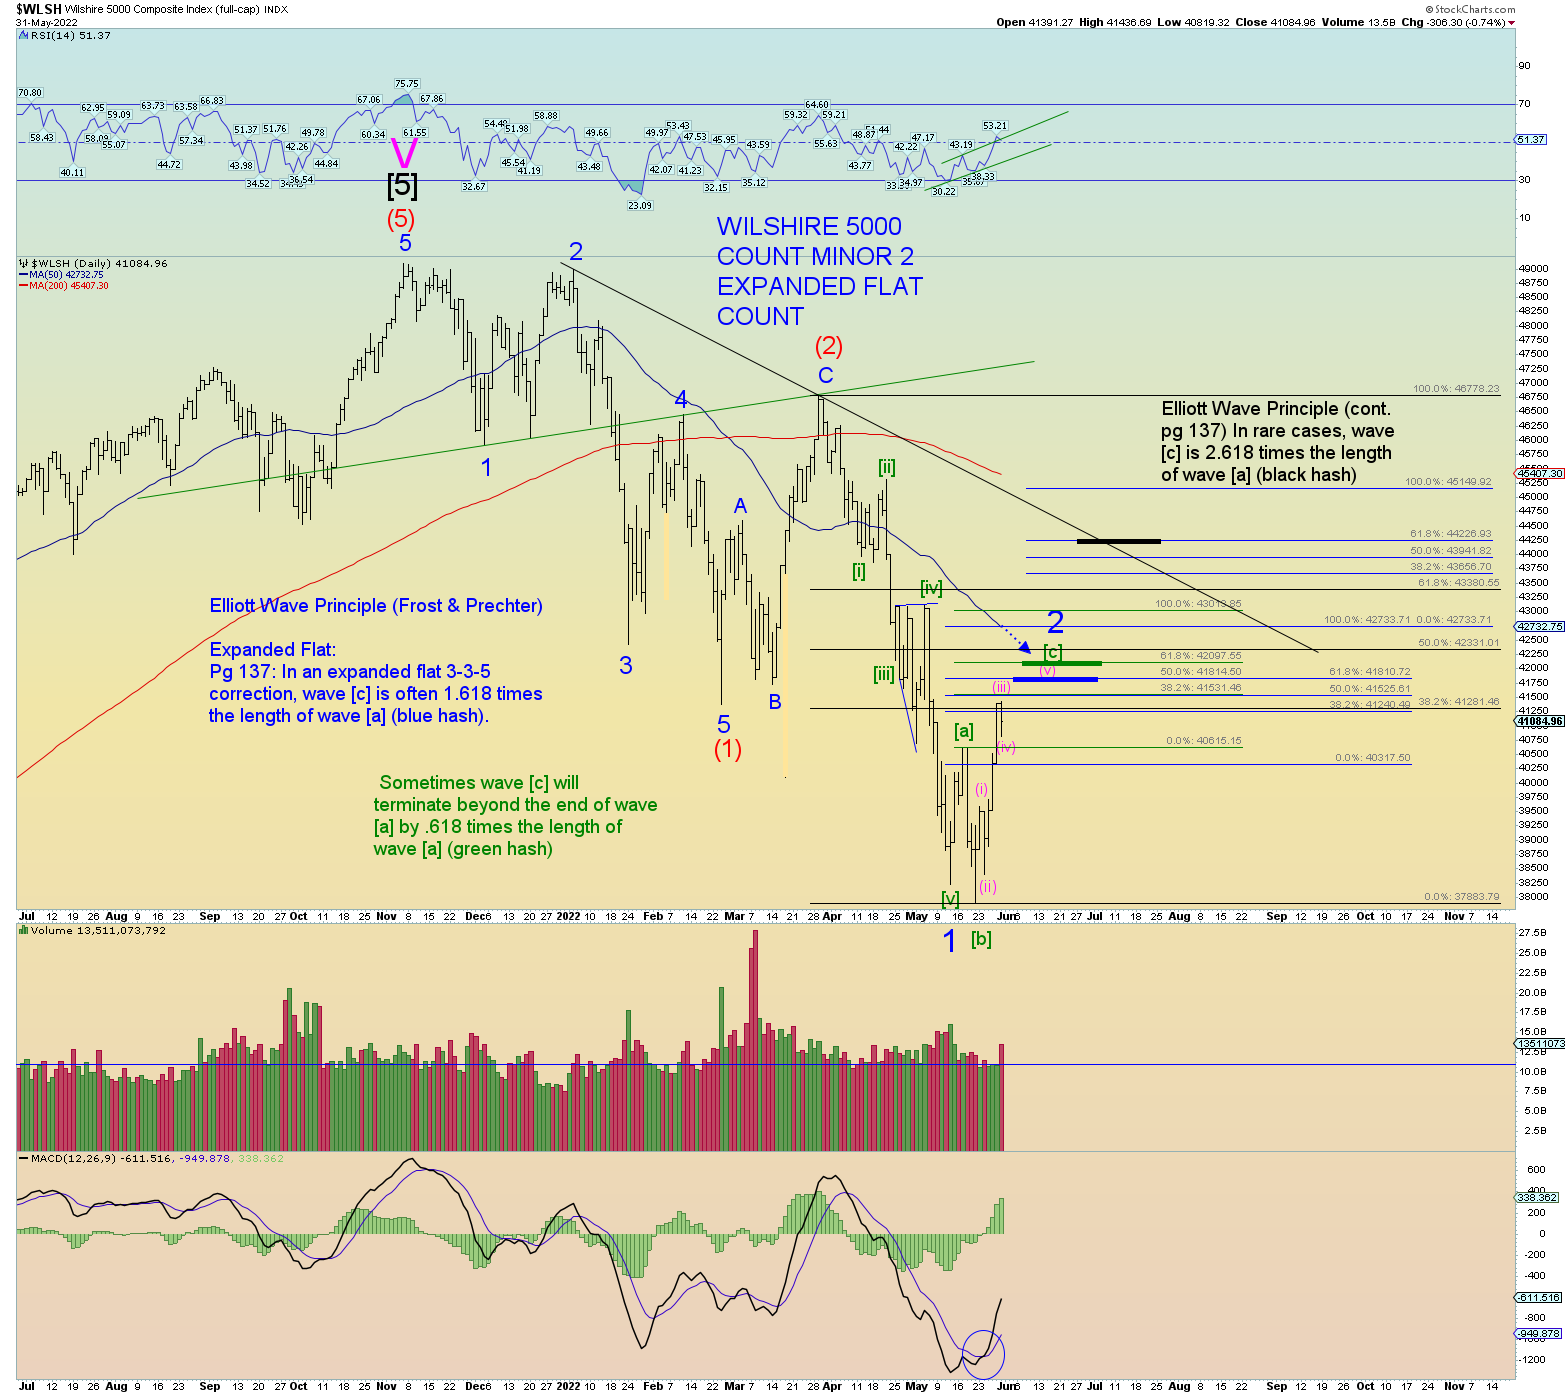
Wilshire daily, SPX daily. The “extreme and rare” upside target for the proposed Minor 2 expanded flat is considerably higher still and would likely take a few weeks or more. (For the SPX that would be about 4400 SPX).
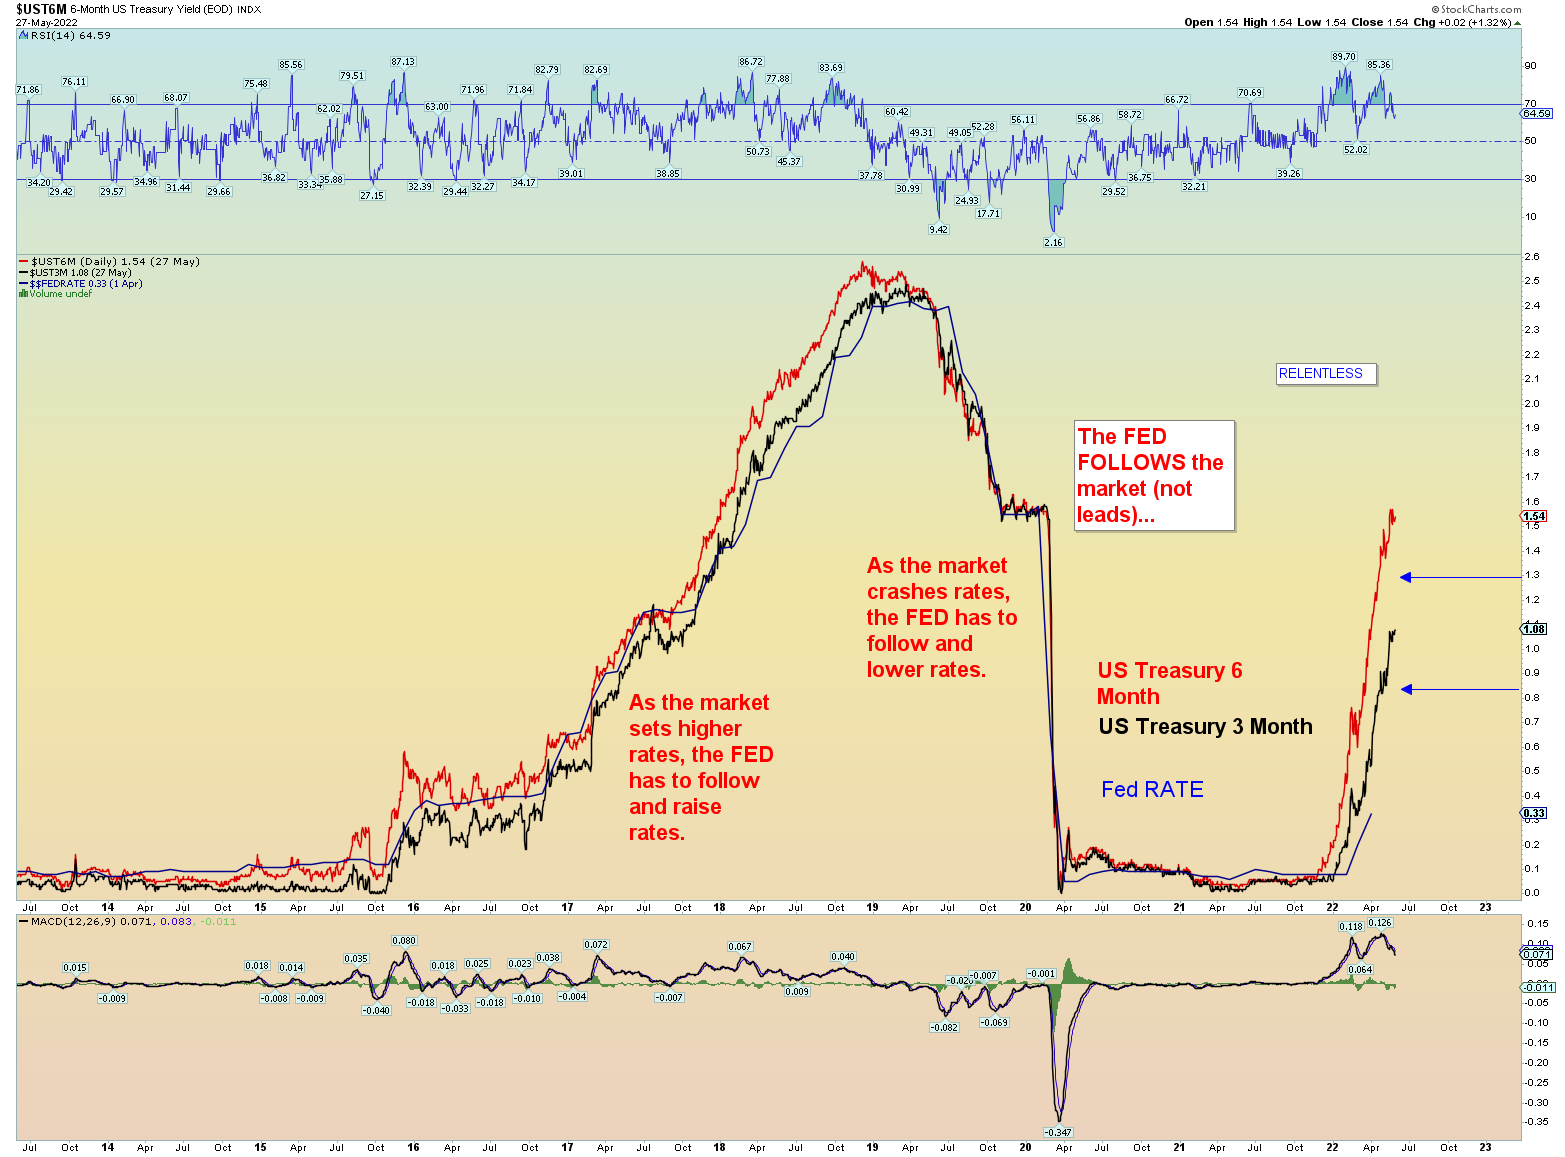
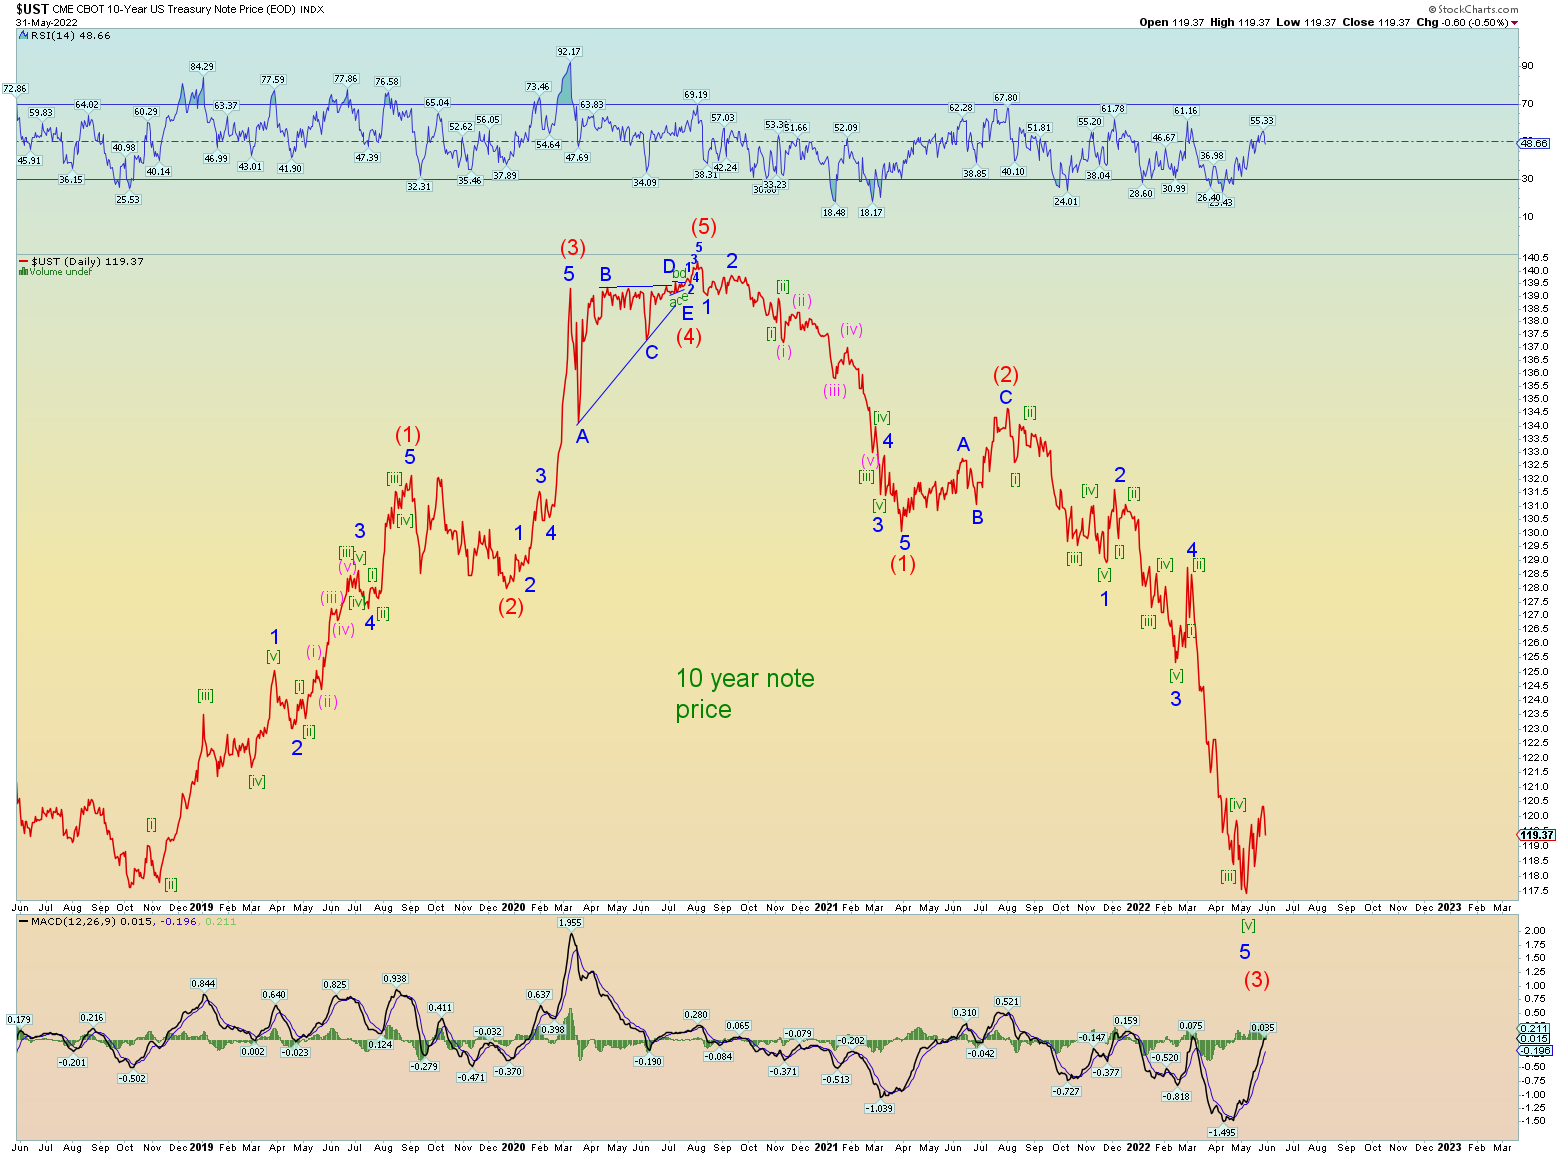
Where are short term interest rates going? At least another .50 point for now. But there is still quite an acceleration gap between the 3- and 6-month rates.
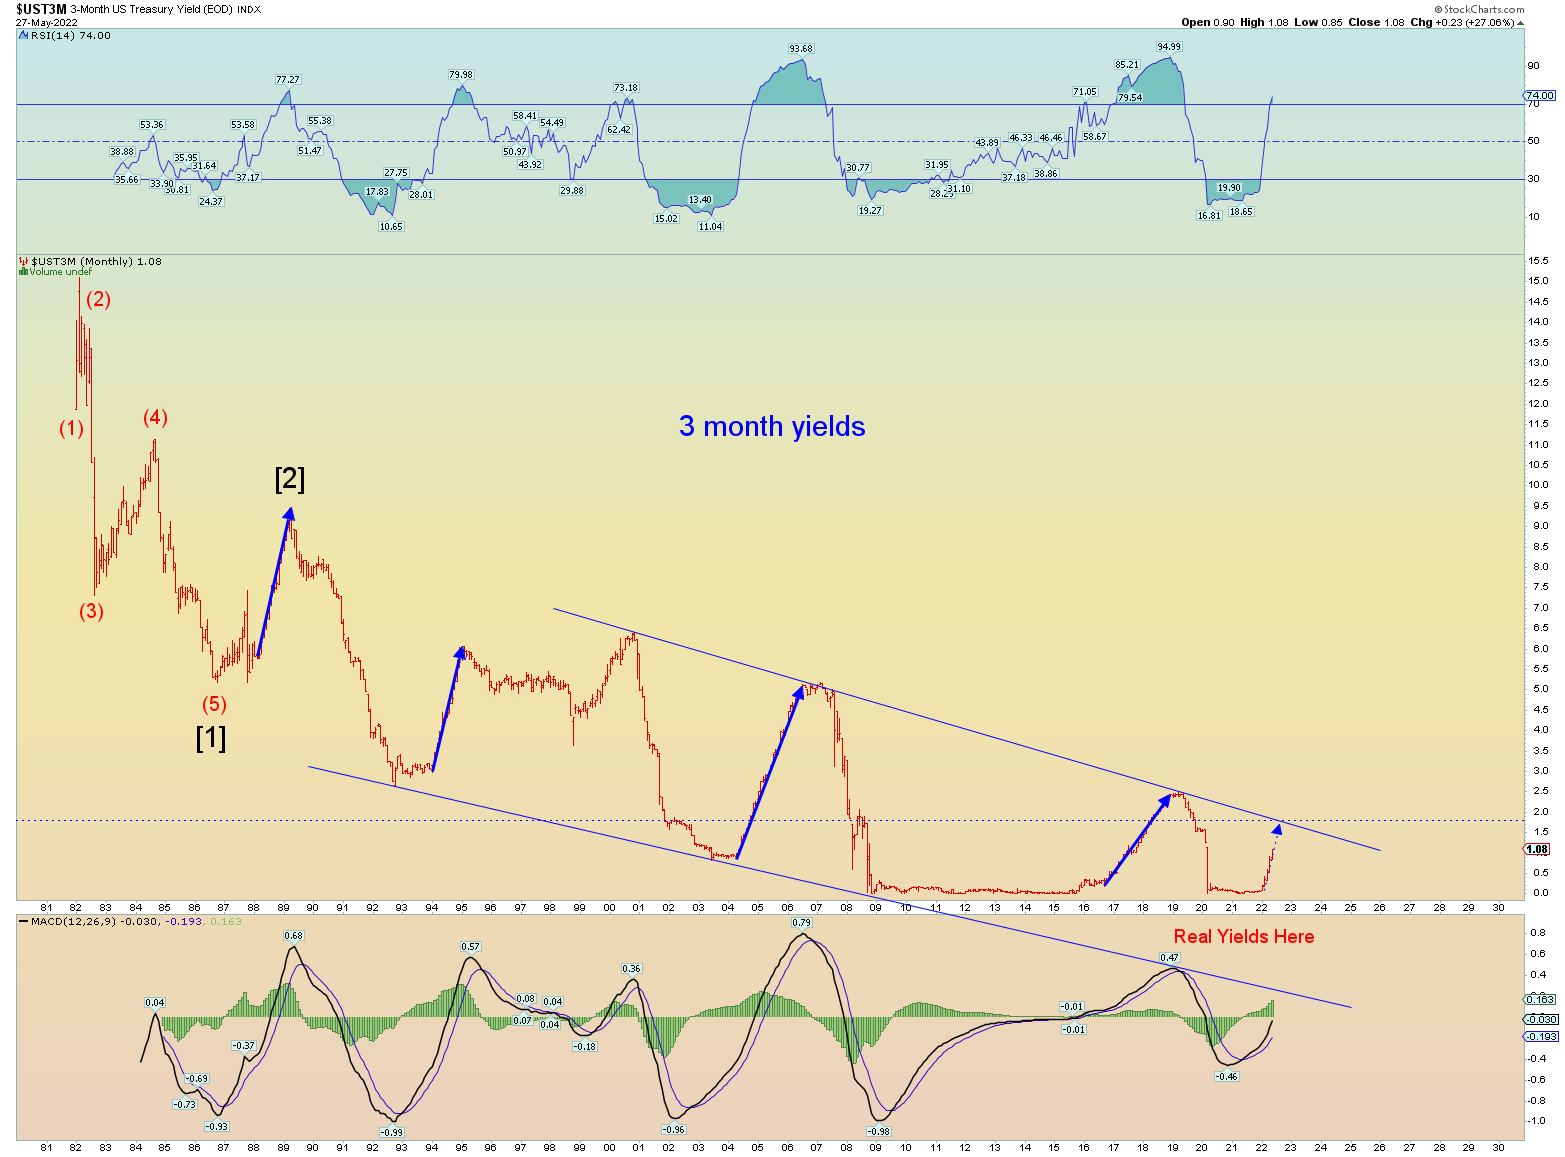
The long term 3-month yield chart. Upside channel line sits at about 1.65 – 1.75 depending on how fast it rises. That’s about another full 1 point of hiking in the long run. It’ll be interesting if prices make it to the downtrend line. Will they hold? Or will this signal a new long term supercycle of rising interest rates?
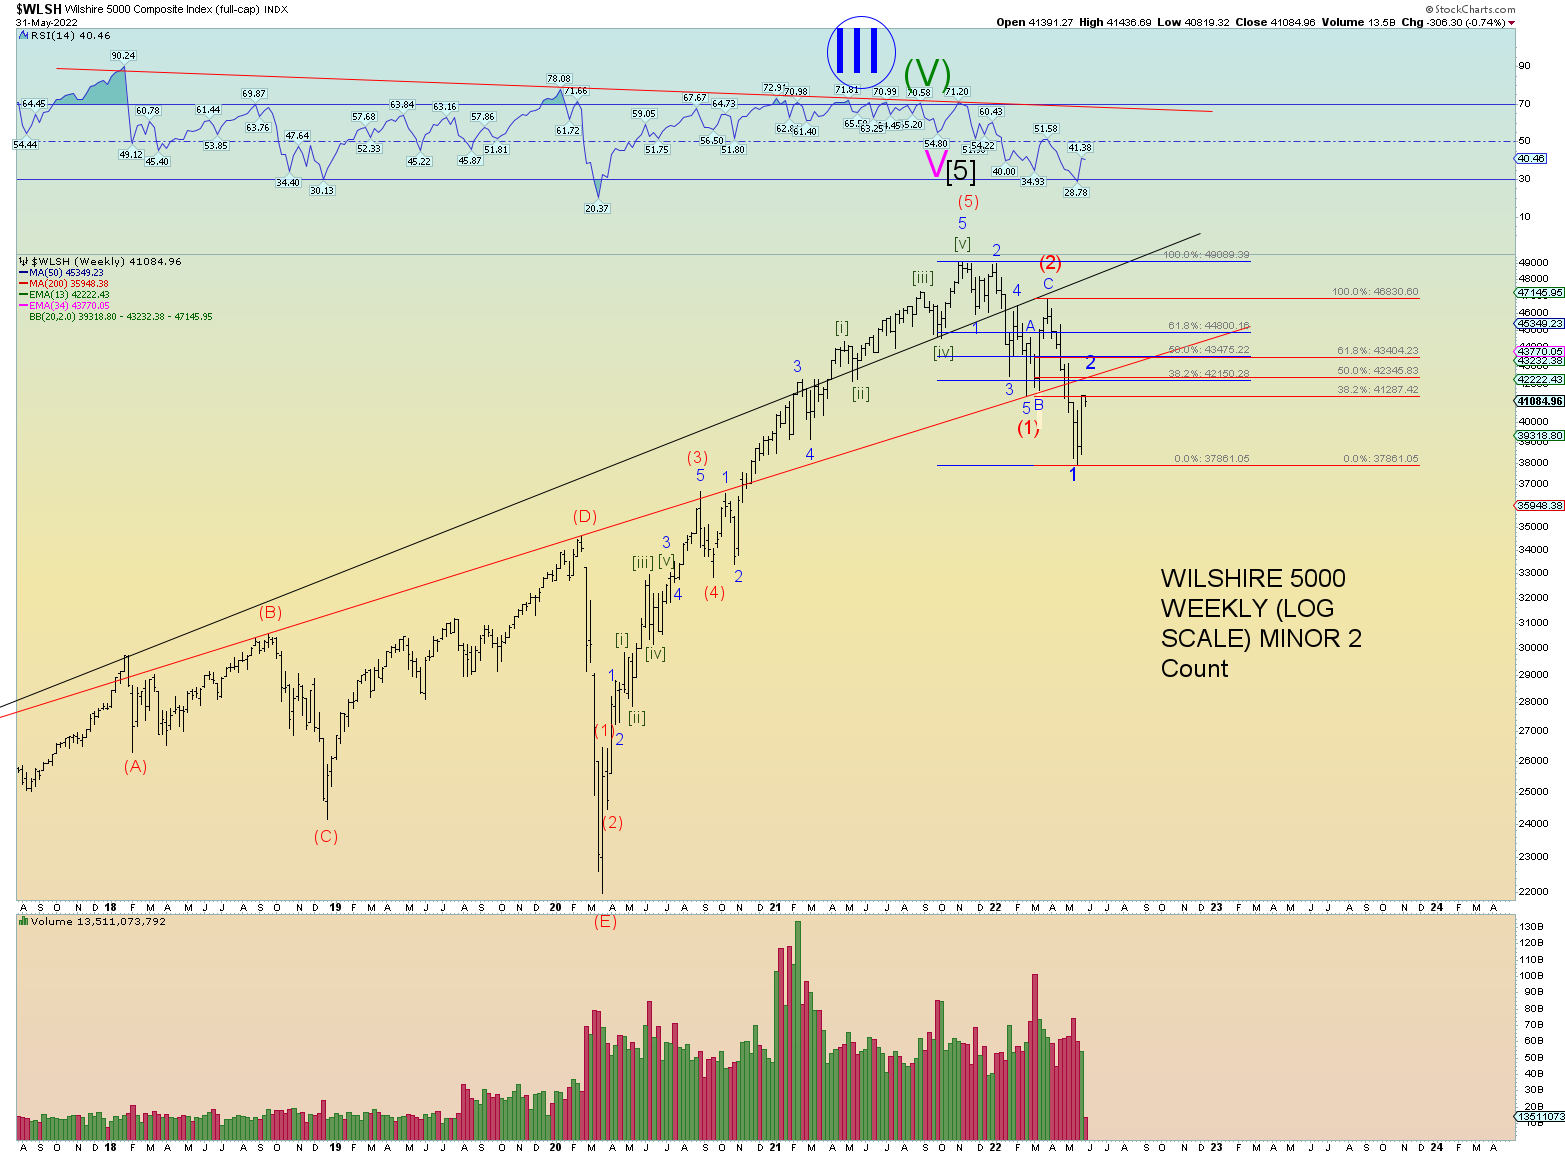
Wilshire monthly. Despite the aggressive rally, the monthly candle ends in a doji of sorts.
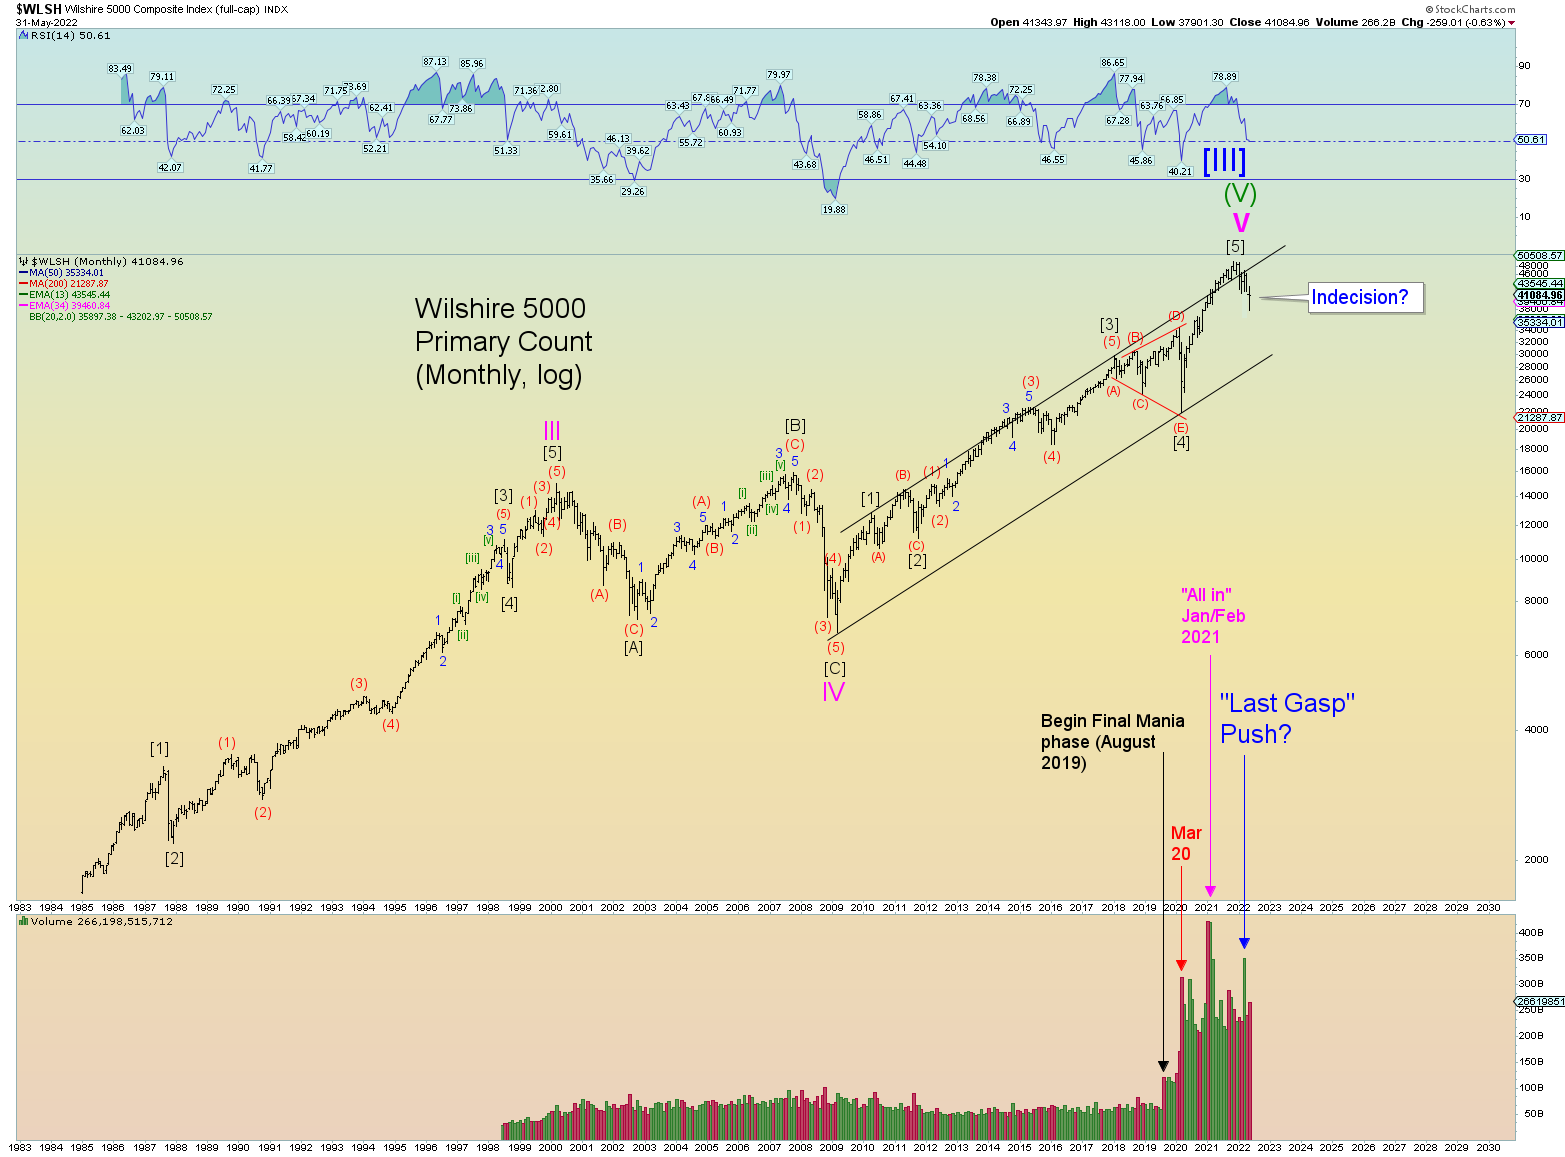
Wilshire expanded Minor 2 target range. I would also like to point out there are enough waves in place to consider Minor 2 “over”.
This next weekly shows where and how the red channel lines formed.
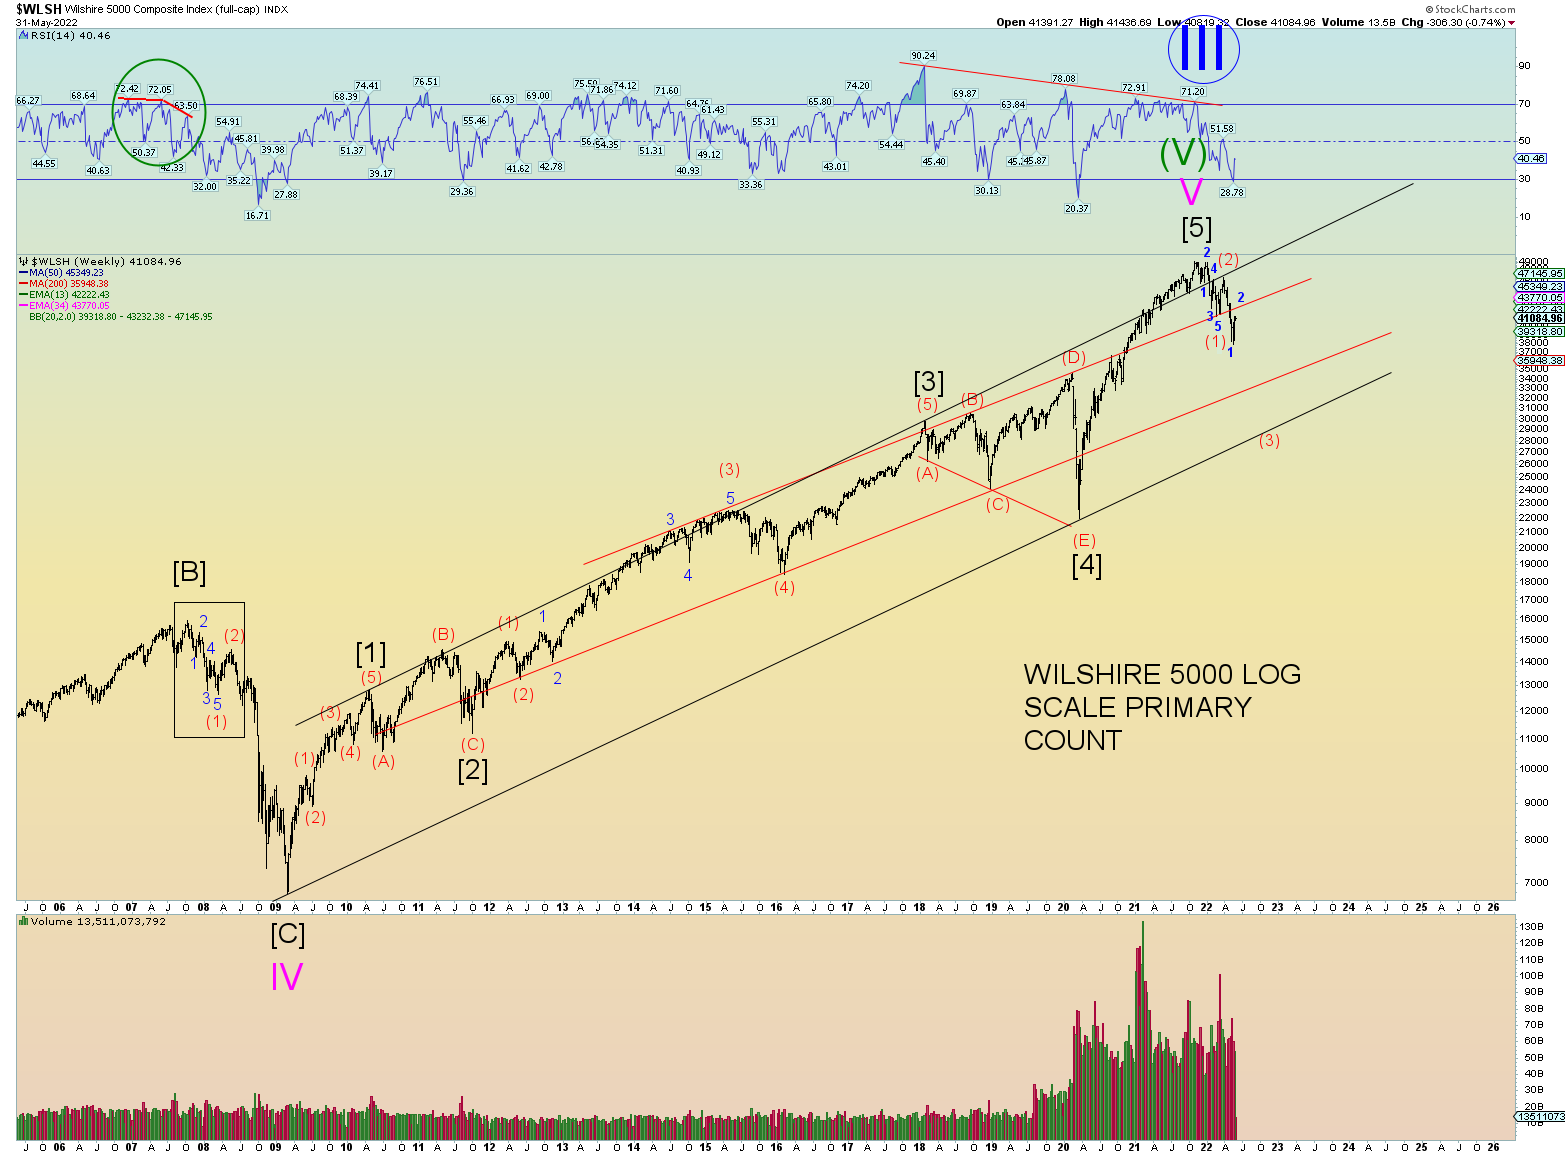
There is a bit of room to top out and backtest that line. That is the primary count.