I’m posting my spreadsheet of Daniel’s 70th week and how to solve in one workbook. Please feel free to distribute:
THE COUNTS:
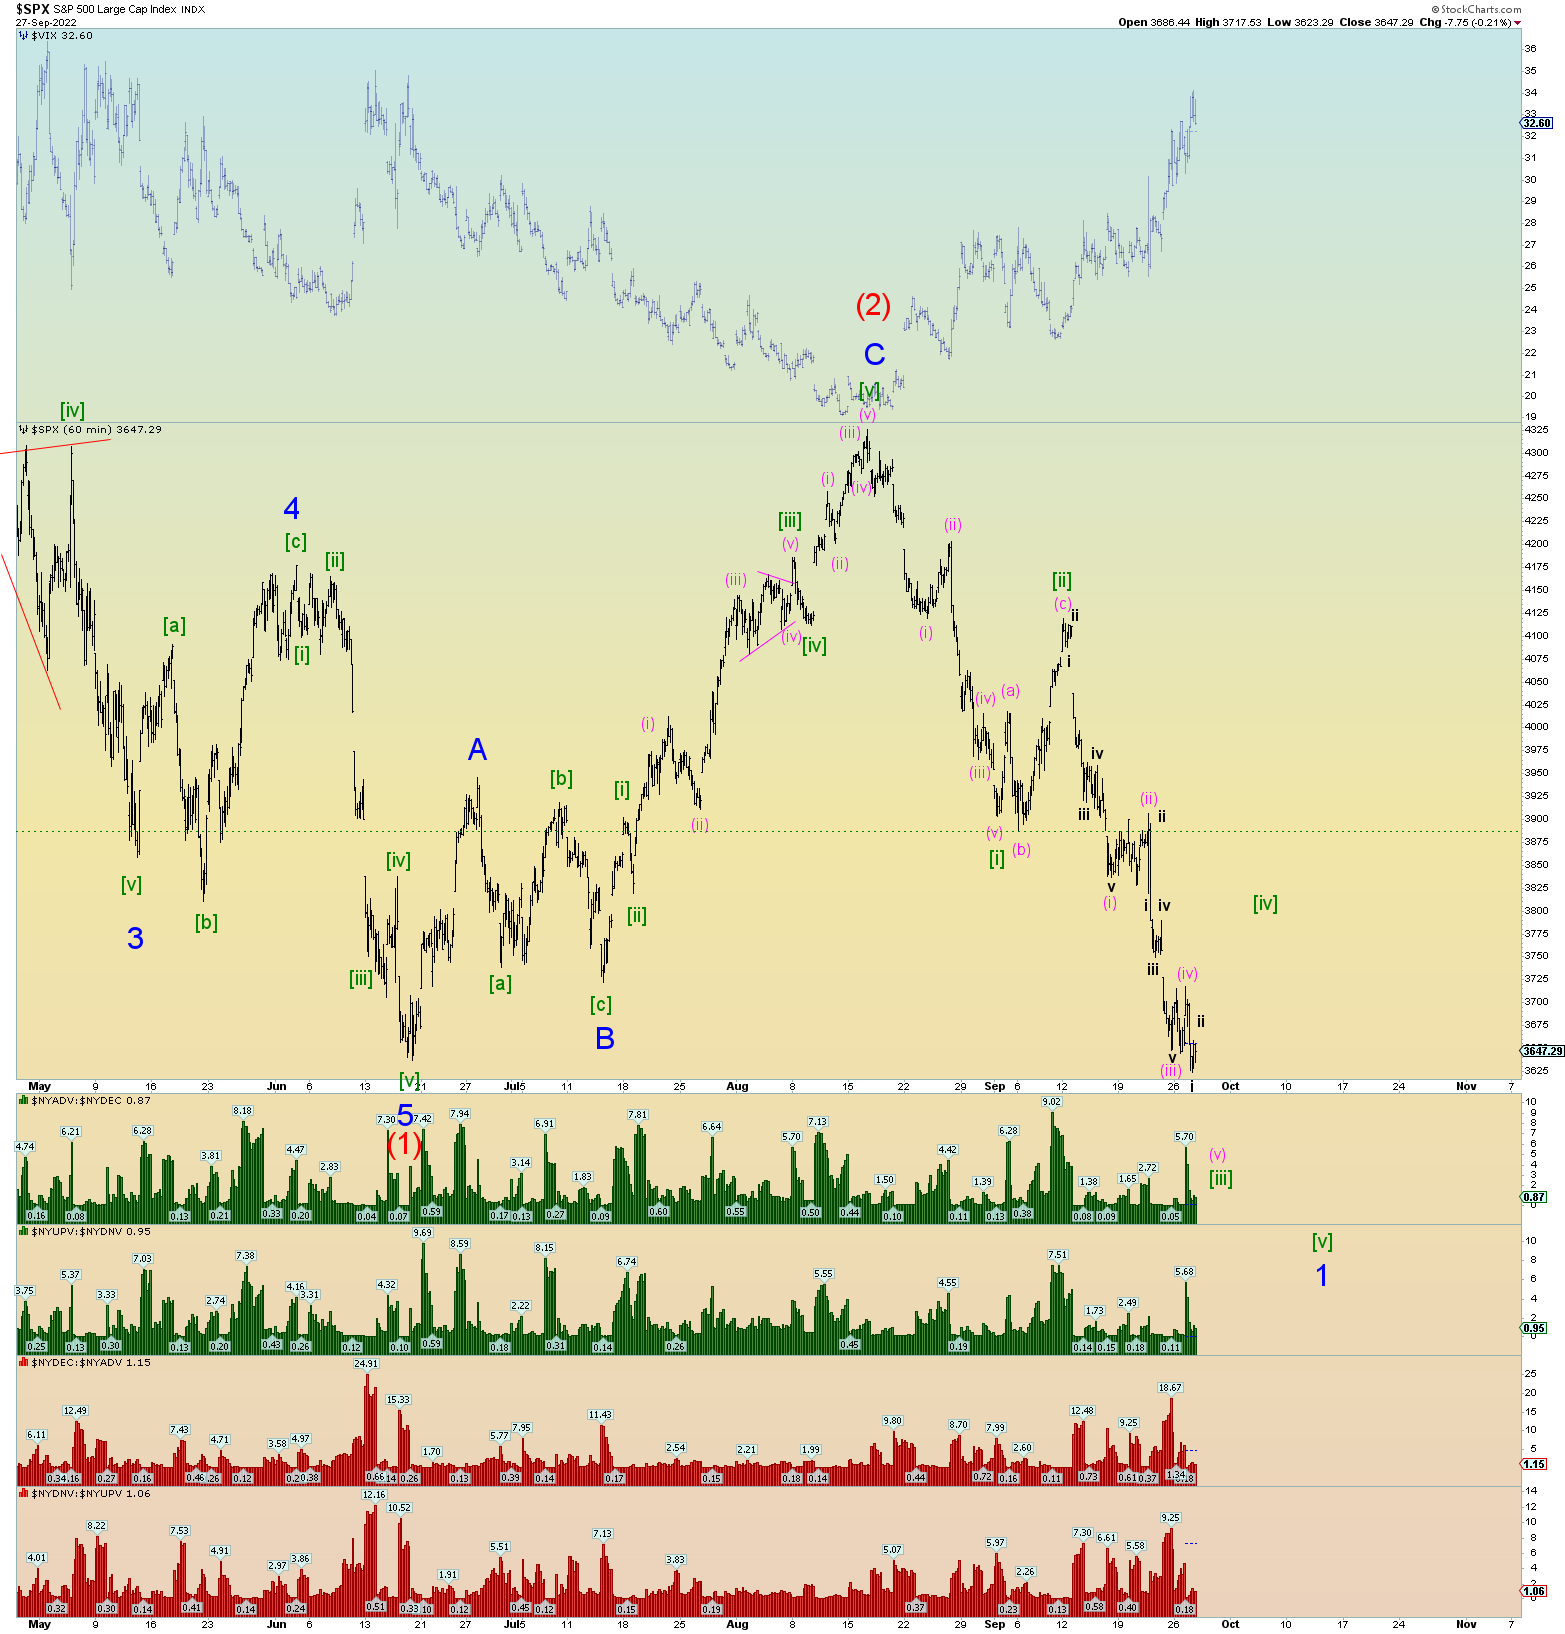
I have to use the SPX because the Wilshire had a “glitch” today as it sometimes does. It’s the same count basically from a recent squiggle standpoint. Basically, the idea is this: We are trying to determine the Minute [iii] of 1 wave low. Then Minute [iv] and [v] takes the market to the Minor 1 low of Intermediate (3) proper. An “ideal” wave would take Minor 1 low well beneath the Intermediate (1) low so in that sense this chart below “seems about right”.
And yes, lower low in the SPX today under the June low.