THE COUNTS
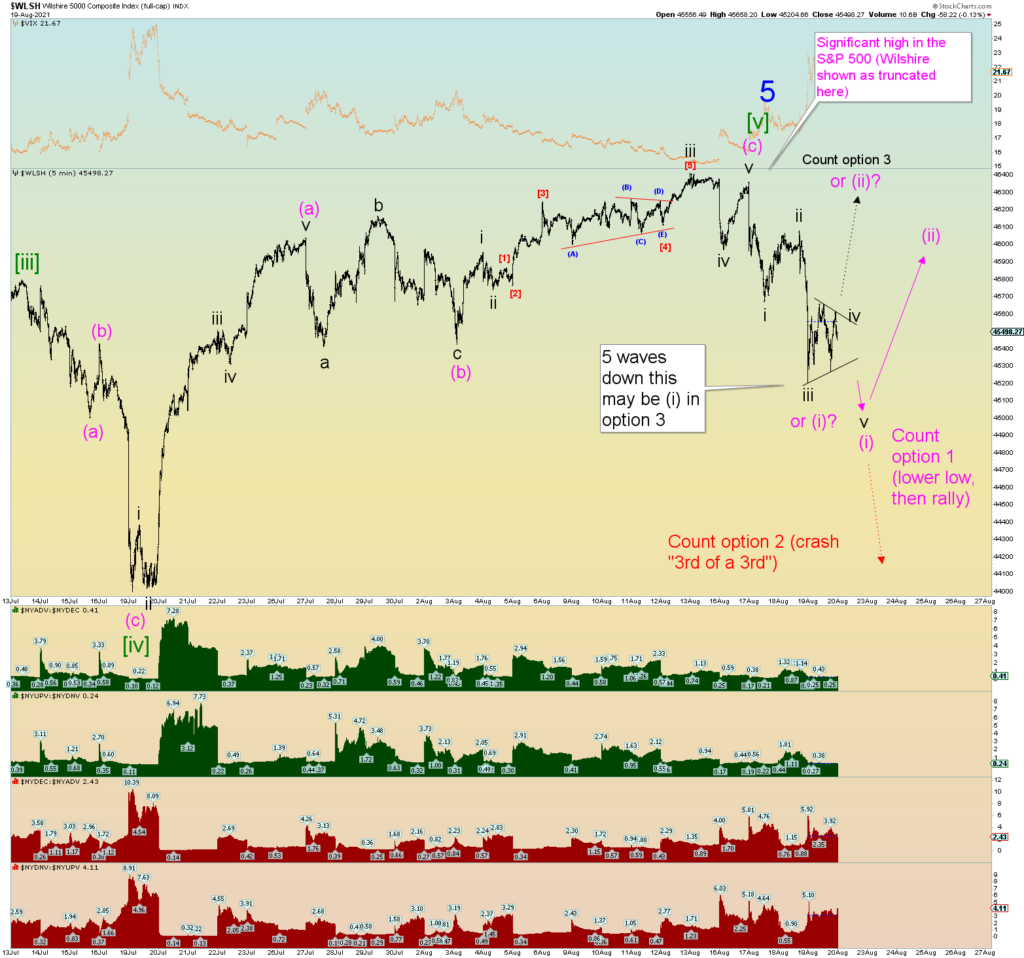
Looking at the Wilshire from an “up-down” counting manner, we have 5 waves from peak which is more of an indication that we are impulsing down rather than correcting in 3 waves down. If one views the S&P500, it is a mess in that regard since it had a significant high contrary to where the Wilshire’s high was. This is one reason I use the Wilshire 5000 – the total market – for wave counting and such. The Wilshire 5000 is the “King James Bible” to the S&P 500’s corrupted “Bible flavor of the week”.
Just thought I’d throw that in there!
So we have lots of squiggle options, we need to see how things shake out over the next few days. However, I favor a bearish outcome regardless and possibly a very bearish crash perhaps. The wave count is “ripe” for such an event.
So I made this messy chart showing the overall thoughts of how things might go.

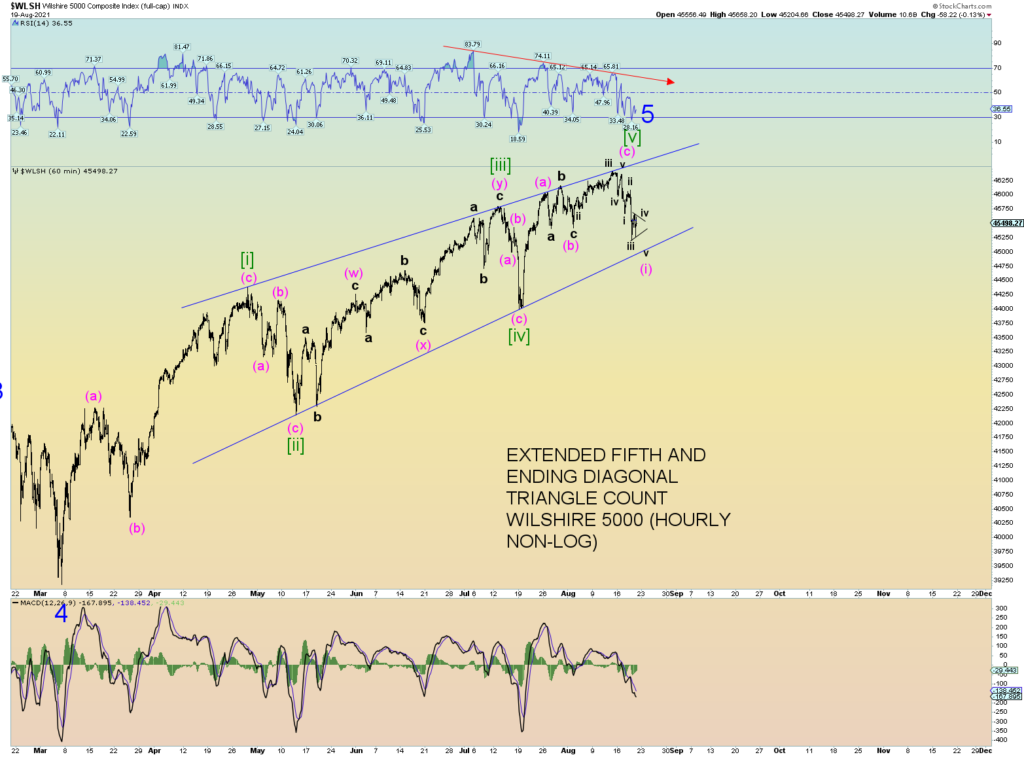
The overall “wedge” overlapping ending diagonal triangle count, in theory, is supposed to collapse quickly in prices. So far we have a good “stair step” start which may be setting up for a very large downside move.
In other words when you think they have been “buying the dips” over the last few days, it may be actually “selling the rips”. The way it stair steps down so far gives credence to that thought.
