Elliott Wave Update ~ 30 Mar 2022 & Daniel’s 70th Week Updated Timeline

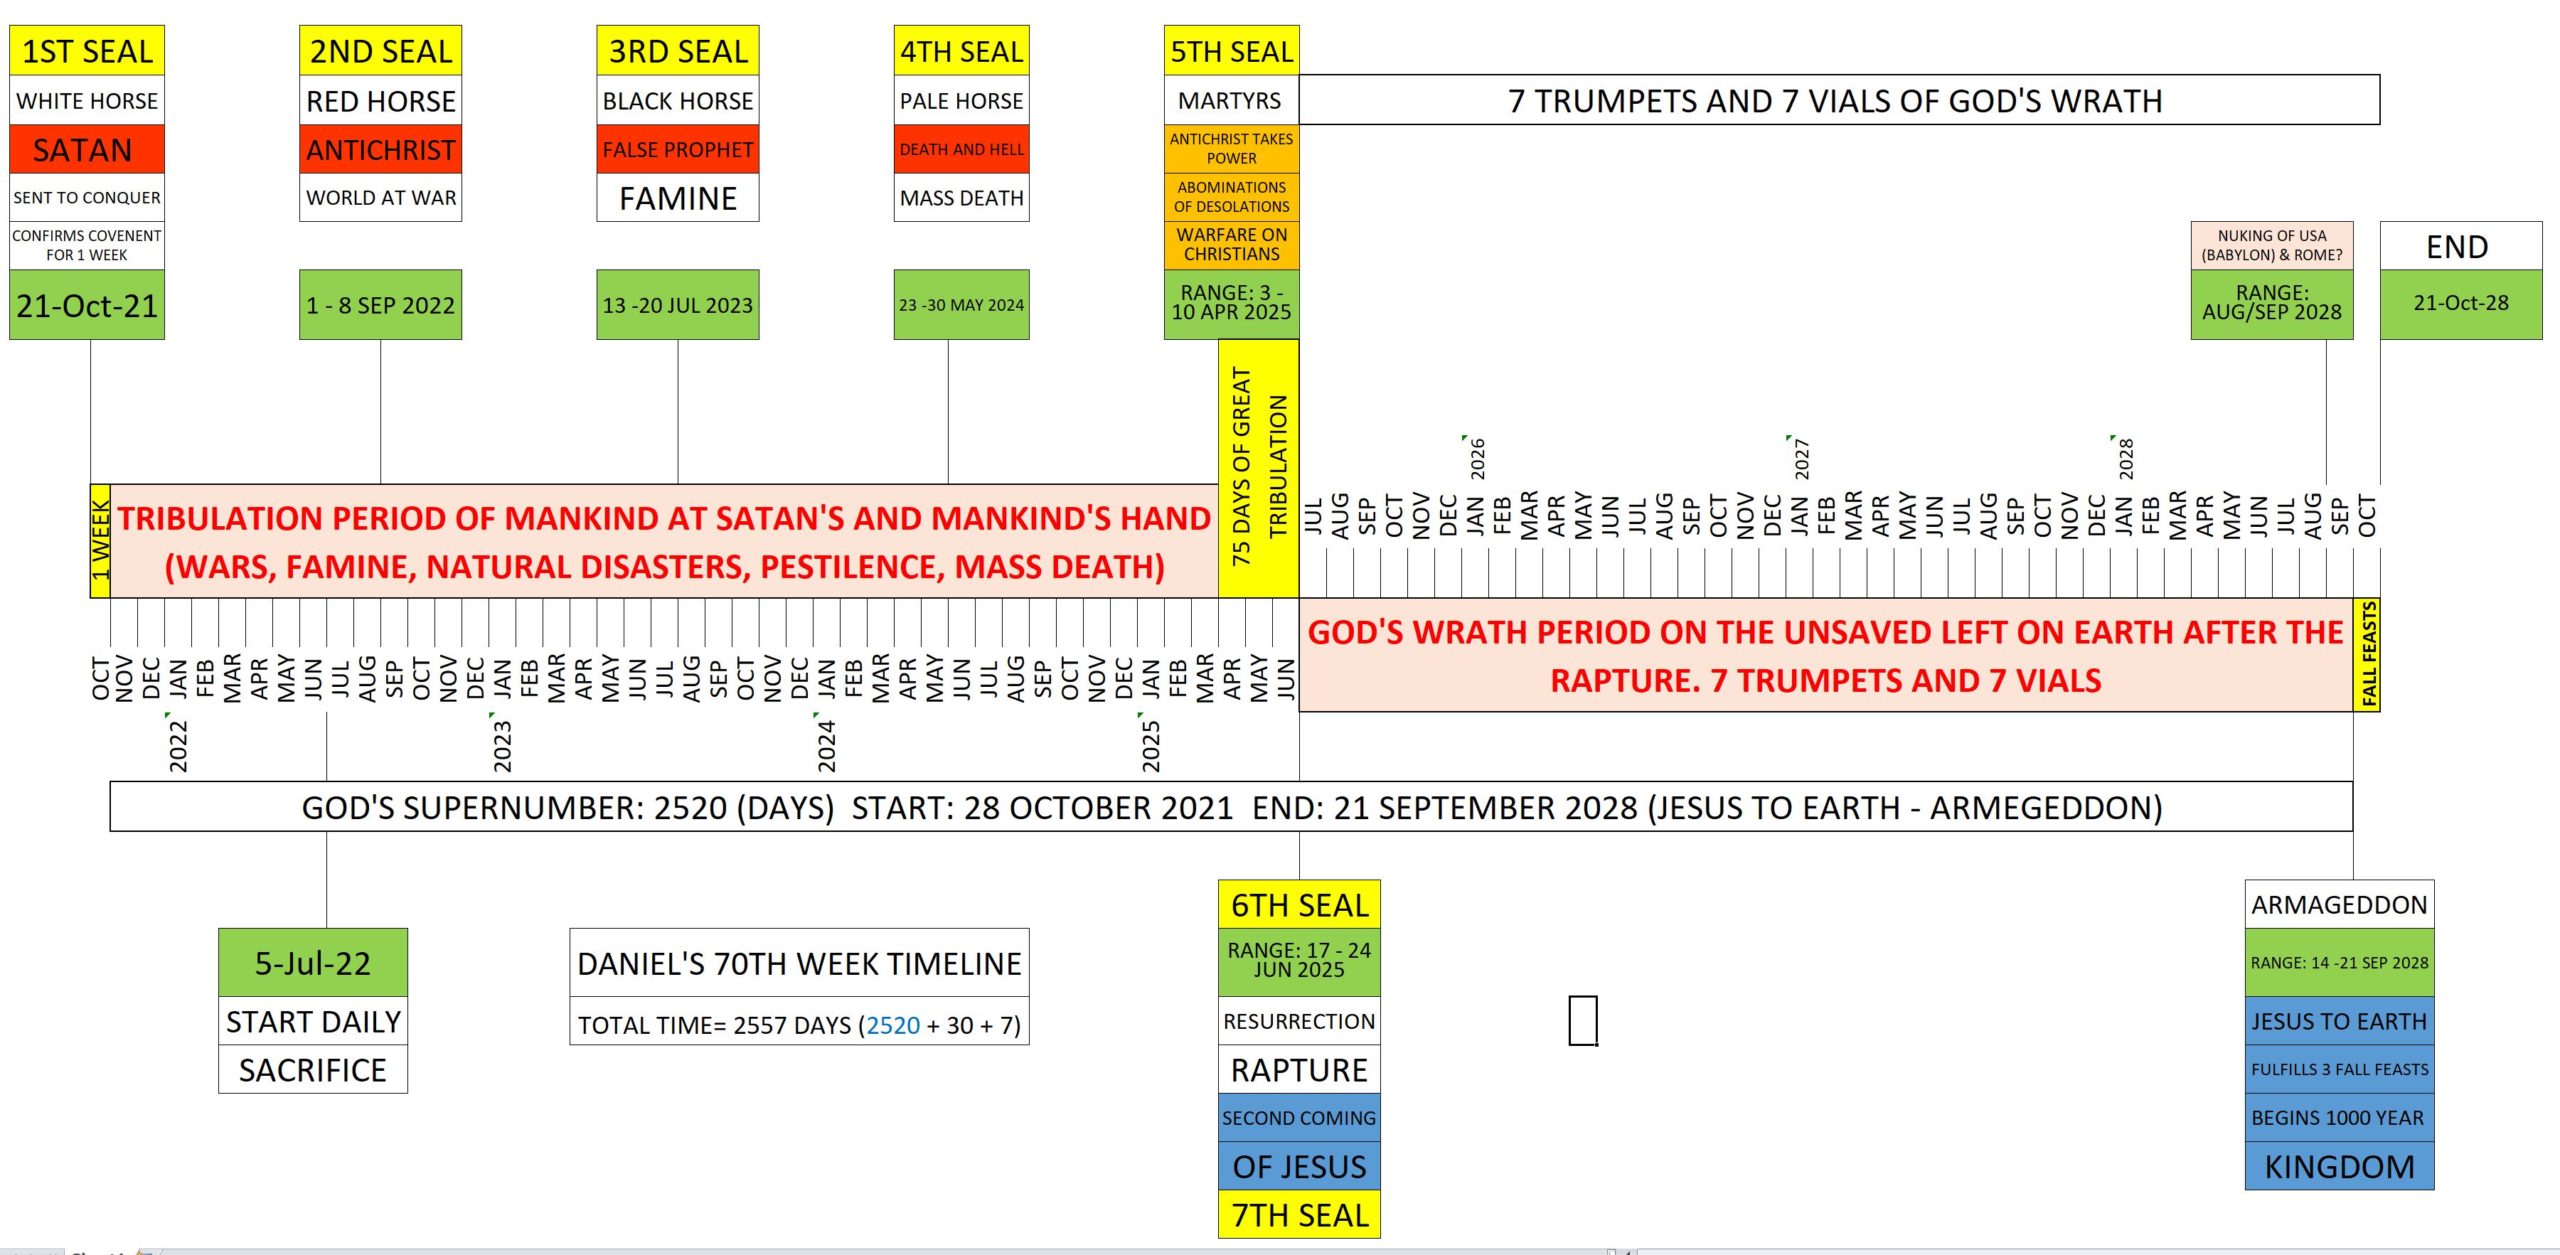
(Note: the main update to the timeline is the start date has been adjusted to 21 Oct 2021 vs the previous date of 21 Sep 2021. This more closely aligns and allows for Jesus to fulfill the 3 fall feasts as I have outlined in this post here. It also makes quite nicely 2520 – God’s super number – days from 28 Oct 21 – 21 Sep 28)

COMMENTARY

If you’re a regular reader, you probably know that I believe we have entered Daniel’s 70th week, the final 7 years prior to Jesus establishing his Millennial Kingdom here on earth. This is largely based upon C.J. Lovik’s amazing work here. Ironically, C.J. Lovik is your typical modern Pastor (not sure if he is a Pastor) that gives reverence to today’s Spirit-of-Antichrist Jews and thinks they are still God’s chosen people. They are not. Regardless, most Pastor’s teach that the final 7 years is “all for the Jews” and thus teach the false “pre-tribulation” rapture of the believers in Christ, i.e. – “Church Age”. It’s false and it’s of Satan of course promoted over a 100 years ago to cause bible-believing Christians to give undeserved reverence and great advantage toward Jews. It worked immensely.

Anyway, C.J. Lovik in his video at the end linked above suggested that Christians would be raptured prior to 2022 due to his false view that the rapture occurs a full 7 years prior to Jesus coming back to earth in 2028. I knew of course this would be proven futile and thus now C.J. Lovik has put out an emergency video explaining that it may be off a year and that the rapture could occur in 2022, or 2023. Those also will both be surely false for as you can see on my correct interpretation of how Daniel’s 70th week unfolds, we won’t be raptured until after the Abominations of Desolations occurs in the middle just like Jesus told us in Matthew 24. Pastors of course teach that Matthew 24 is “for the Jews only” which is of course false.

(I do not hate Jews! – I wish to get them saved to Jesus and see the truth!)

Regardless, I predicted that once 2022 came, C.J. would be in a quandary…and he is. I won’t link to his new video you can look it up if you like. What he should be doing is not so much questioning his amazing Daniel video but questioning why he believes in the Pre-tribulation rapture. But of course, he is not…. which I also predicted. Those invested in the idea of a “pre-trib” rapture have hardened necks against anything different.

So why would God reveal the most sought-after prophecy – the solving of Daniel’s 70th week mystery – to a pre-trib Pastor and not someone who believes in the correct post-trib/pre-wrath view of the rapture? That’s the way God works! I think he wants to show us that the pre-trib rapture is false and he did this by revealing Daniel’s 70th week mystery to someone who would ultimately not believe it.

I still have faith in C.J.’s work until it actually is proven otherwise. I am a logical person and there are signs for us to look for taught by Jesus (again Matthew 24 is the best place to start) for the end of the world as we know it. So, I worked hard on this timeline to see where we may be based on an “Armageddon” date of September 21st, 2028. I present my chart below.

What I wanted to do was make a “worst case” stretched-out scenario concerning timelines. People think Daniel’s 70th week starts immediately with great tribulation and war (and that Christians would be raptured prior to it all starting) but when one reads Revelation you realize that the 7 seals unfold one at a time and not all at once. At seal 6, Jesus comes in the clouds with great glory and all eyes will see him (it will NOT be a secret to any creature!). The dead in Christ (including all Old Testament Saints) get resurrected and the alive get raptured into the clouds to meet him and be taken to Heavan. On the same day, God starts to pour out his wrath for the next 3 1/3 years or so on those left on earth – the unbelievers. We then all come back with Jesus in September 2028 at the Battle of Armageddon. Jesus fulfills the 3 Fall Feasts and establishes his 1000-year Kingdom on earth.

(See my post links on the left I go into great detail on many things concerning bible end times prophecies)

Seal 5 is “Martyrs in Christ”, therefore I placed that seal at the beginning of the Antichrist rule at the Abominations of Desolations, between 3 -10 April 2025. Thus seals 2 through 4 are evenly spaced between the start of seal 1 and seal 5 in the middle. This may or may not be correct, but it gives us something to go by because the next major event we can surely “see” is total global warfare, when peace is taken from the earth with the release of the Second Horse of the Apocalypse.

Therefore, I came up with 1 – 8 September 2022 timeframe – at the latest – for total global warfare to have begun. It could certainly occur earlier and perhaps we have wiggle room and it unfold more slowly. This is again, a best guess. No one knows how exactly the seals will unfold but if you have been following what our current U.S. regime (and Zelensky) is trying to do, it is trying to start a global war with Russia in case you haven’t figured that out just yet.

The other possible sign is the Jewish “daily sacrifice” beginning again and this is where Jews sacrifice animals every day as they did in the time of Mosaic law. (In reality whether they know it or not they’ll be sacrificing to Satan not God the Father.) This actually has a somewhat hard date – 5 July 2022. Obviously, they will have no 3rd Jewish temple built by then as many insist must happen first, but the bible doesn’t require they have a temple. My theory is that they will use a mobile wheeled alter that gets moved up to the western wall once or twice a day. There is already one constructed and waiting to be used.

Perhaps the sacrifices start again but are not known to the public. Or perhaps that part of bible prophecy is not quite correctly interpreted in this case. Either way although it is something to look for, one thing we must look for is total global warfare. Hey, I’m not dogmatic about things. No total war prior to the end of this year, then I am probably wrong about this timeline.

Seals 3 and 4 bring famine and mass death of course. We can already see that the world is setting itself up for massive food inflation just like seal 3 states. So, we can already see worldwide famine is very possible, particularly since the financial system will likely finally implode. (Japan’s debt load alone is 250% of its GDP!)

What will cause mass death on the order of 2+ billion come 2024 and 2025 short of full-scale nuclear warfare? Well, I have strongly suggested the “vaccine” jab may play a key role. The world has taken some 11+ billion doses and continues to administer some 31 million a day. Anyone who has an eye can easily see the carnage it has produced already and there is no letup it seems. Poisoned blood, in this case full of things like toxic graphene oxide, will eventually have a mass effect with time. And they continue to “geoengineer” the skies all over the western world. That is not helping us either.

I do not believe there will be total nuclear warfare prior to the midpoint although it is possible for a local conflagration to occur and certainly a bomb or 2 may go off at some point prior to God’s wrath period. But for the most part the first half of Daniel’s 70th week will be old-fashioned global conflagration along with a collapsed global financial system and collapsed supply lines, famine, disease, etc. It is easy to imagine this now. 5 years ago, you called me crazy. Not so much anymore.

Once the financial system is wrecked via global warfare, and then famine takes hold, and deaths from war, “vaccines”, and by natural disasters the Antichrist will be ready to step in to be the savior. And surely all the nations (for the most part) will gladly give someone power who has all the “answers” to bring peace again. This peace of course will result in a one world government ruled by the Antichrist, a one world religion (or death), and a one world currency (mark of the beast) in order to buy or sell. An electronic chip embedded in the right hand or forehead.

This is all biblical and it matches perfectly with what the global elites are trying to achieve with the “Great Reset” what are the odds in that? They 1) want us “normies” dead 2) want total unified global power 3) want total financial control over the individual and eliminate Christianity first and foremost. What better way than to wreck the current global system through warfare, famine and financial strangulation to bring it all about? Remember Satan is behind people like Biden, who already looks like he may be possessed to be truthful. The man is an abomination. His son is an abomination crackhead pedophile, and the apple doesn’t fall far from the tree. True evil and corrupt to the very core at the highest positions of global power the world over. There is no institution left that is not thoroughly corrupted to the core and that includes Corporate Christianity. Certainly, the Pope is a pawn of the devil.

Religion will be “dead” as far as Christianity. The bible tells of a great “falling away” (apostasy) occurs and that is also easy to see happening because when the pre-tribulation rapture does not happen as millions were promised how many wobbly Christians would commit apostasy if they never truly believed anyway? The bible predicts this great apostasy!

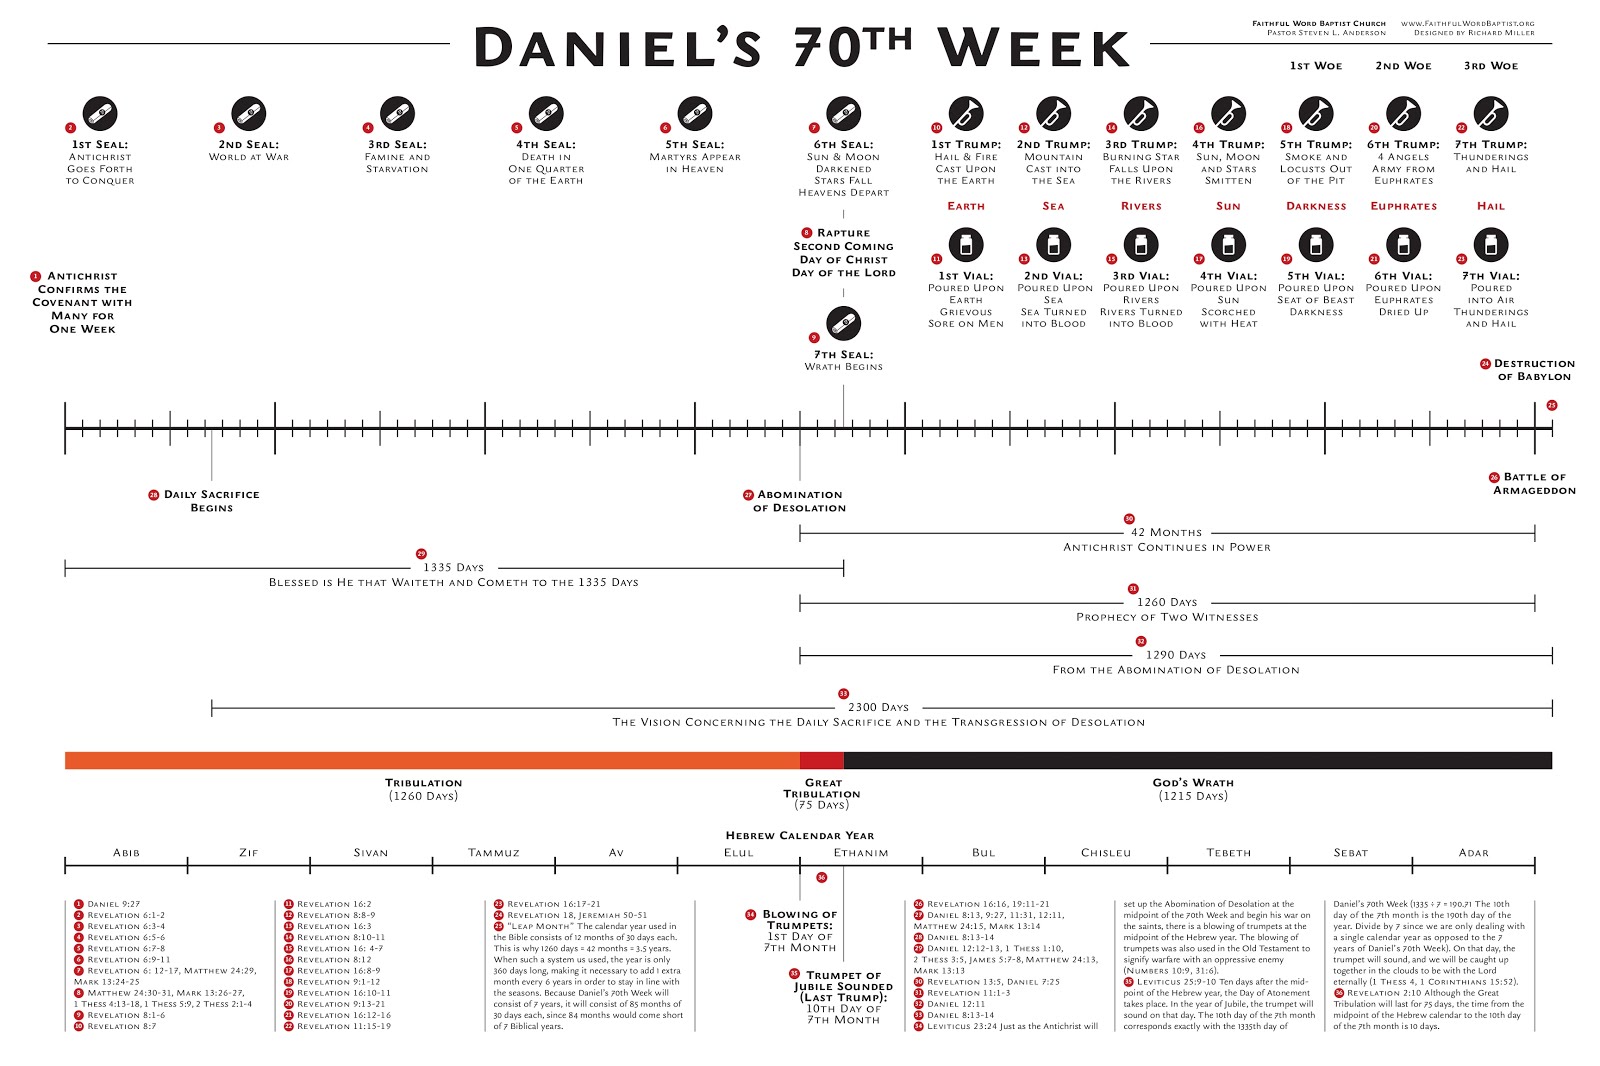
The 2nd and 3rd charts are Pastor Steven Anderson’s timelines that I used as a basis for my timeline chart as I have studied the bible and agree completely.
Pastor Anderson’s timeline charts:
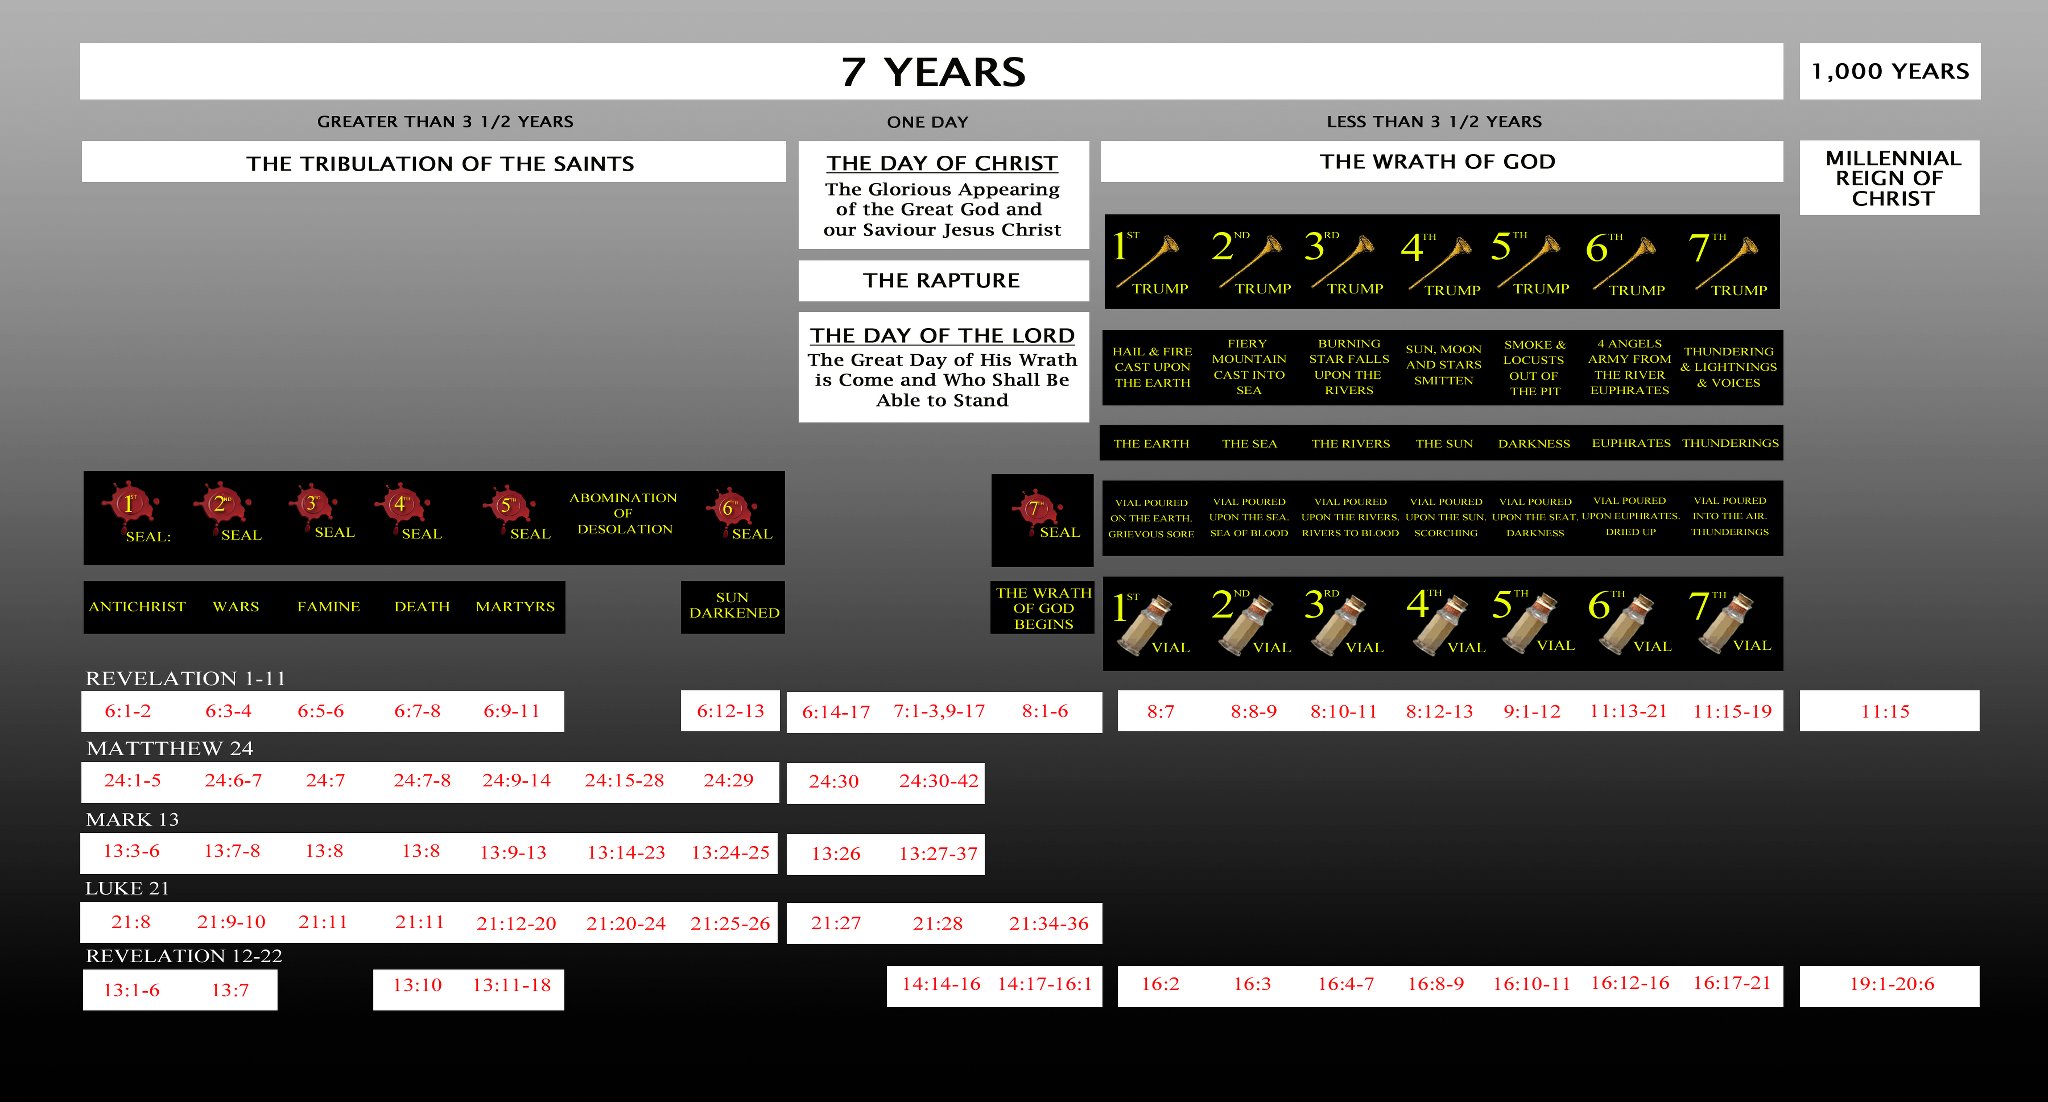
Bottom line: We look for global warfare to help determine if we are truly in Daniel’s 70th week. Be on the lookout also for the Jewish daily sacrifice to begin again also. Other than that, again I am not super dogmatic. No global war = no Daniel’s 70th week (for now).

Regardless, you don’t have much time to get right with Jesus.

THE COUNTS

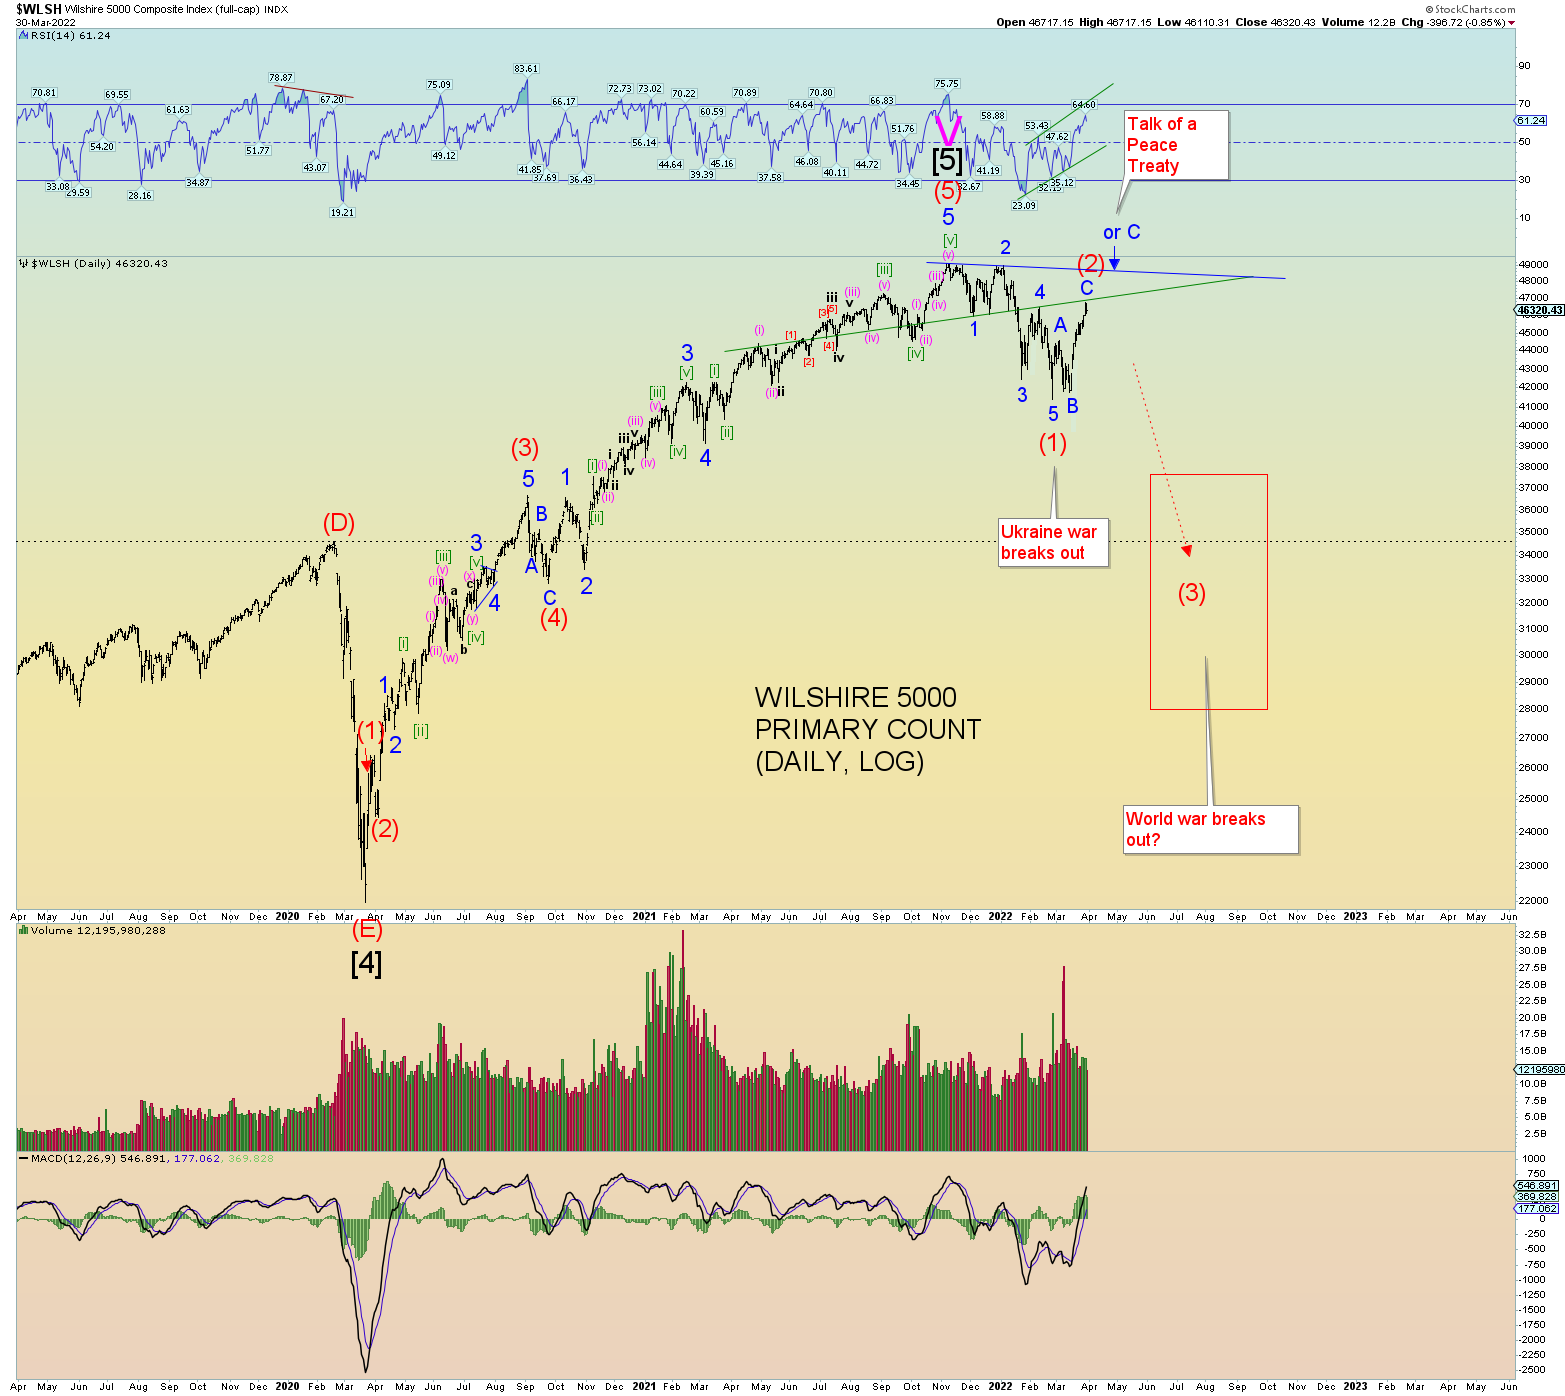
Tying in the theme of total global war, one should “expect” that social mood will go much lower. This should be indicated by the Elliott Waves. For instance, the Ukraine war broke out on the very day of the Wilshire 5000 price low. We should probably expect a major downdraft of markets and then global warfare breaks out near the (temp?) bottom. Something like this:
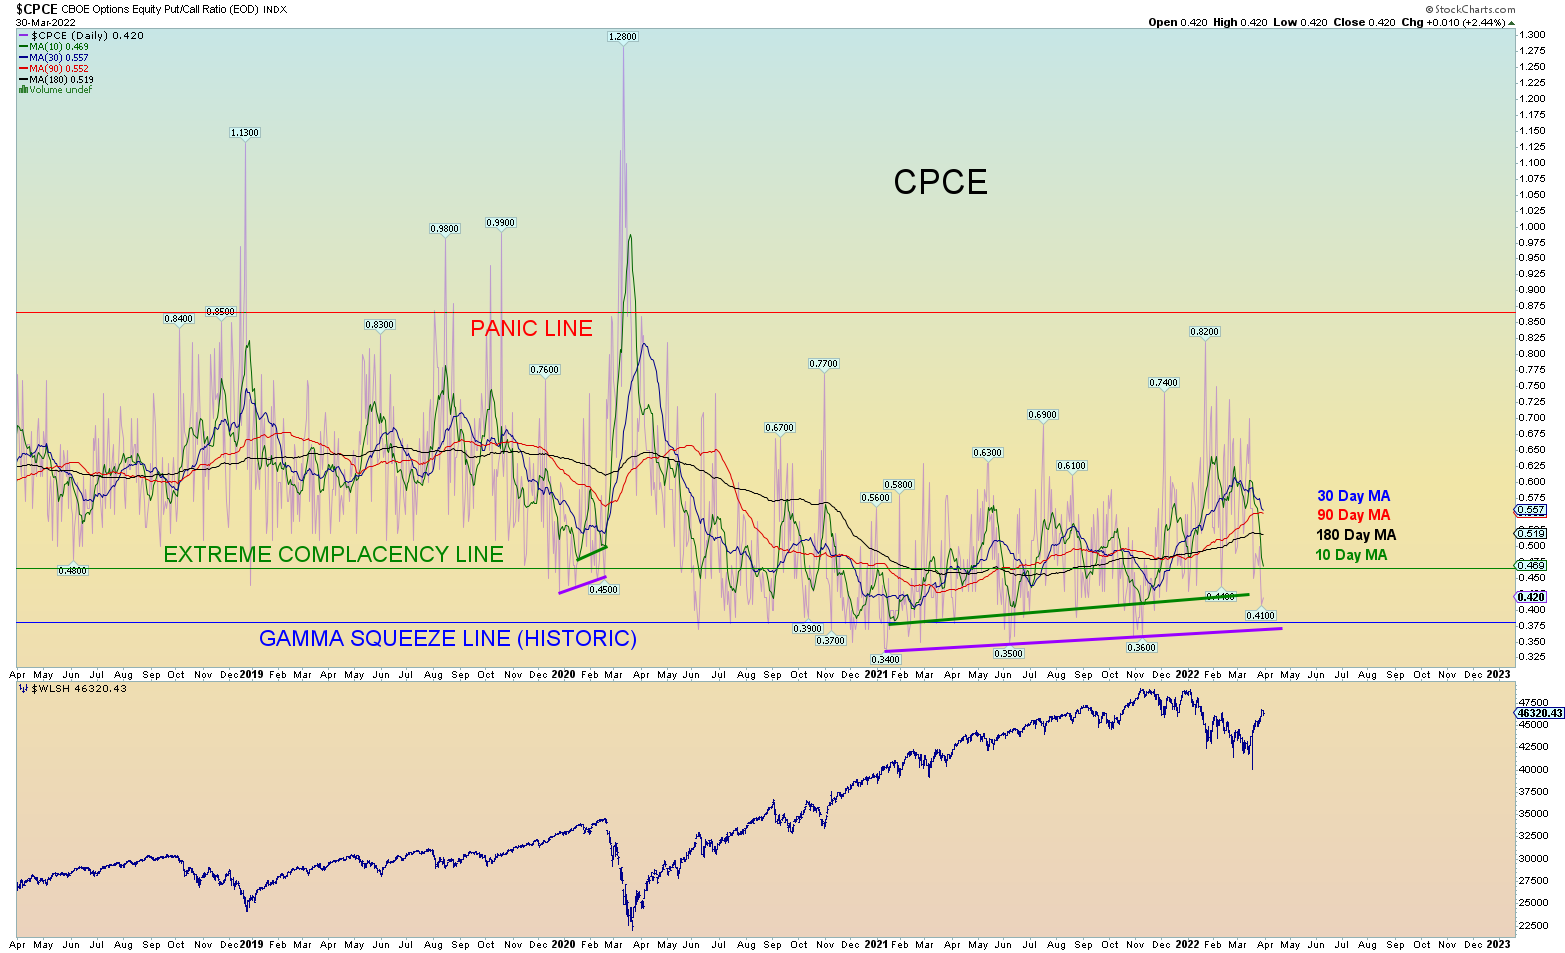
NYSE internals were negative today. Yet the CPCE printed a ratio .42 calls vs. puts and that’s after a full 10% rally!
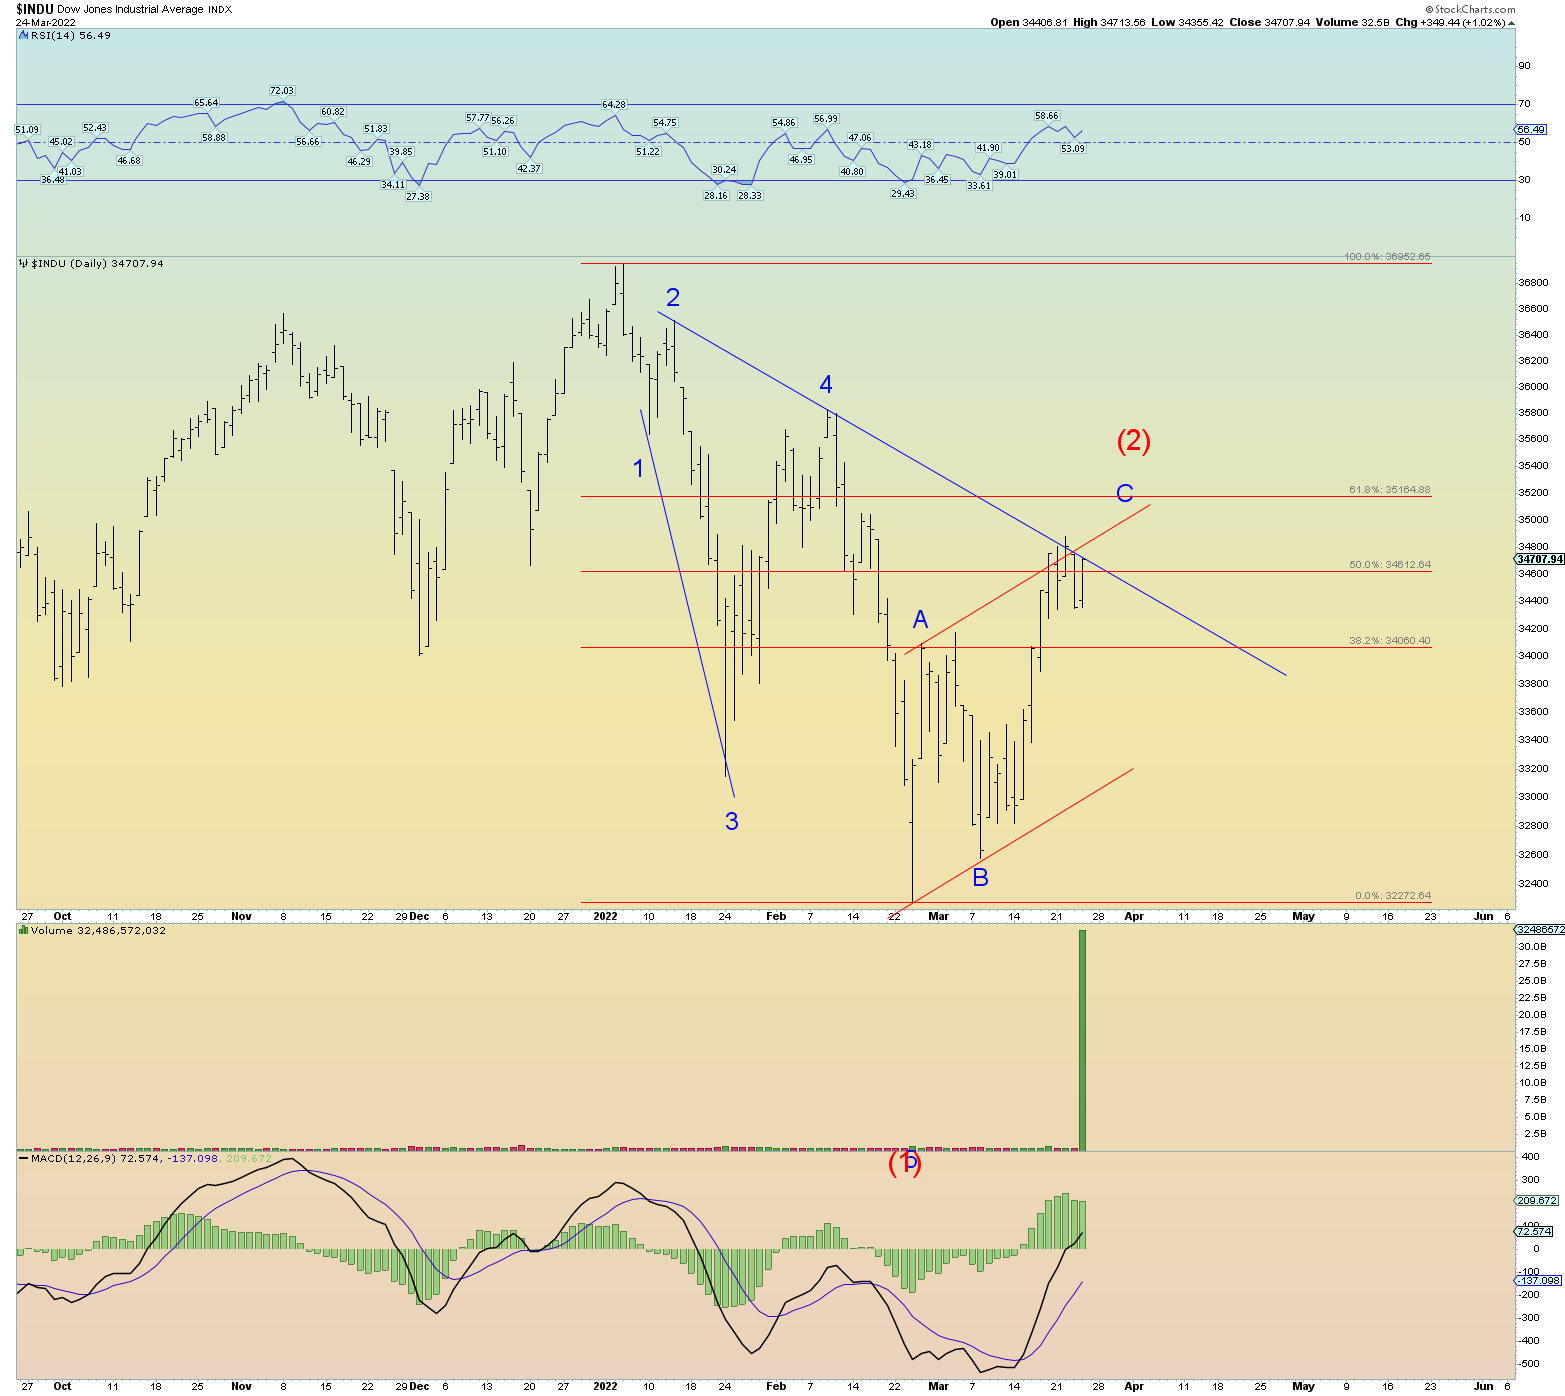
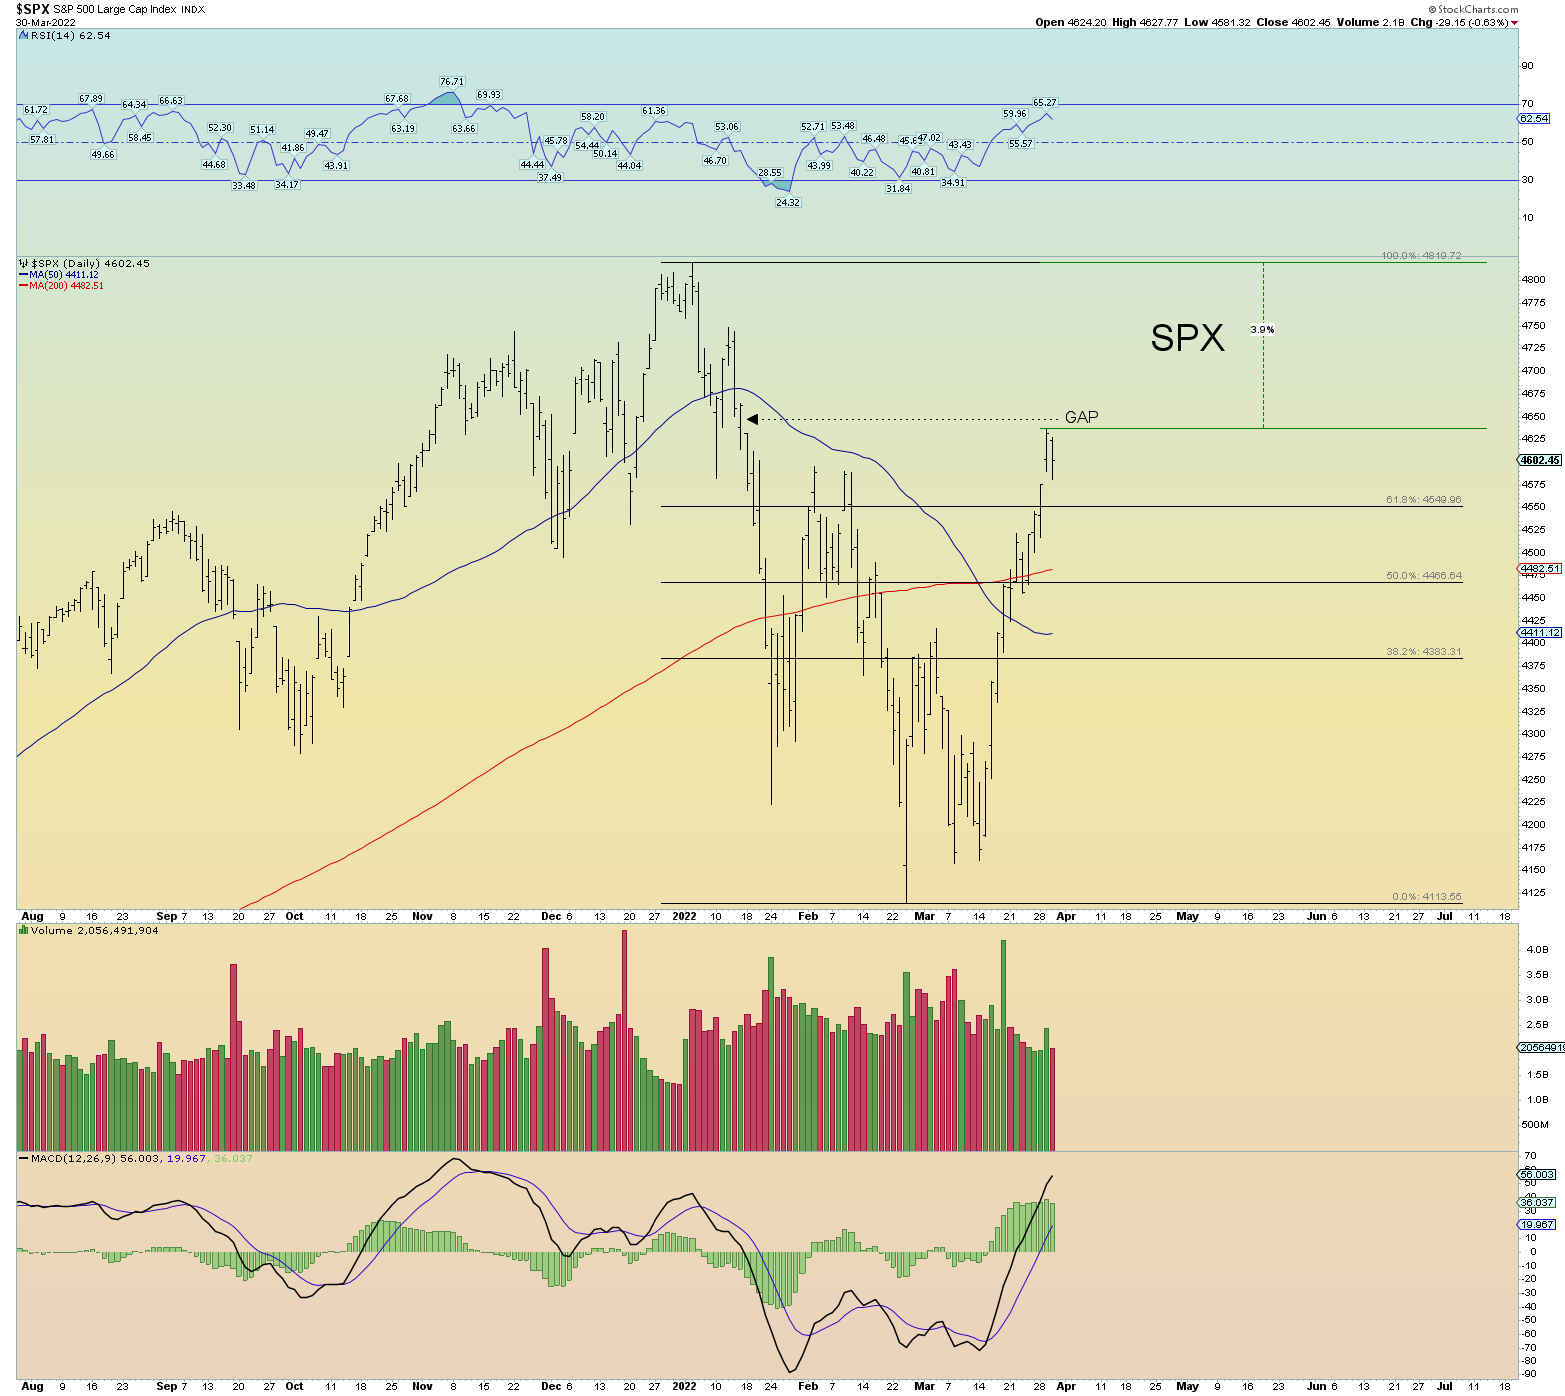
Using typical Elliott wave logic, at some point IF this is wave (2), it will end, and wave (3) down begins in earnest.
The trend/channel lines seem to matter.
Things never got “bearish” according to the CPCE. An amazing back-to-back print of .41 and .42 just occurred and today despite the down day. An astonishing amount of call vs. puts considering the yield curve is inverting. An irrational exuberance indeed!
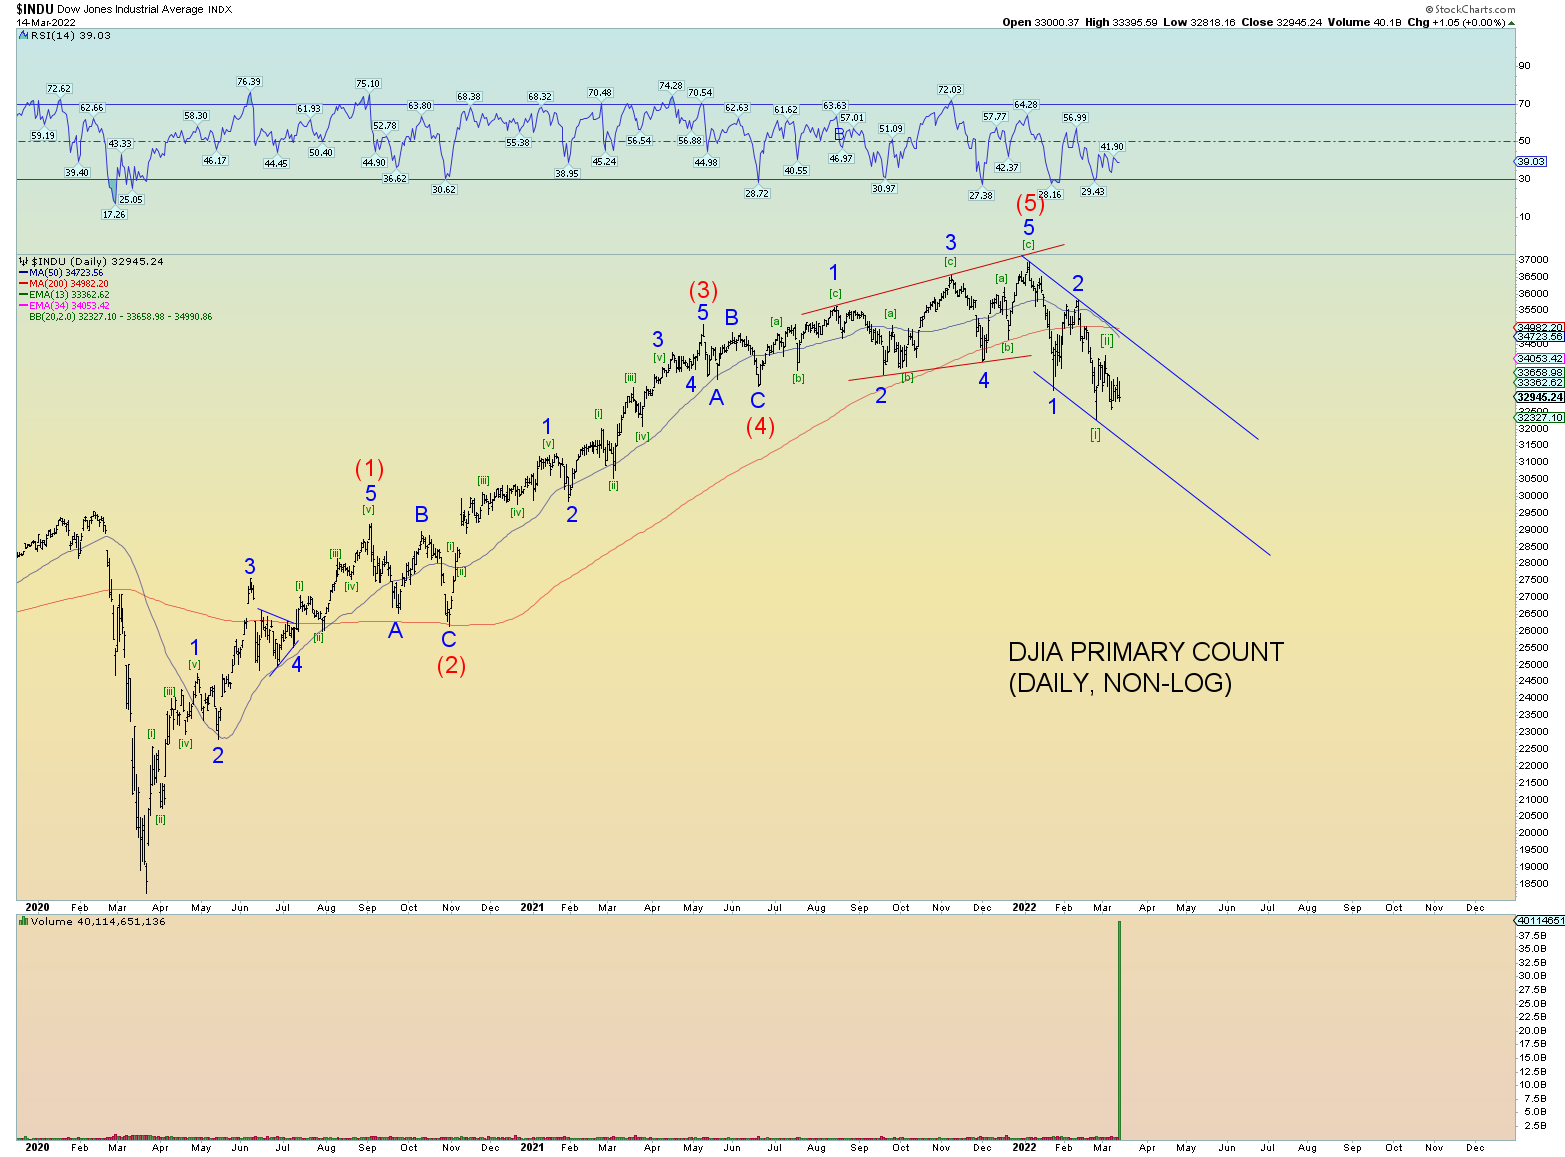
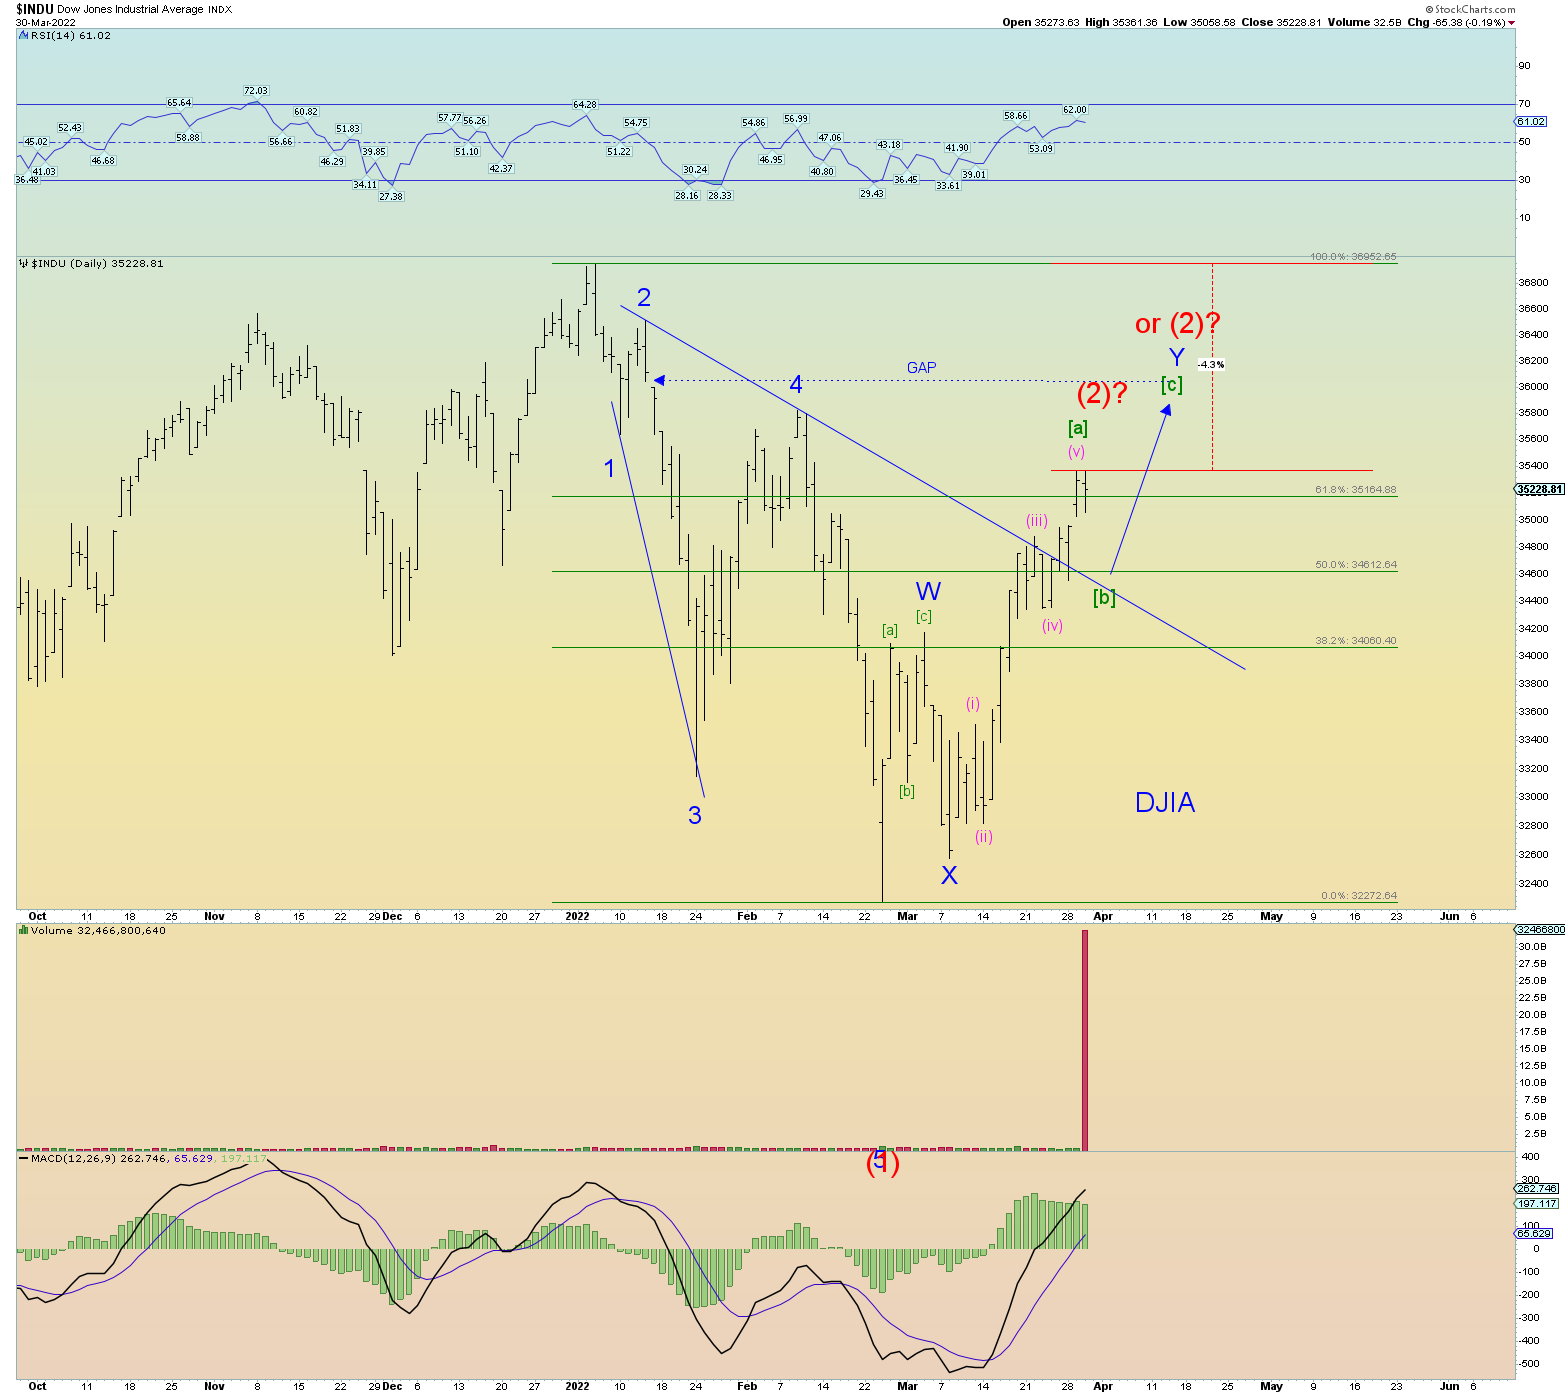
This is not a strong count for the DJIA, yet even so it was not a clear count months going into it’s January peak.
Elliott Wave Update ~ 29 Mar 2022

UPDATE

Significant price action today on expanding NYSE internals. Lots to unpack and talk about so let’s dive right in. I’ll comment on each chart as we go along.

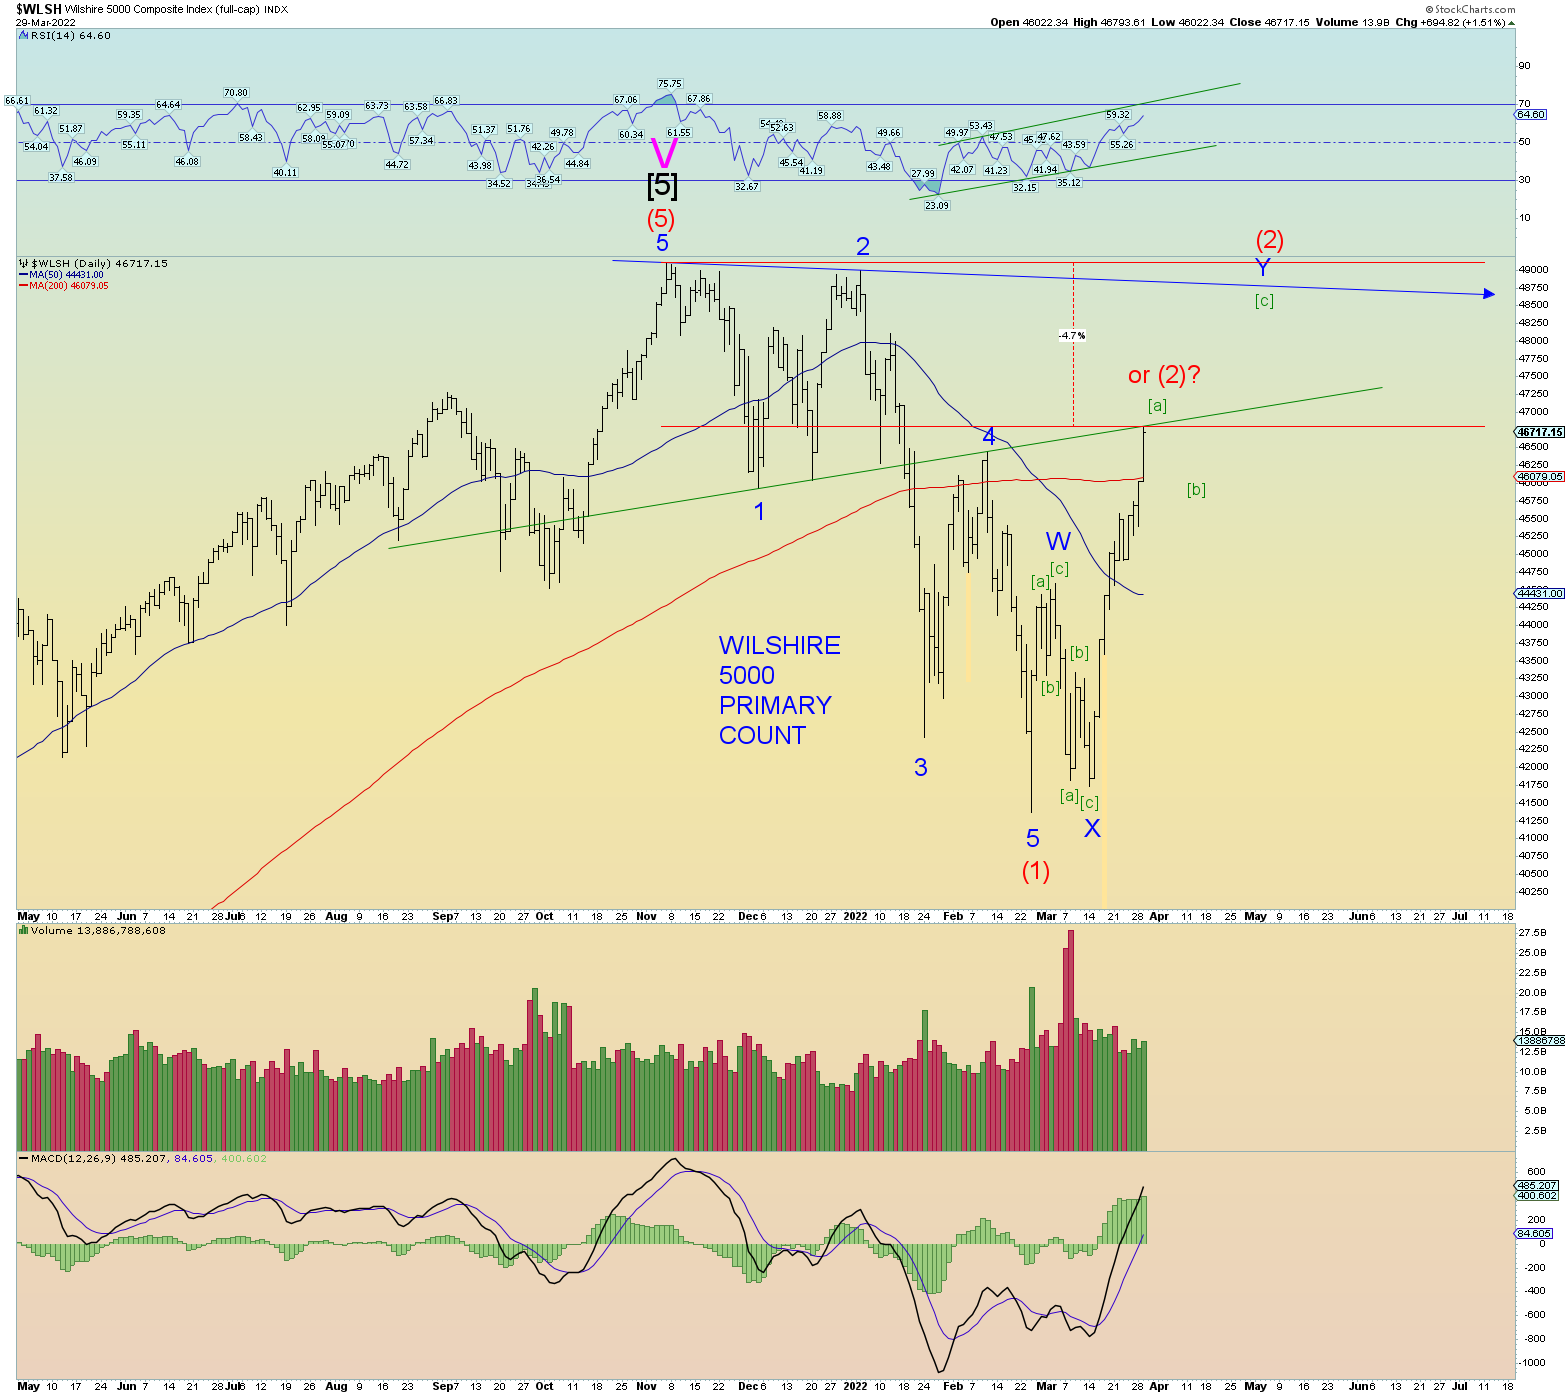
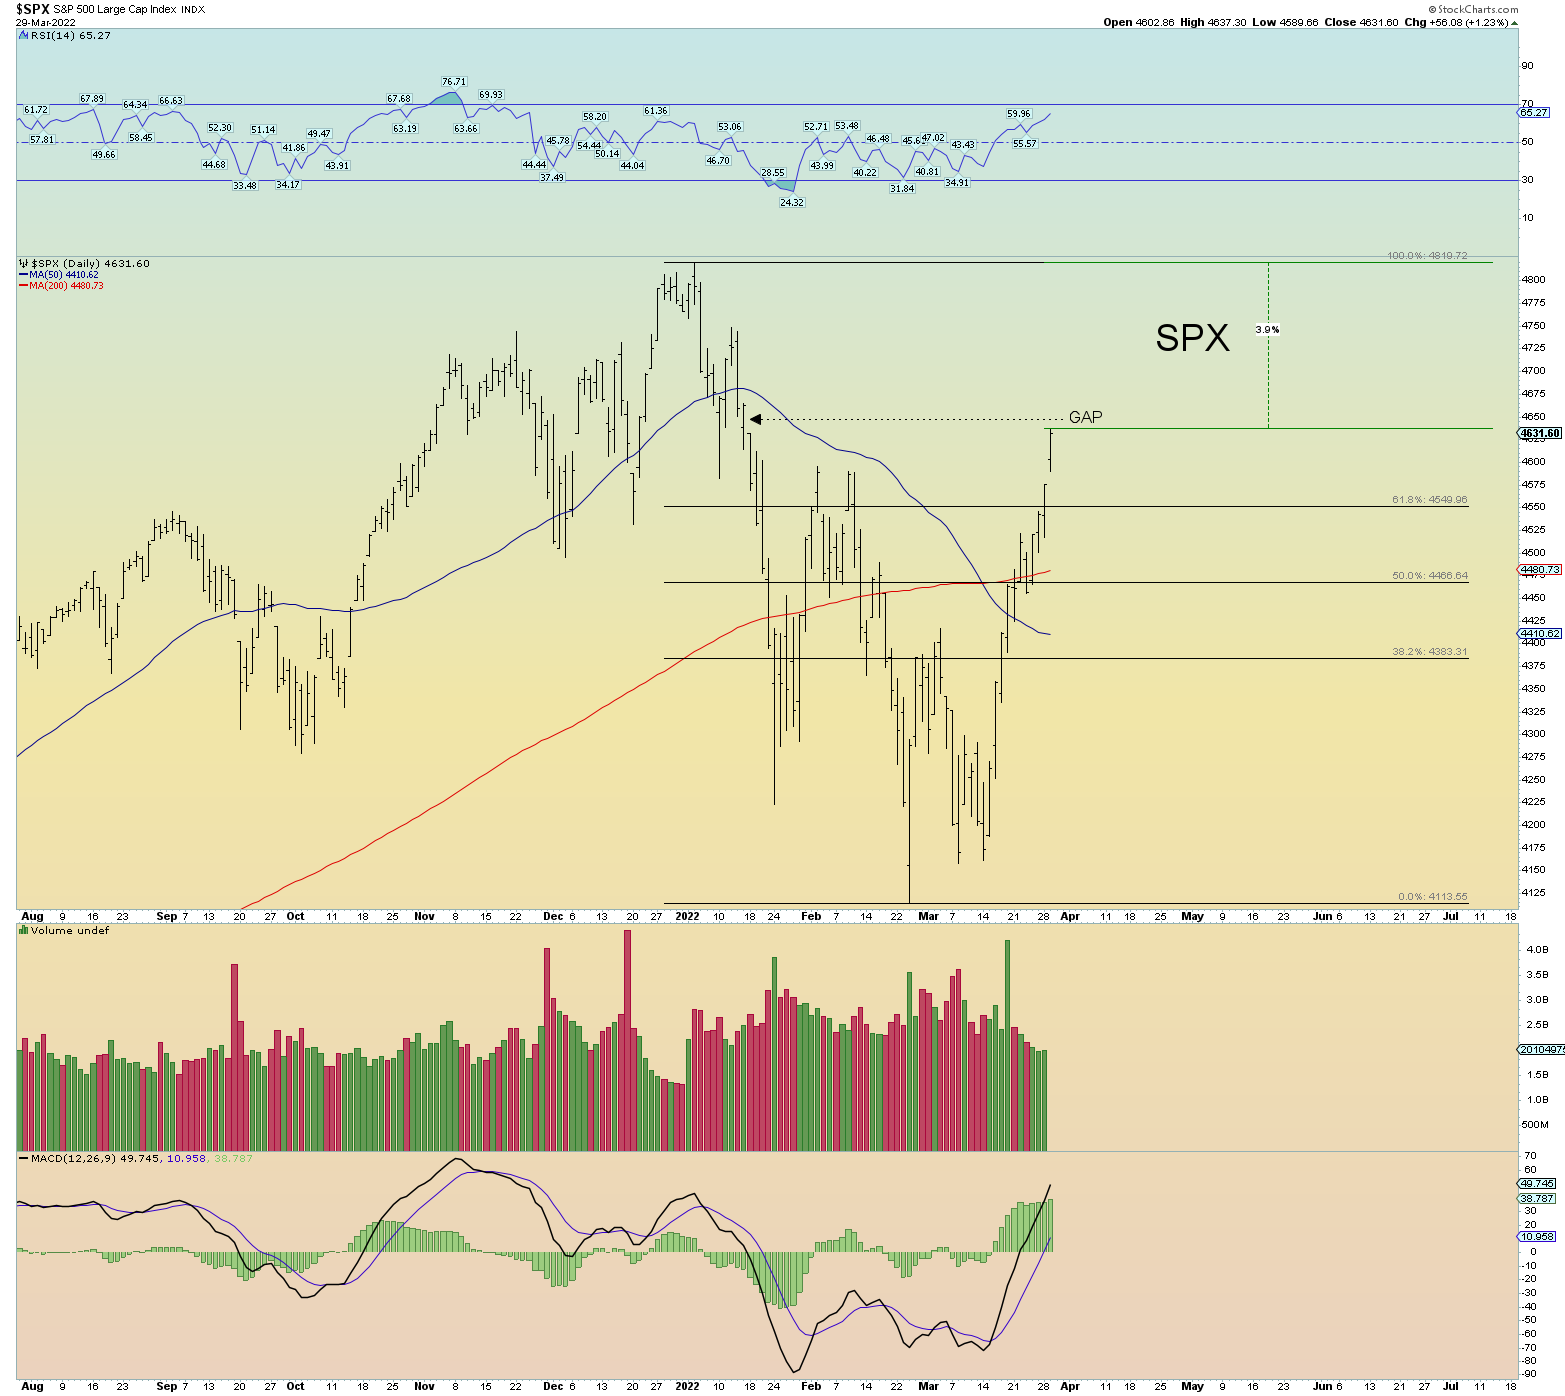
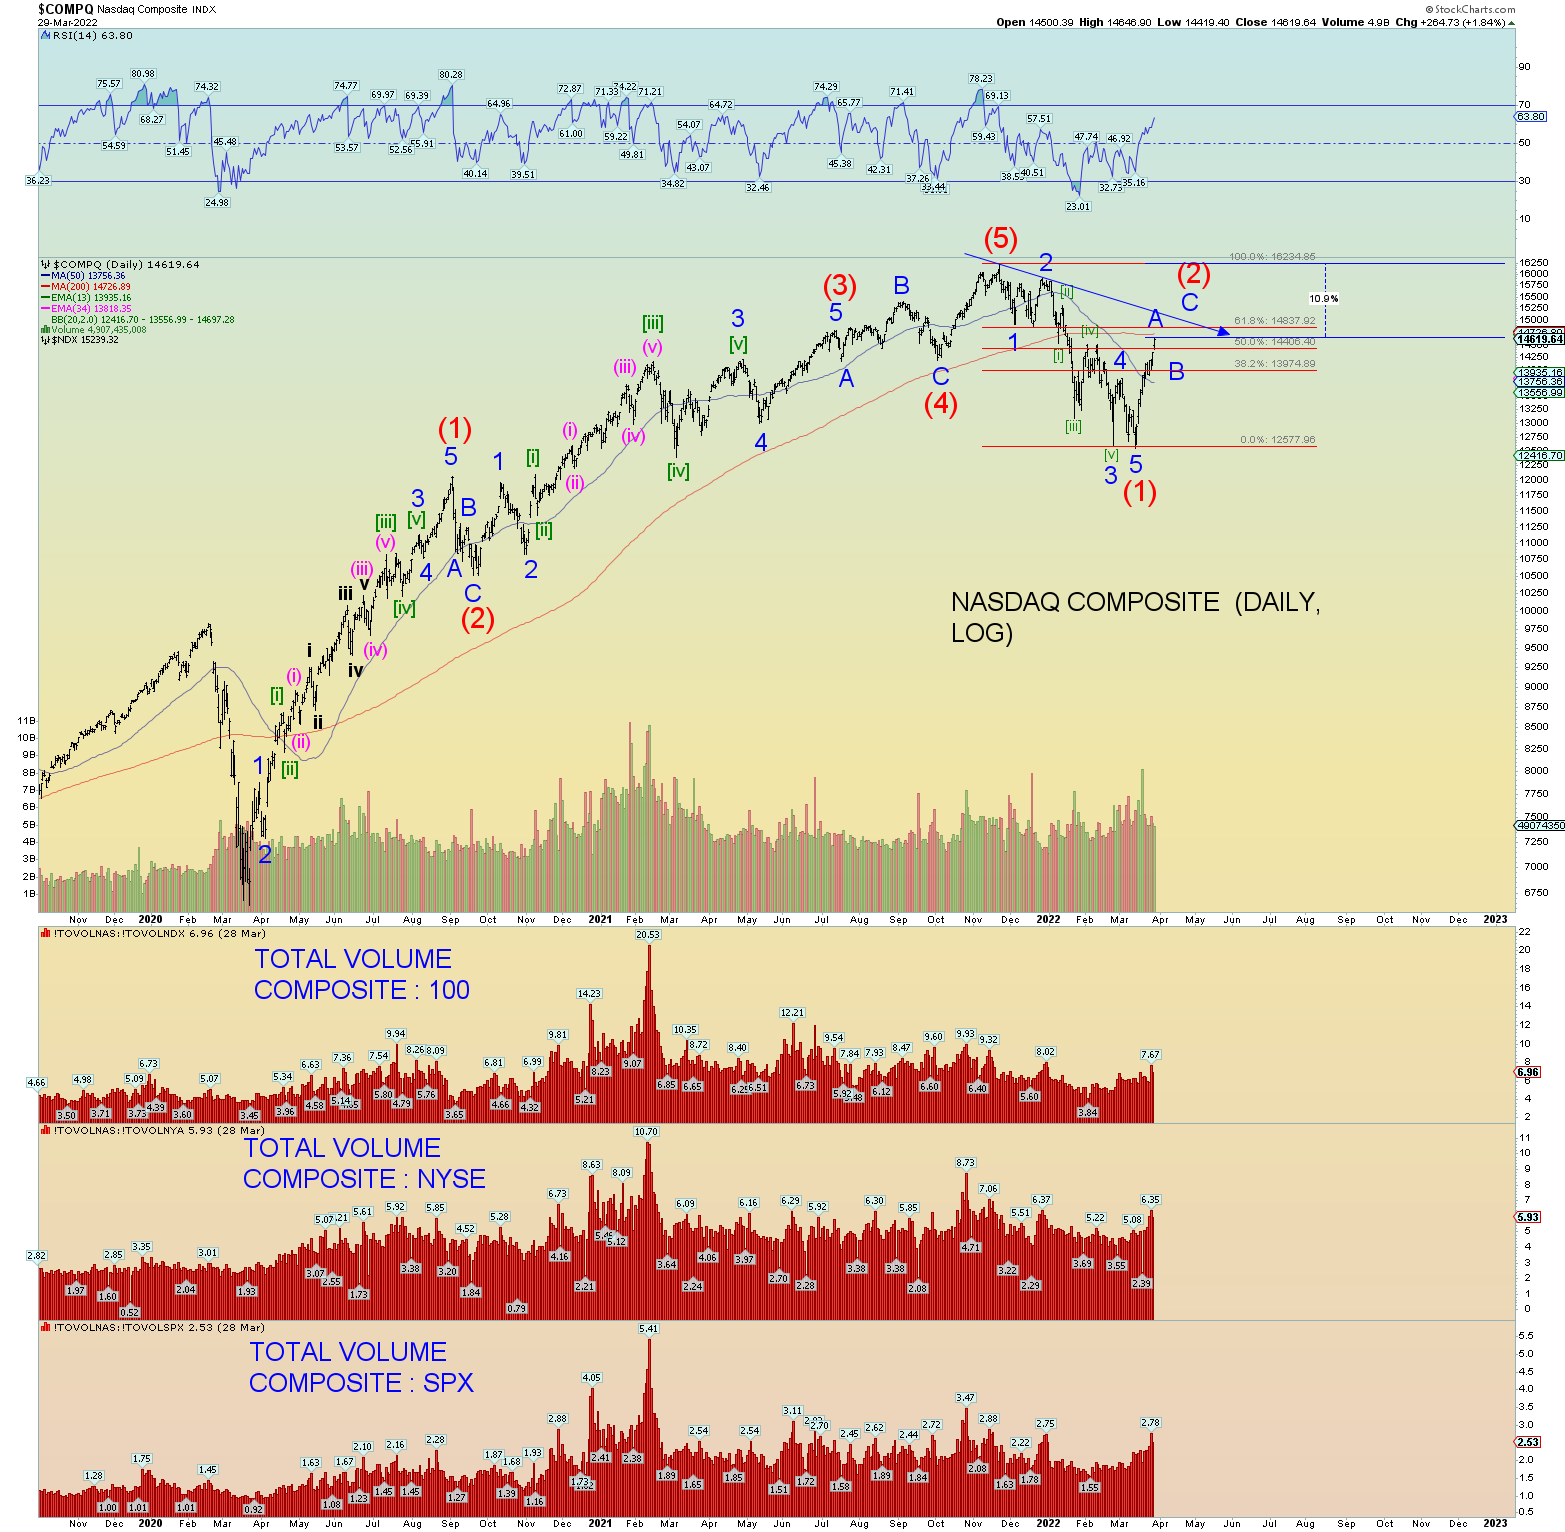
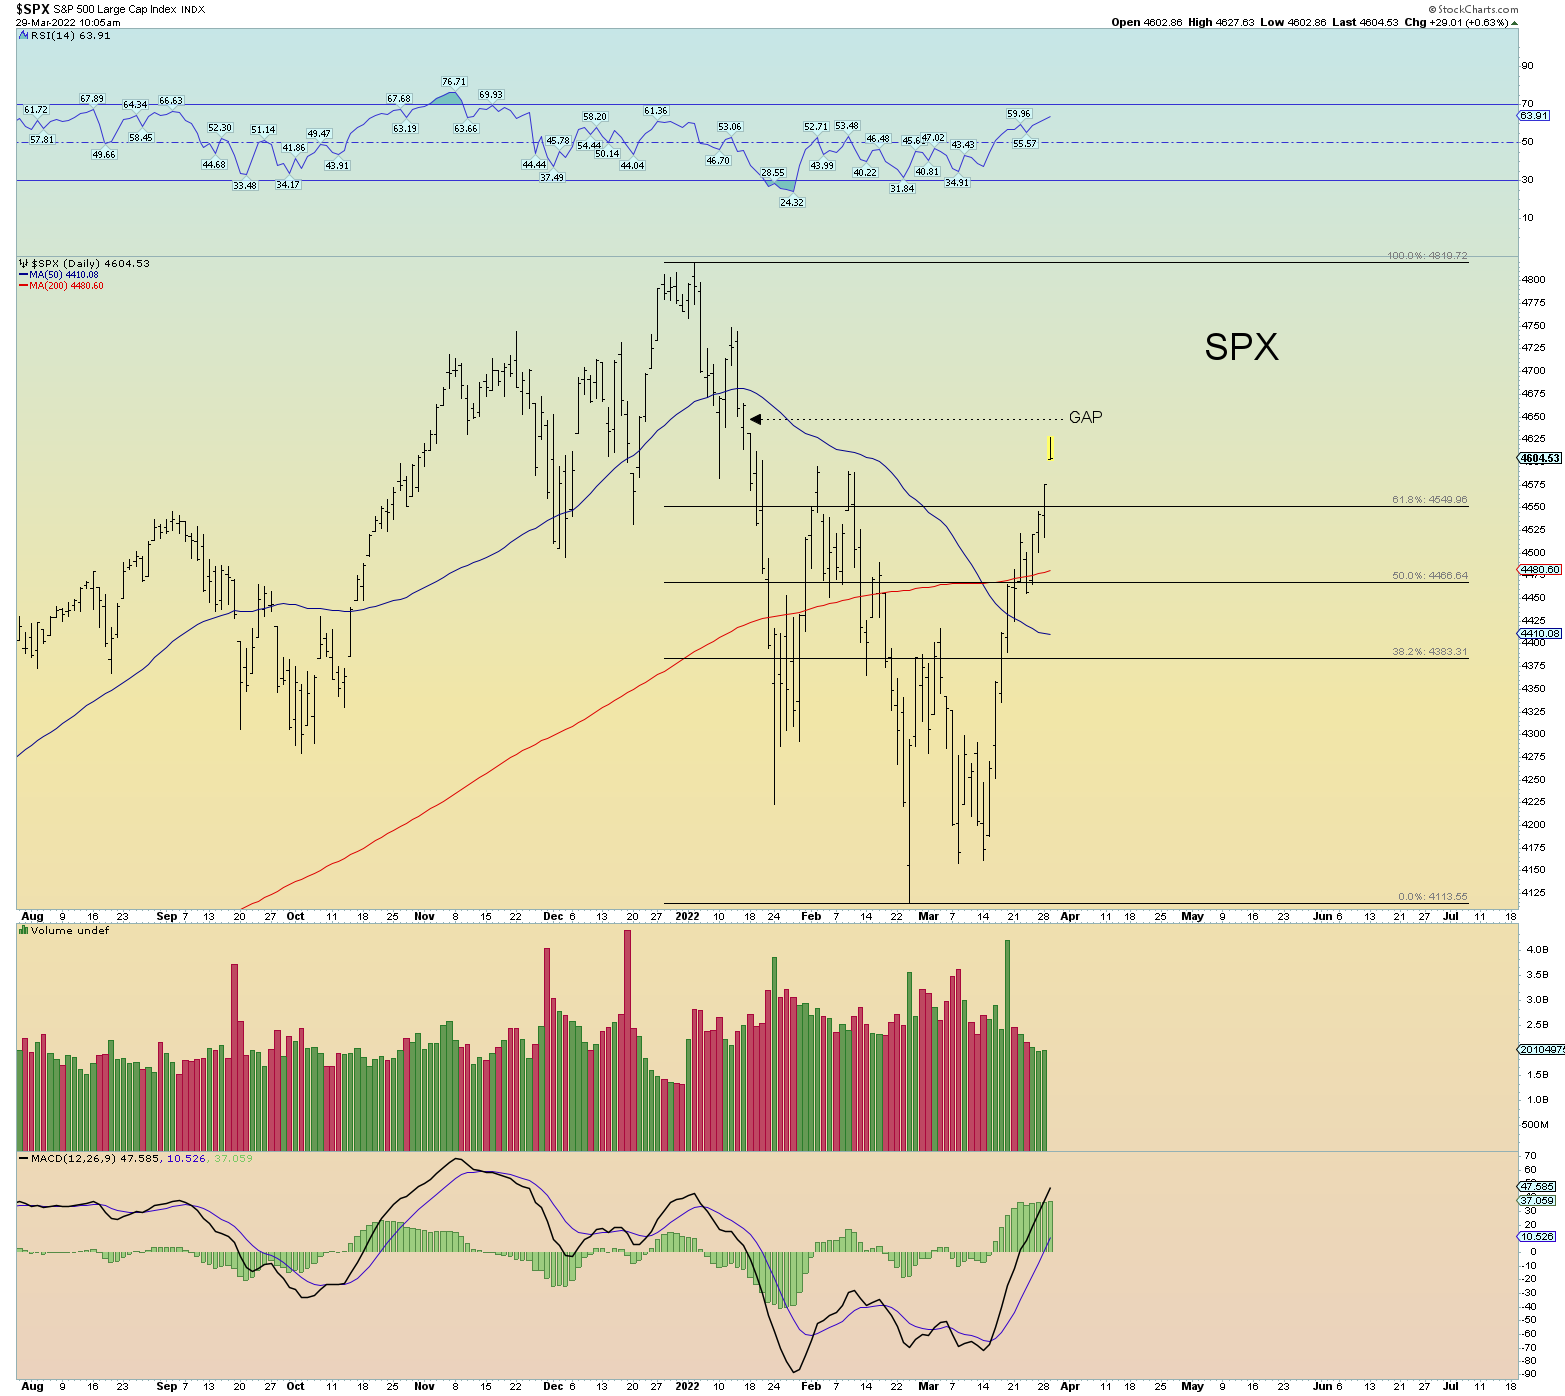
The NASDAQ Composite is some 11% still from peak. Yet the NYSE is a mere 2.6% from its peak. The Wilshire sits at about 4.7% from its November peak. The SPX is 3.9% and the DJIA is 4.3%.
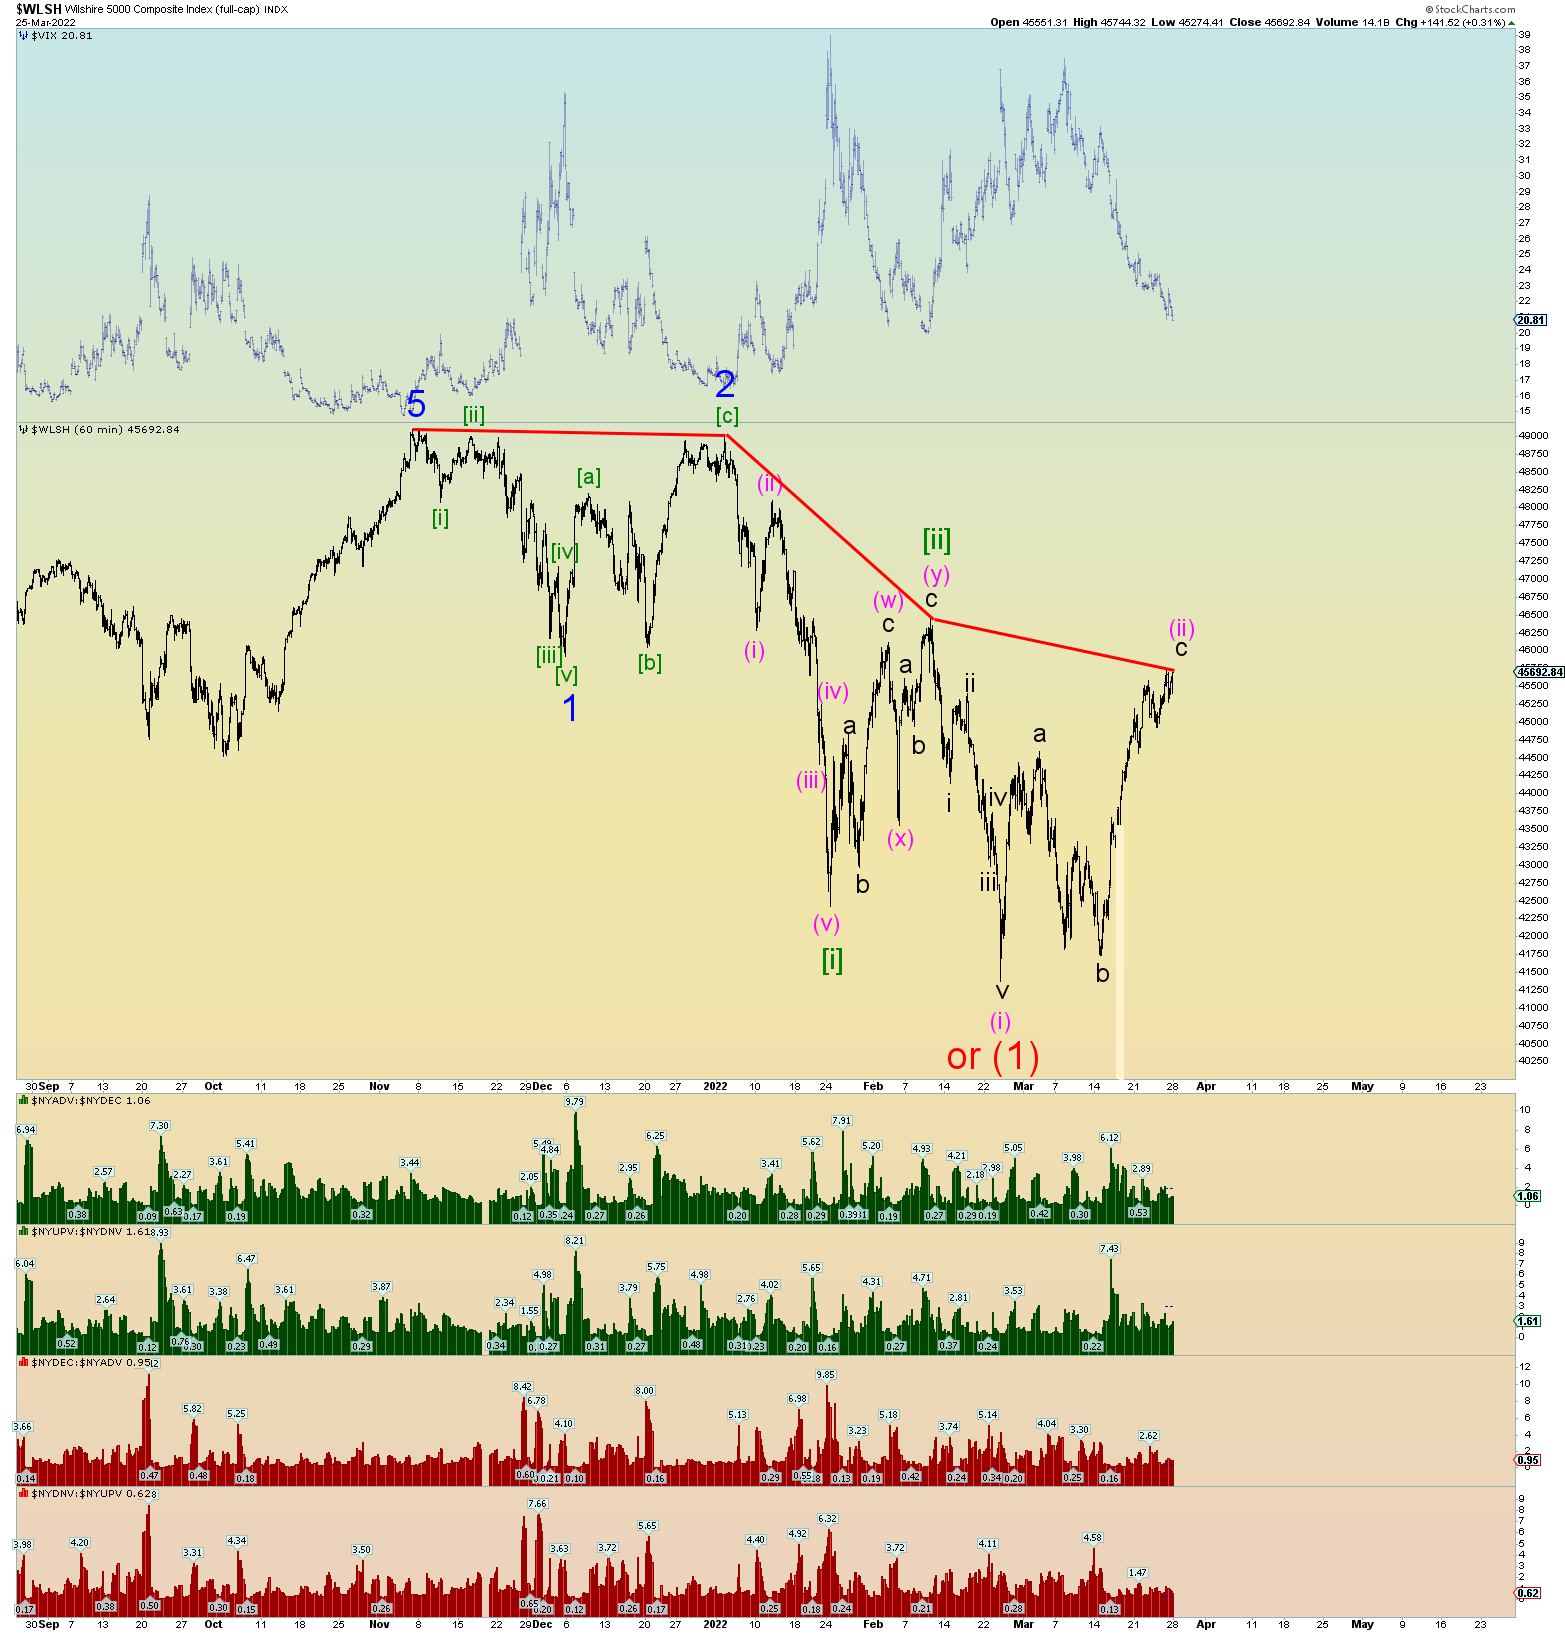
Therefore, the market is perhaps setting itself up for another round of potential market divergences/deviations. The NYSE, DJIA, and SPX may make new tops, or some may come close and some not. The NYSE, SPX, DJIA all do not have solid impulse 5 wave moves lower from their early January peaks which suggests “corrective”. The Wilshire 5000 and Composite (and Russell 2000 for that matter) are satisfactory impulse 5 wave moves lower. So, we have to consider them all together perhaps. the best count for those indexes is that wave (2), although perhaps getting deep on the Wilshire is playing out and that the November peak will hold.

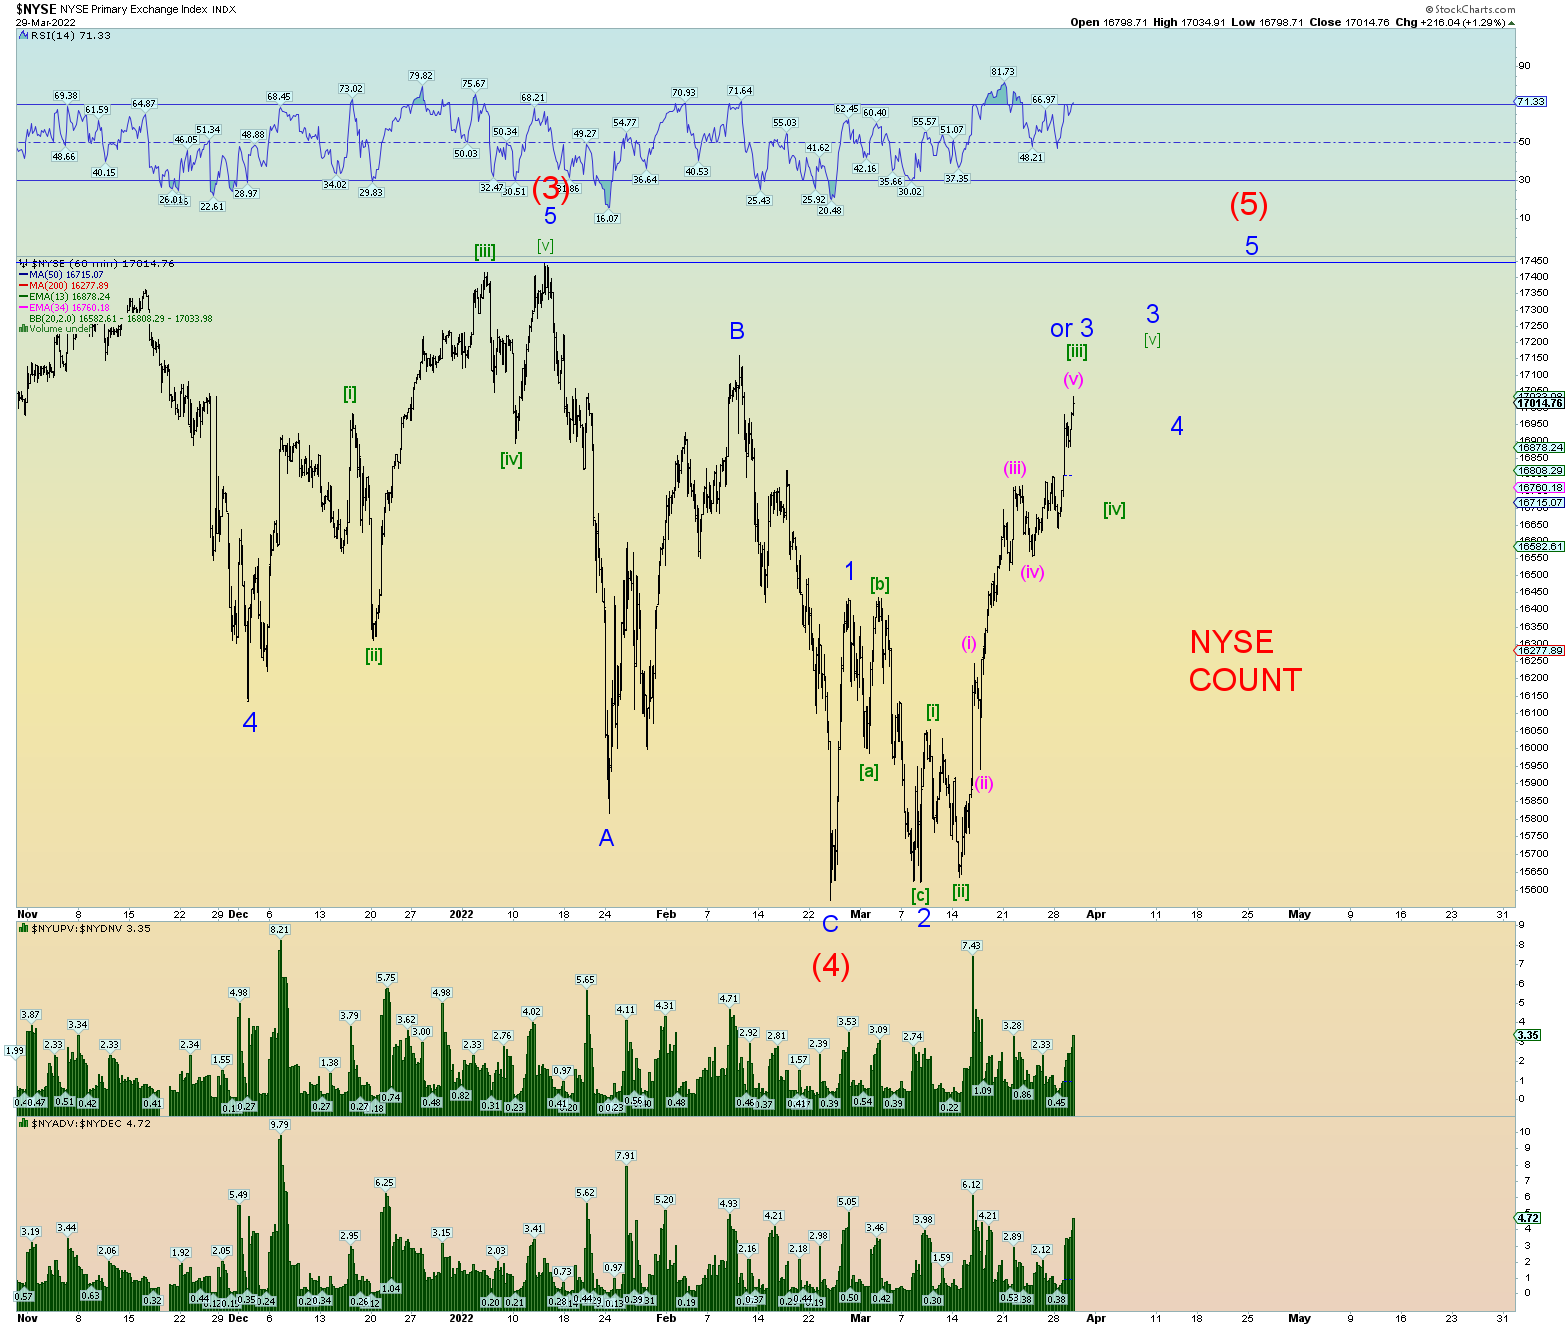
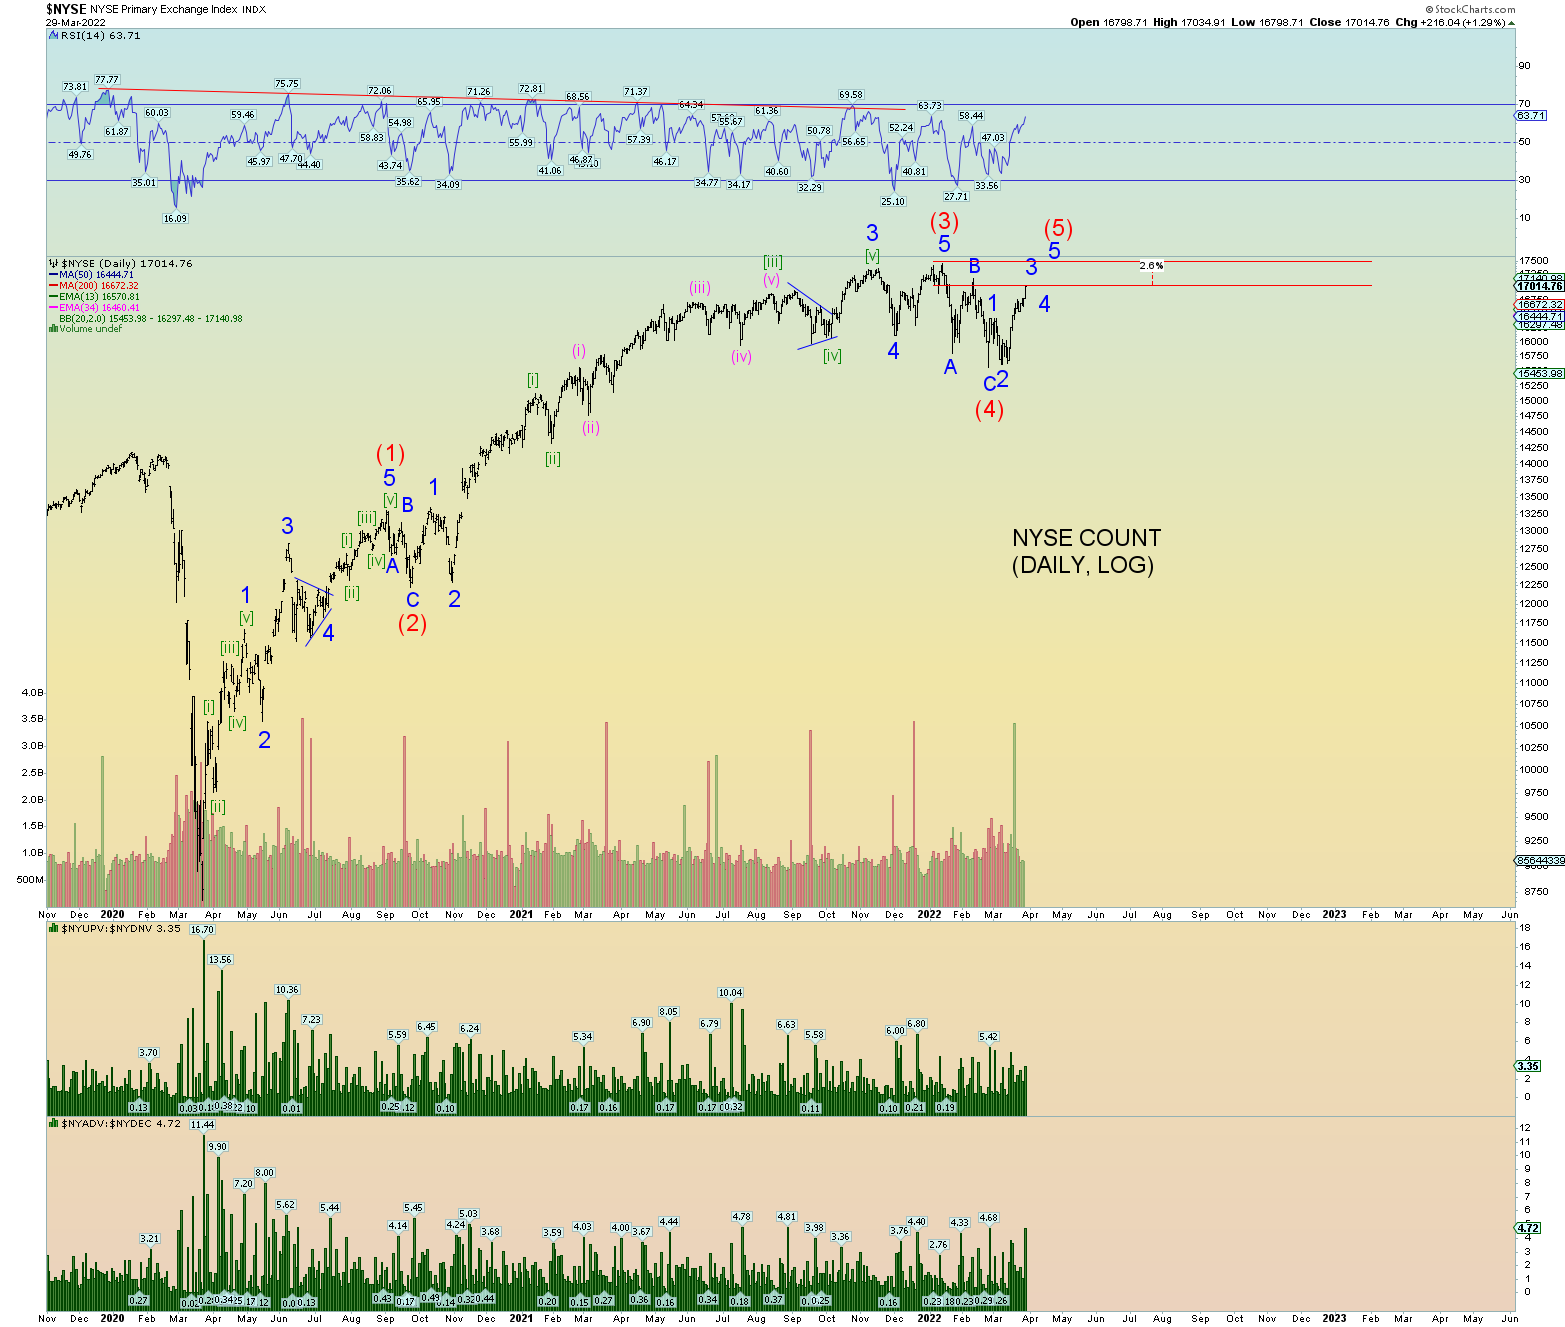
Let’s start with the NYSE since it is the closest to a new peak. The best count is below. This suggests we are nearing the top of a Minor 3 of (5), then pullback for 4 and then push to 5 of (5). All that is required is a new all-time high price.
Squiggle count :

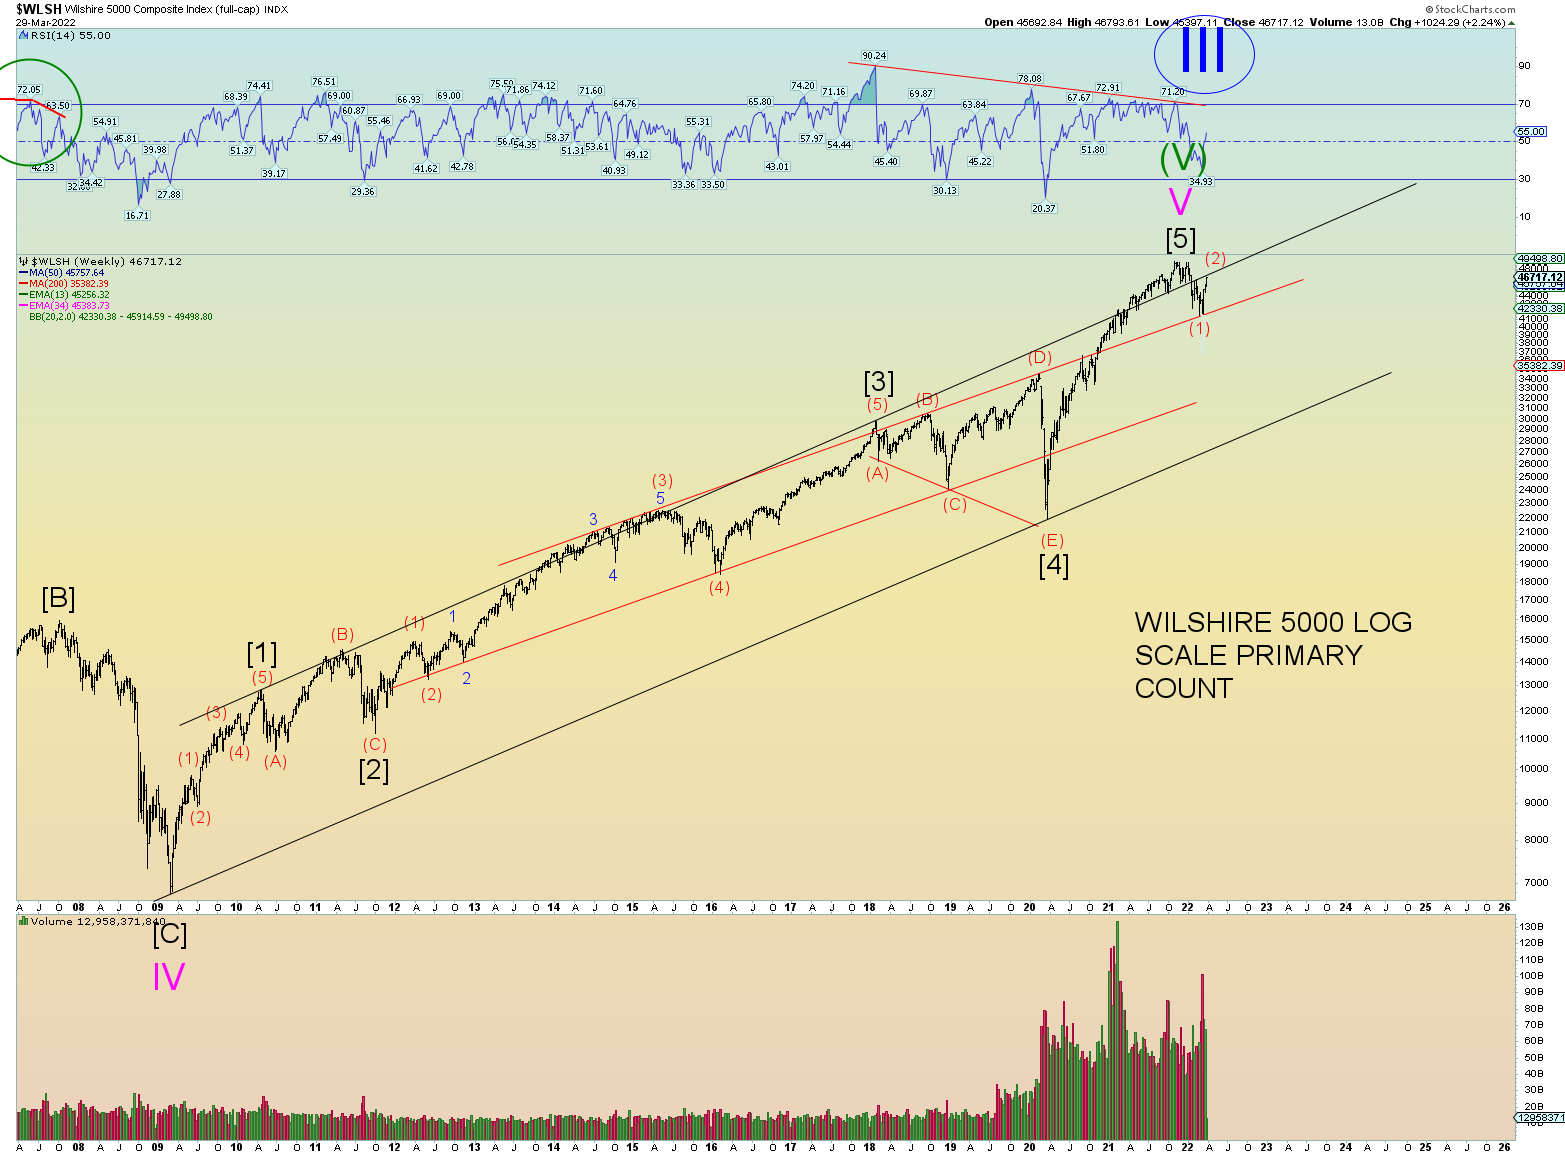
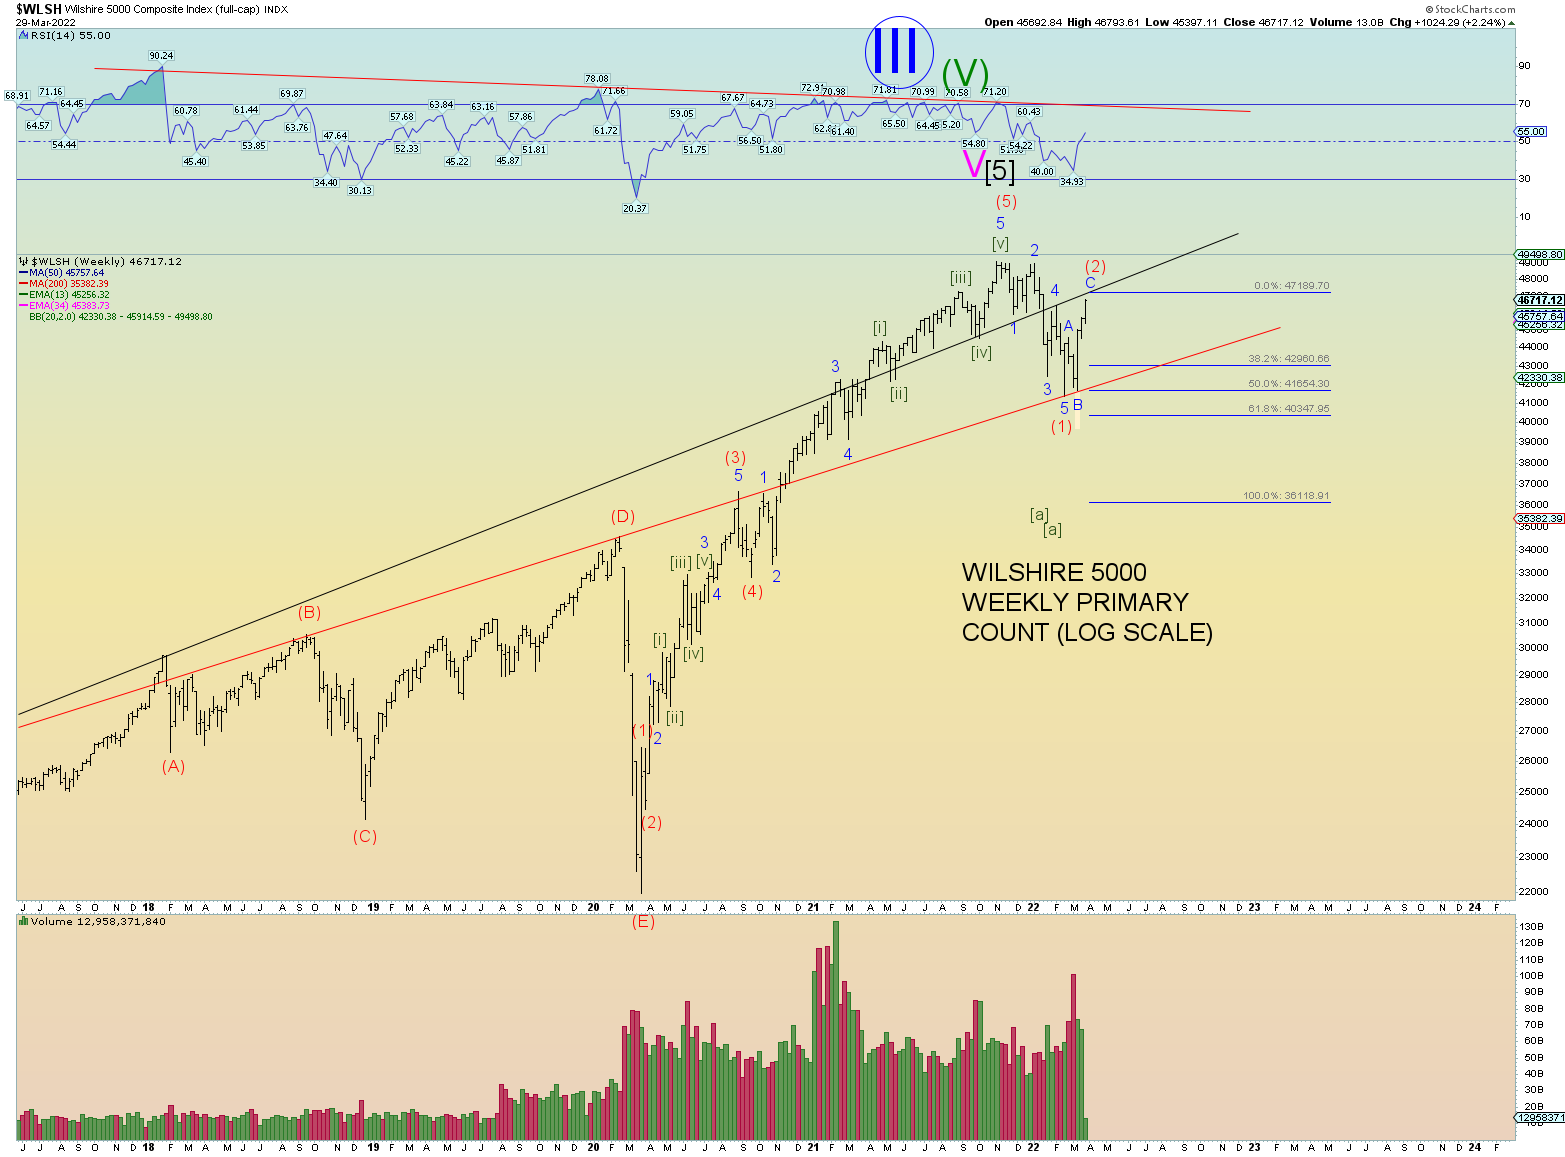
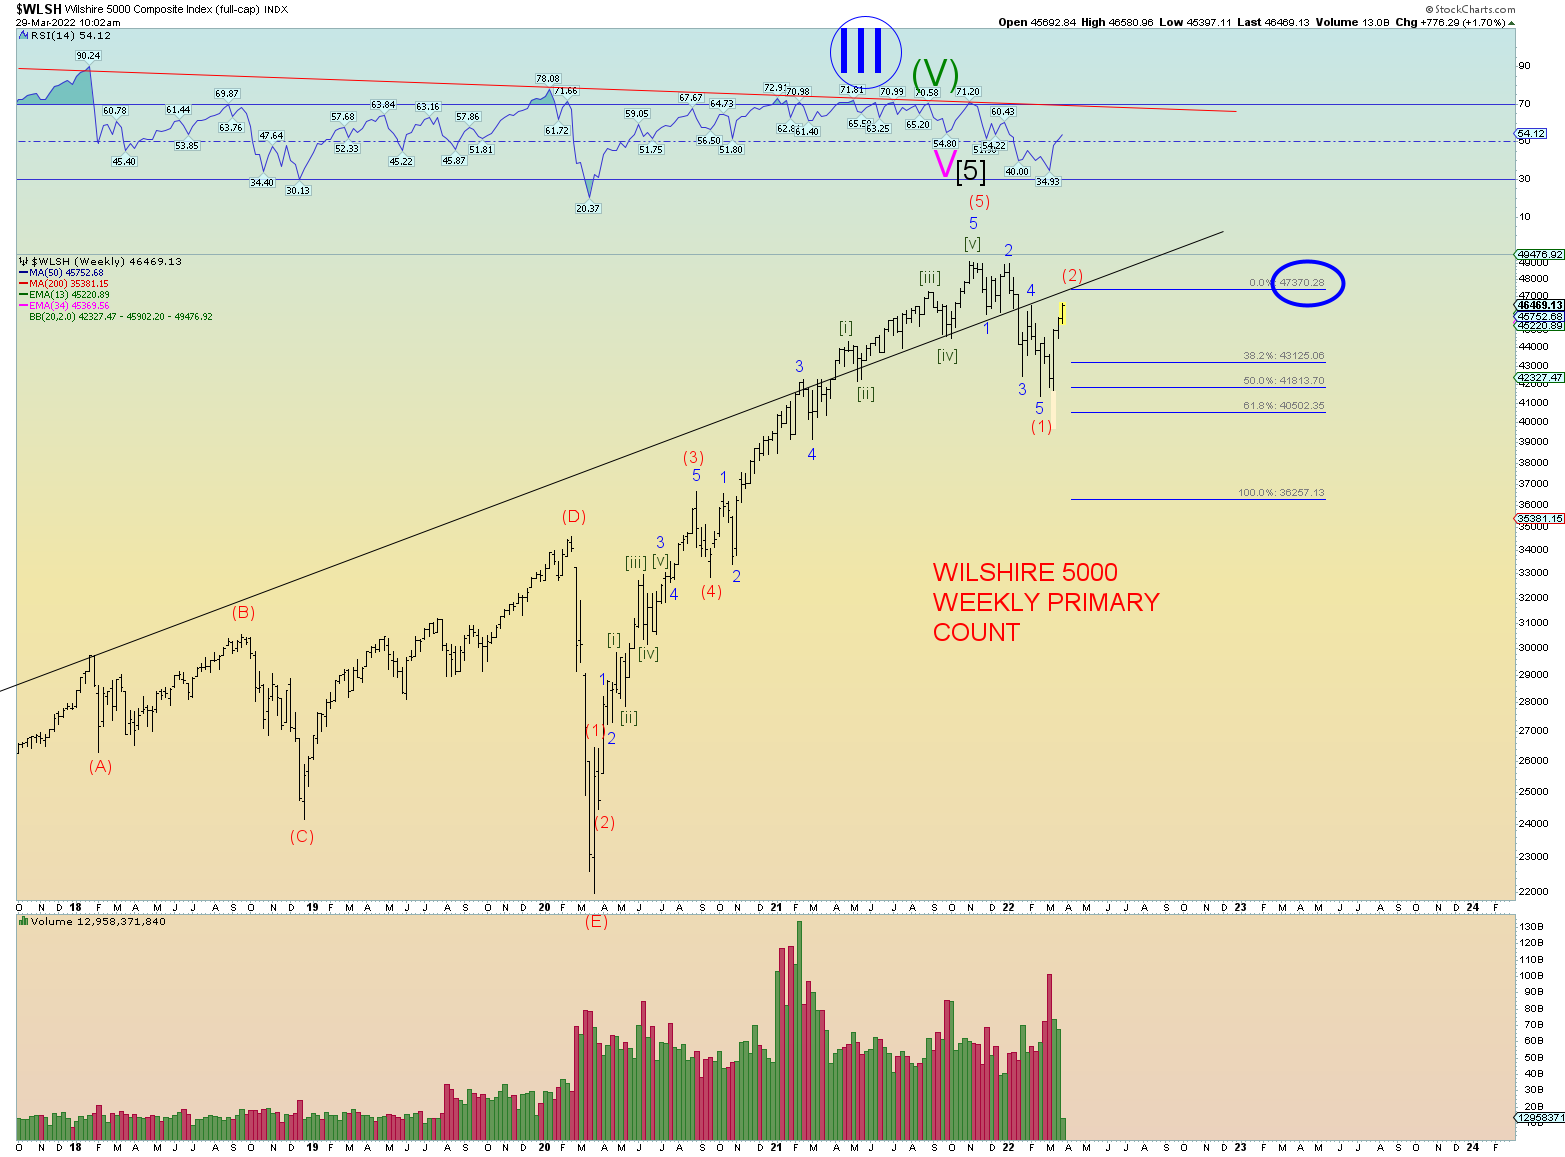
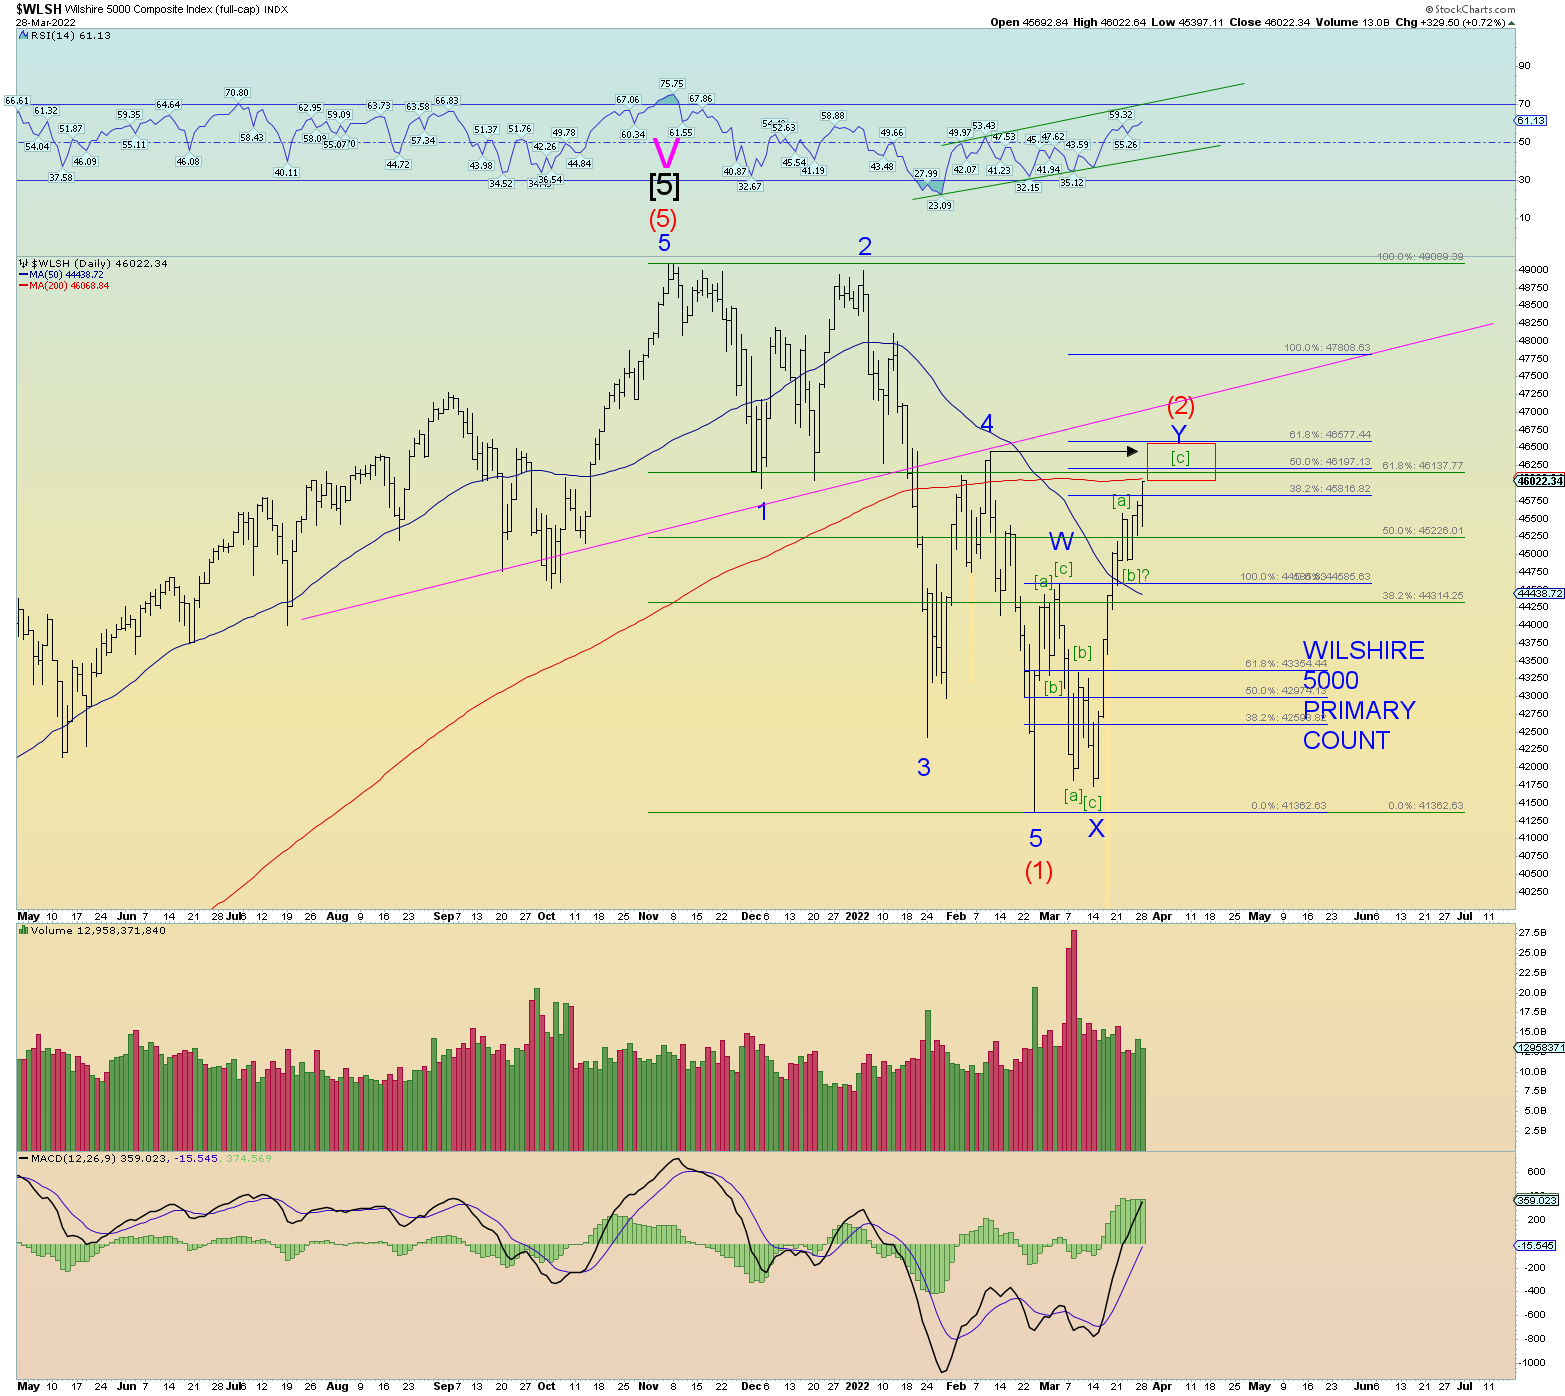
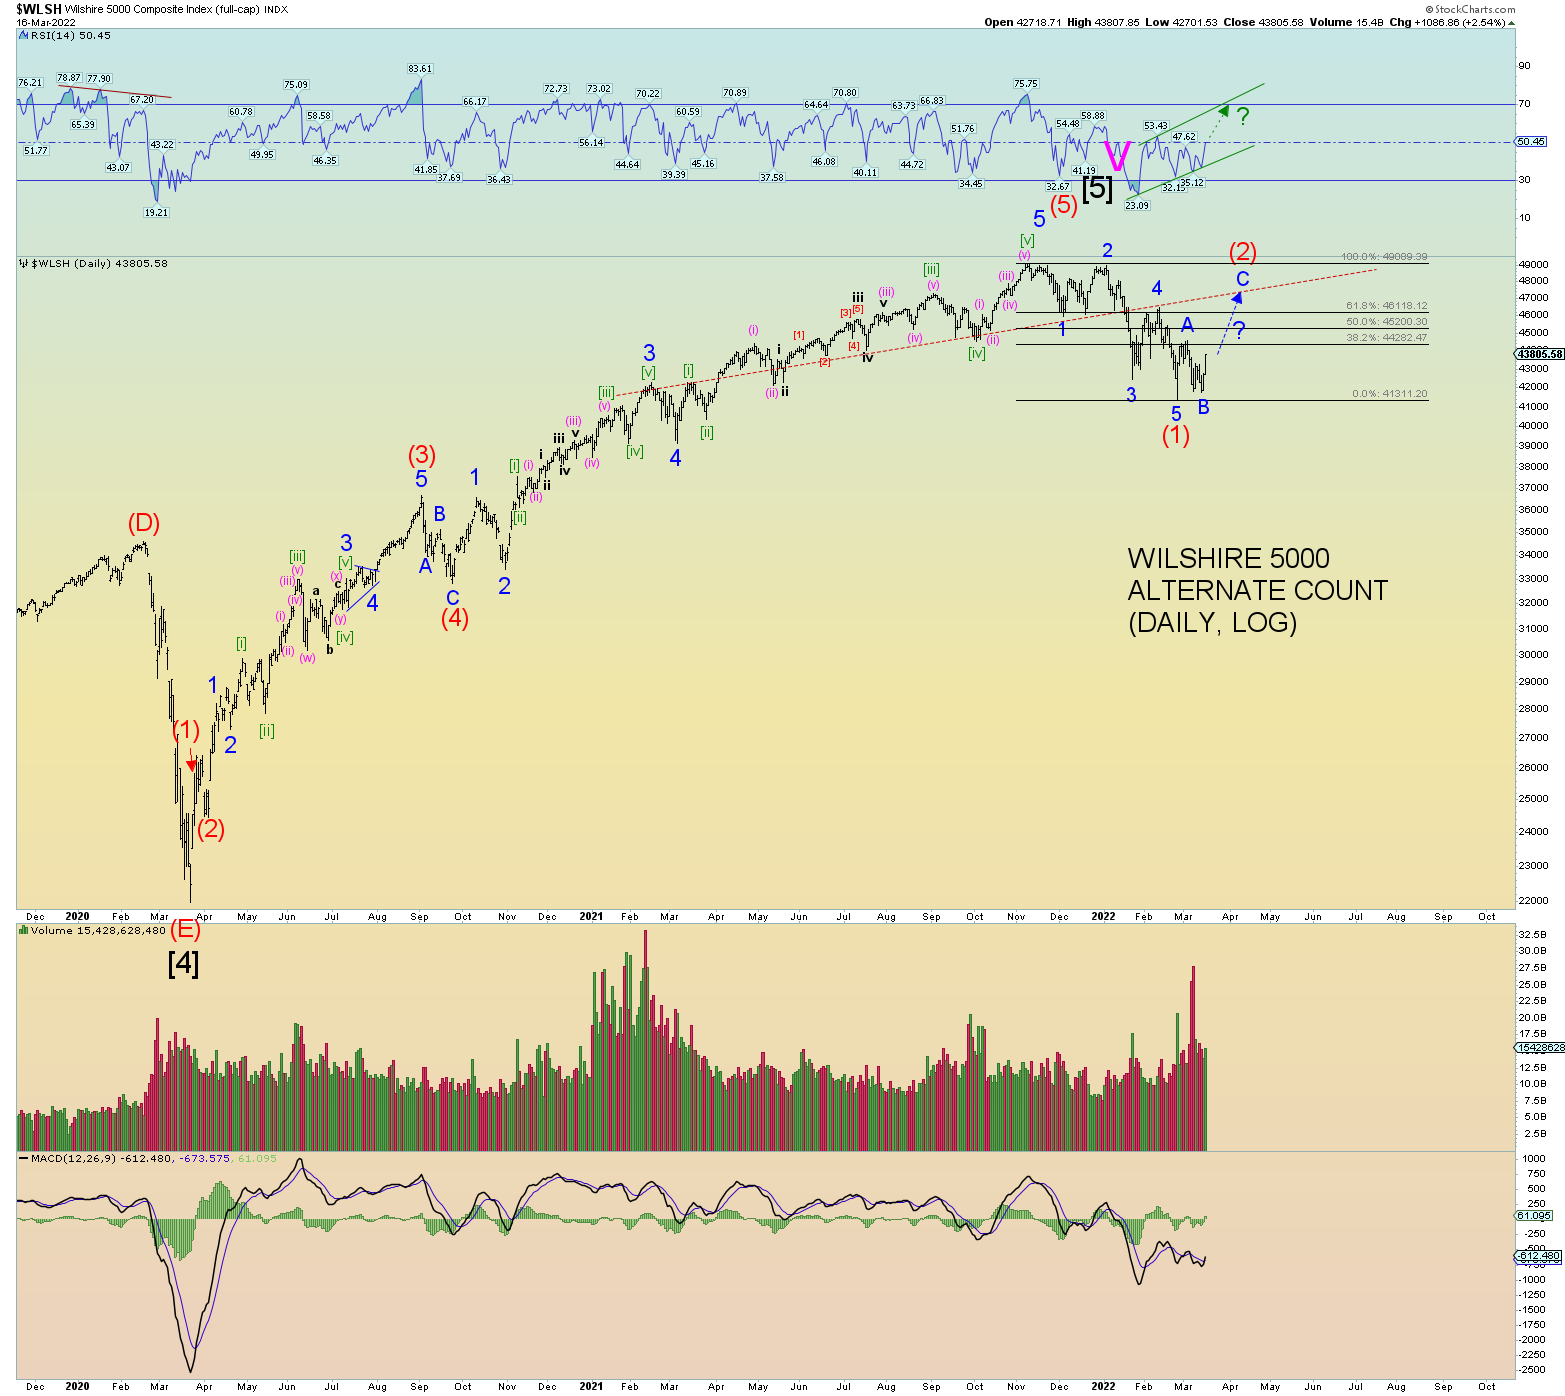
And now the Wilshire 5000. Here is perhaps a simple way of looking at things. Testing the upper channel line:

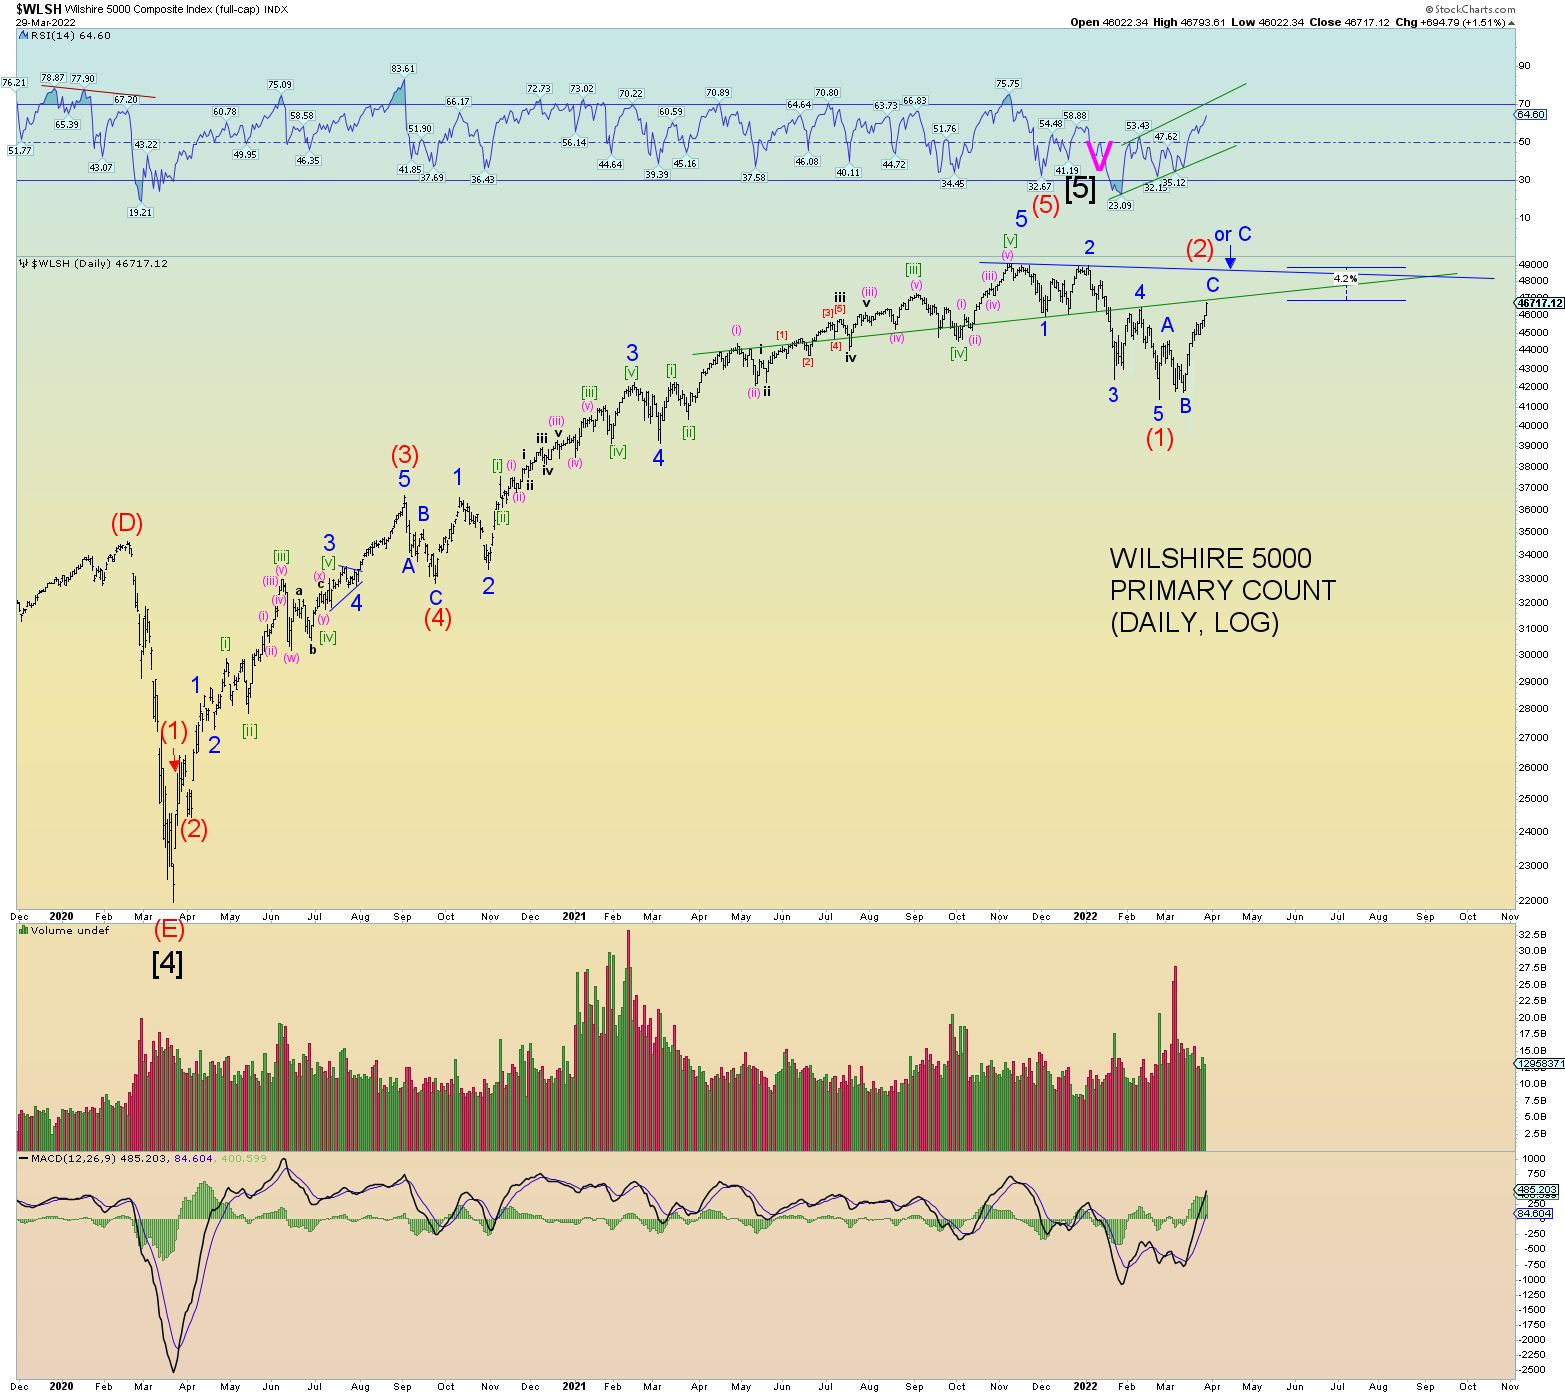
A closer look:

At the moment we have a “back test” of the broken head and shoulders neckline. This is not quite the same as the long-term upper channel line as shown on the weekly but they are similar its just that the angle of this neckline is more flat and properly placed for a H&S pattern.

Note how the Wilshire could gain 4.2% more in prices to be back at the blue downtrend line formed by the all-time peak and wave 2 of (1) peak. This area would be a struggle because prices would be rotating about the long-term upper channel line again.
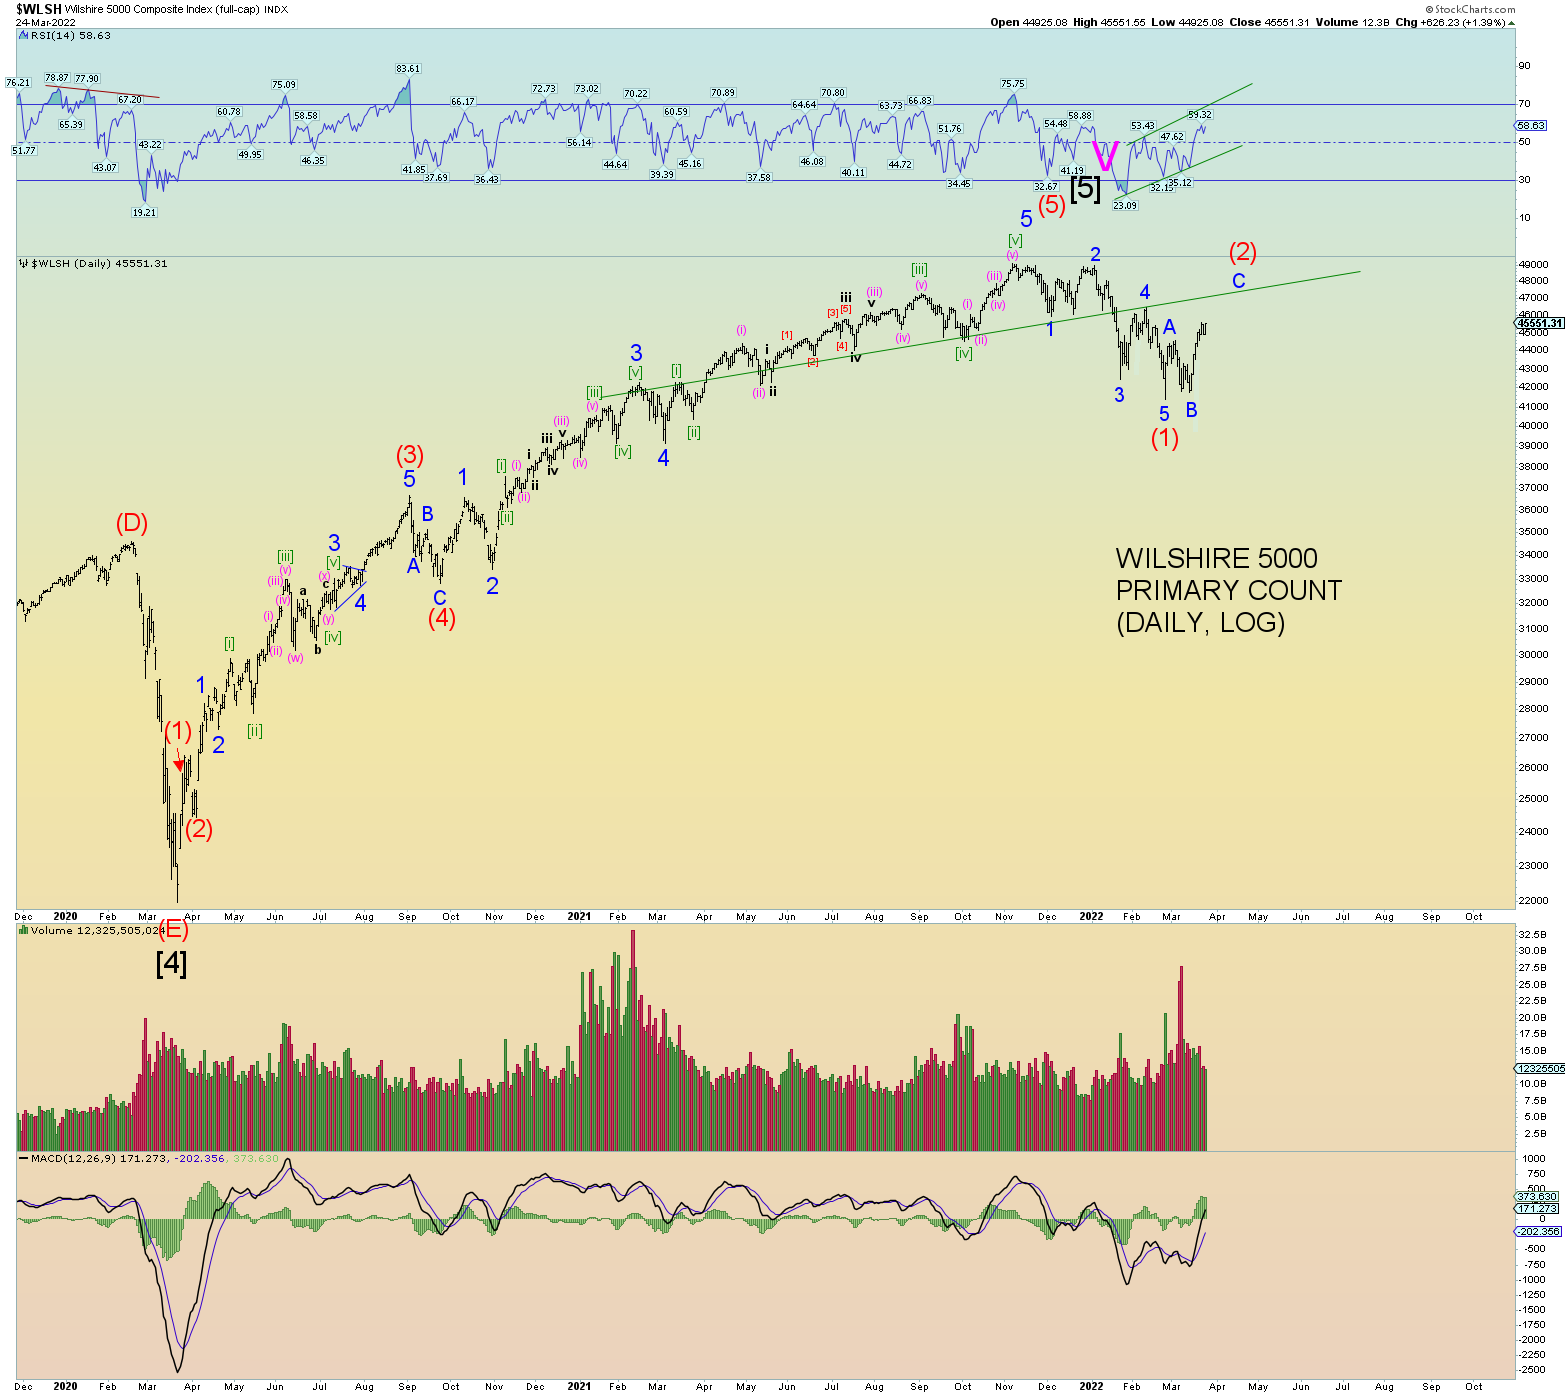
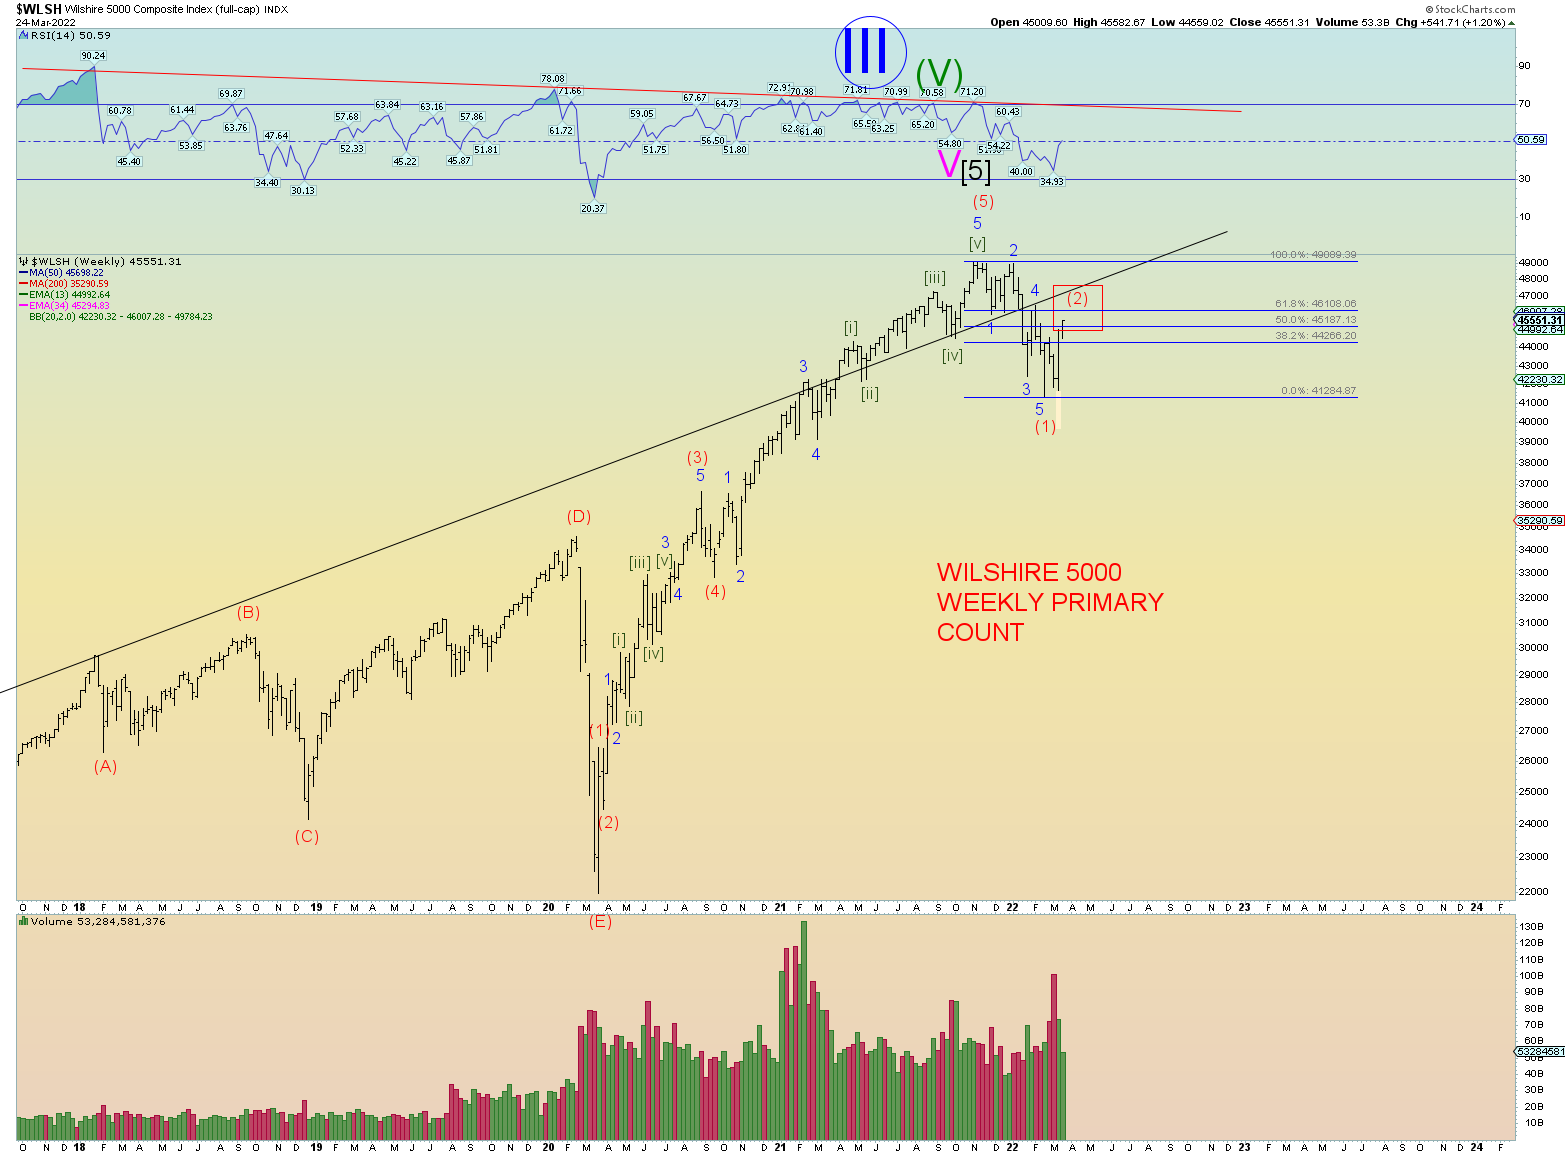
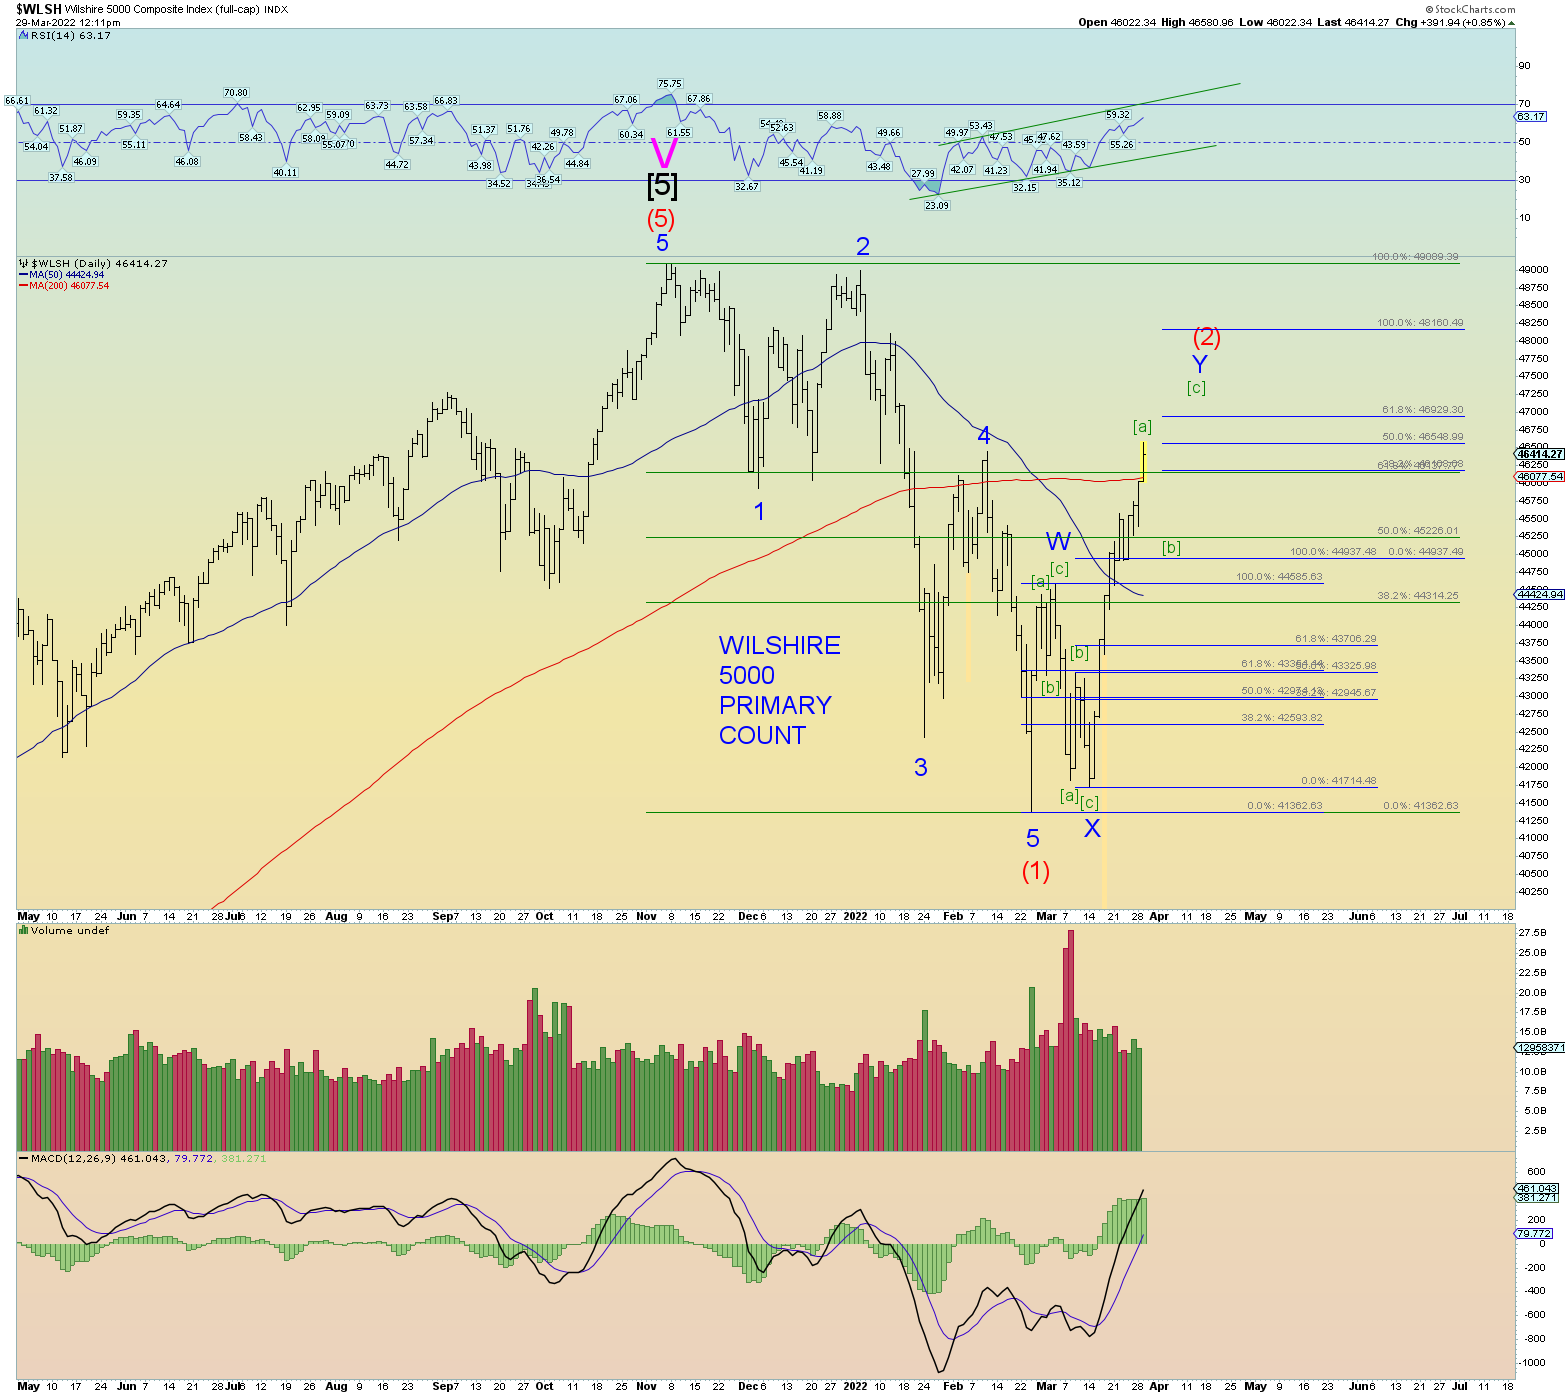
Ultimately, if we do get the extreme retrace – much like the wave 2 of (1) of early January, then the blue down sloping trendline may be the stopping point sometime in April. Since we had overlap of wave 1 and 4 of (1) down, this actually predicts a deep retrace for (2) since it was not a pure “clean” impulse move lower much like wave 1 of (1) down was not “clean” (although it was 9 waves down which is a “cousin” of the 5 wave move) and thus 2 of (1) retraced very deep.

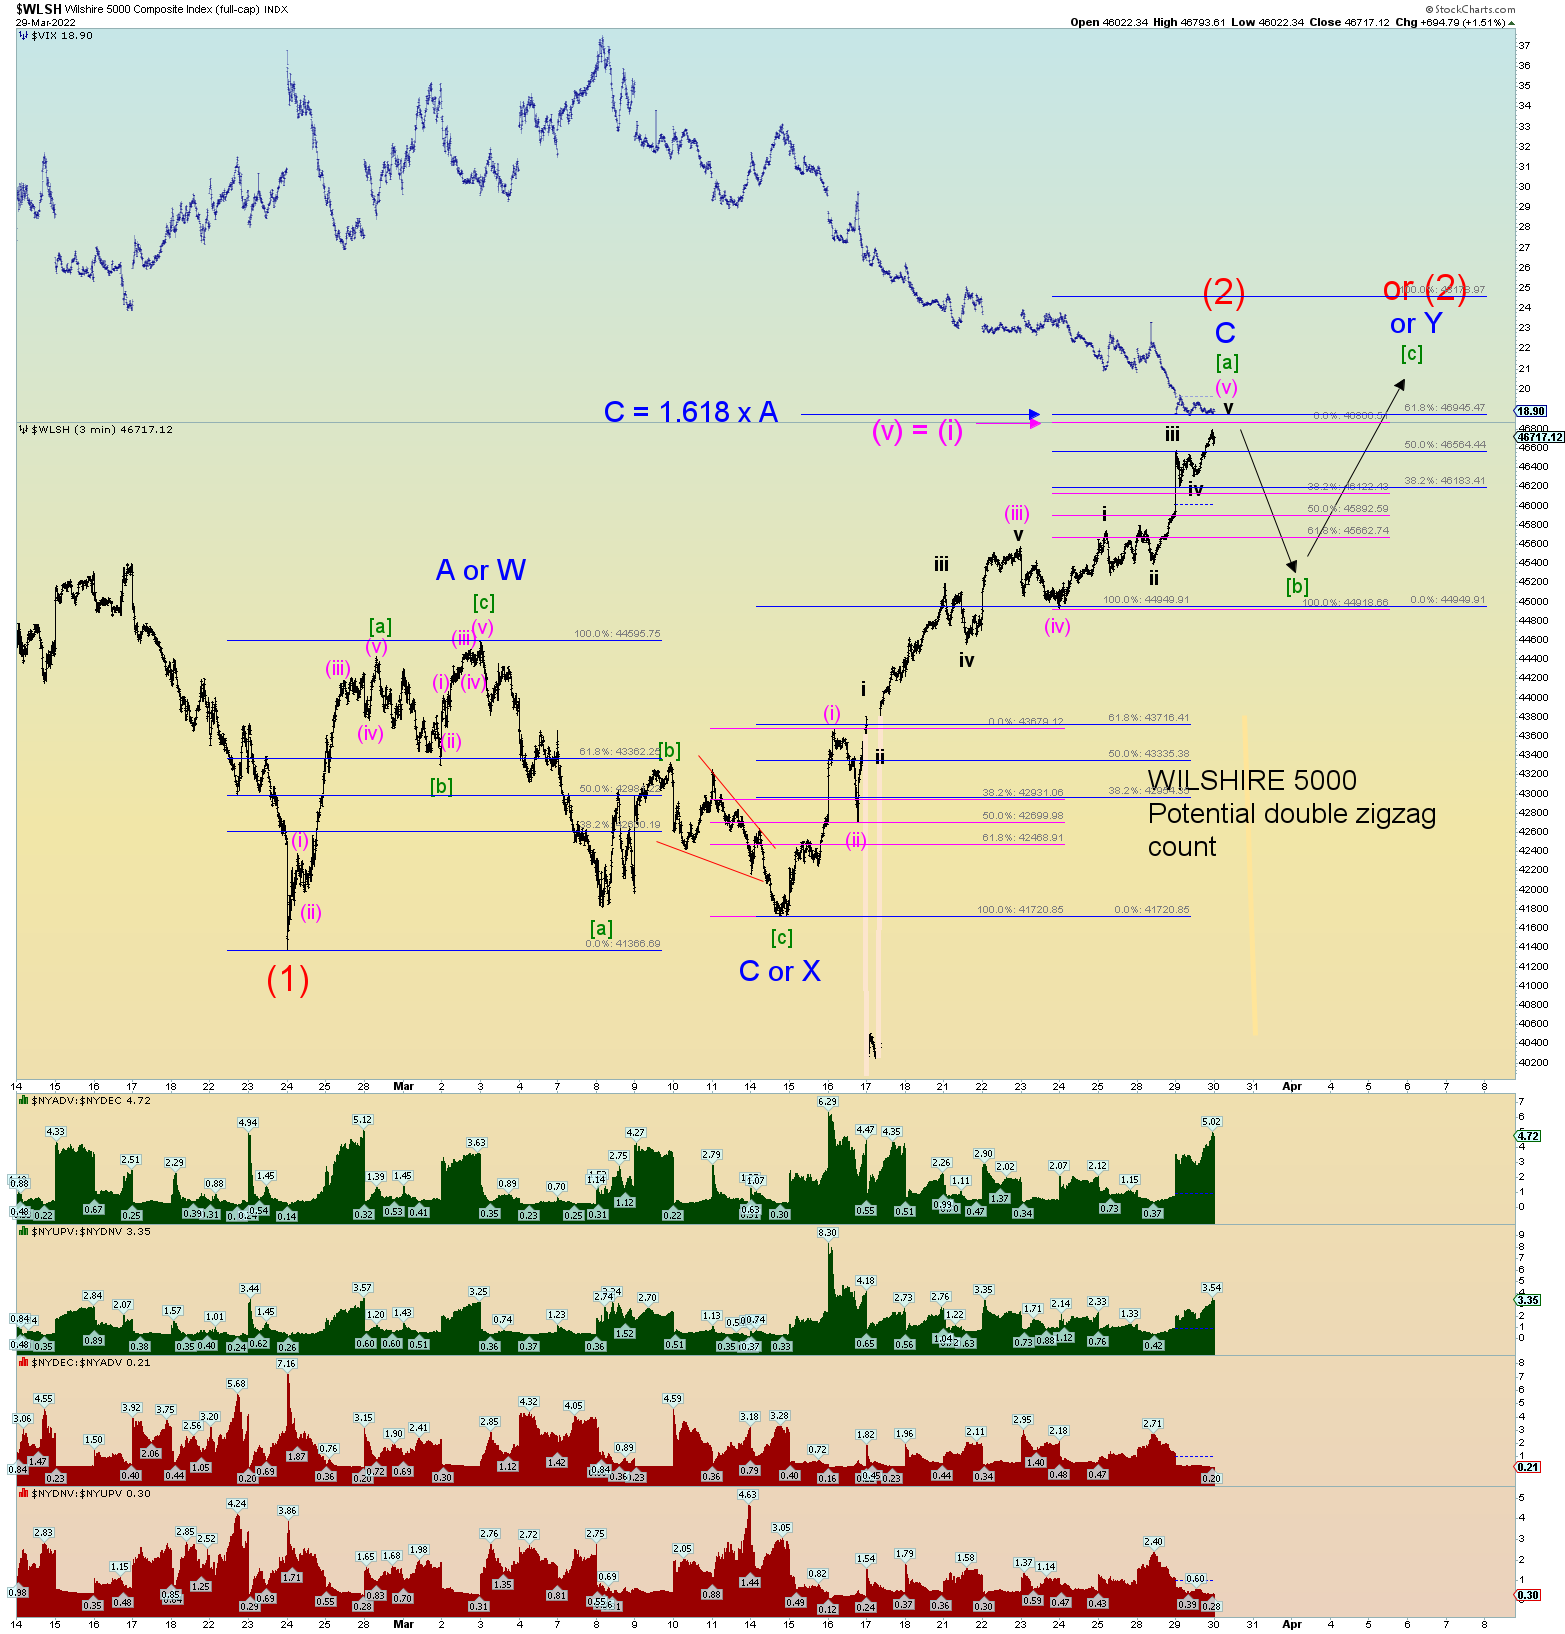
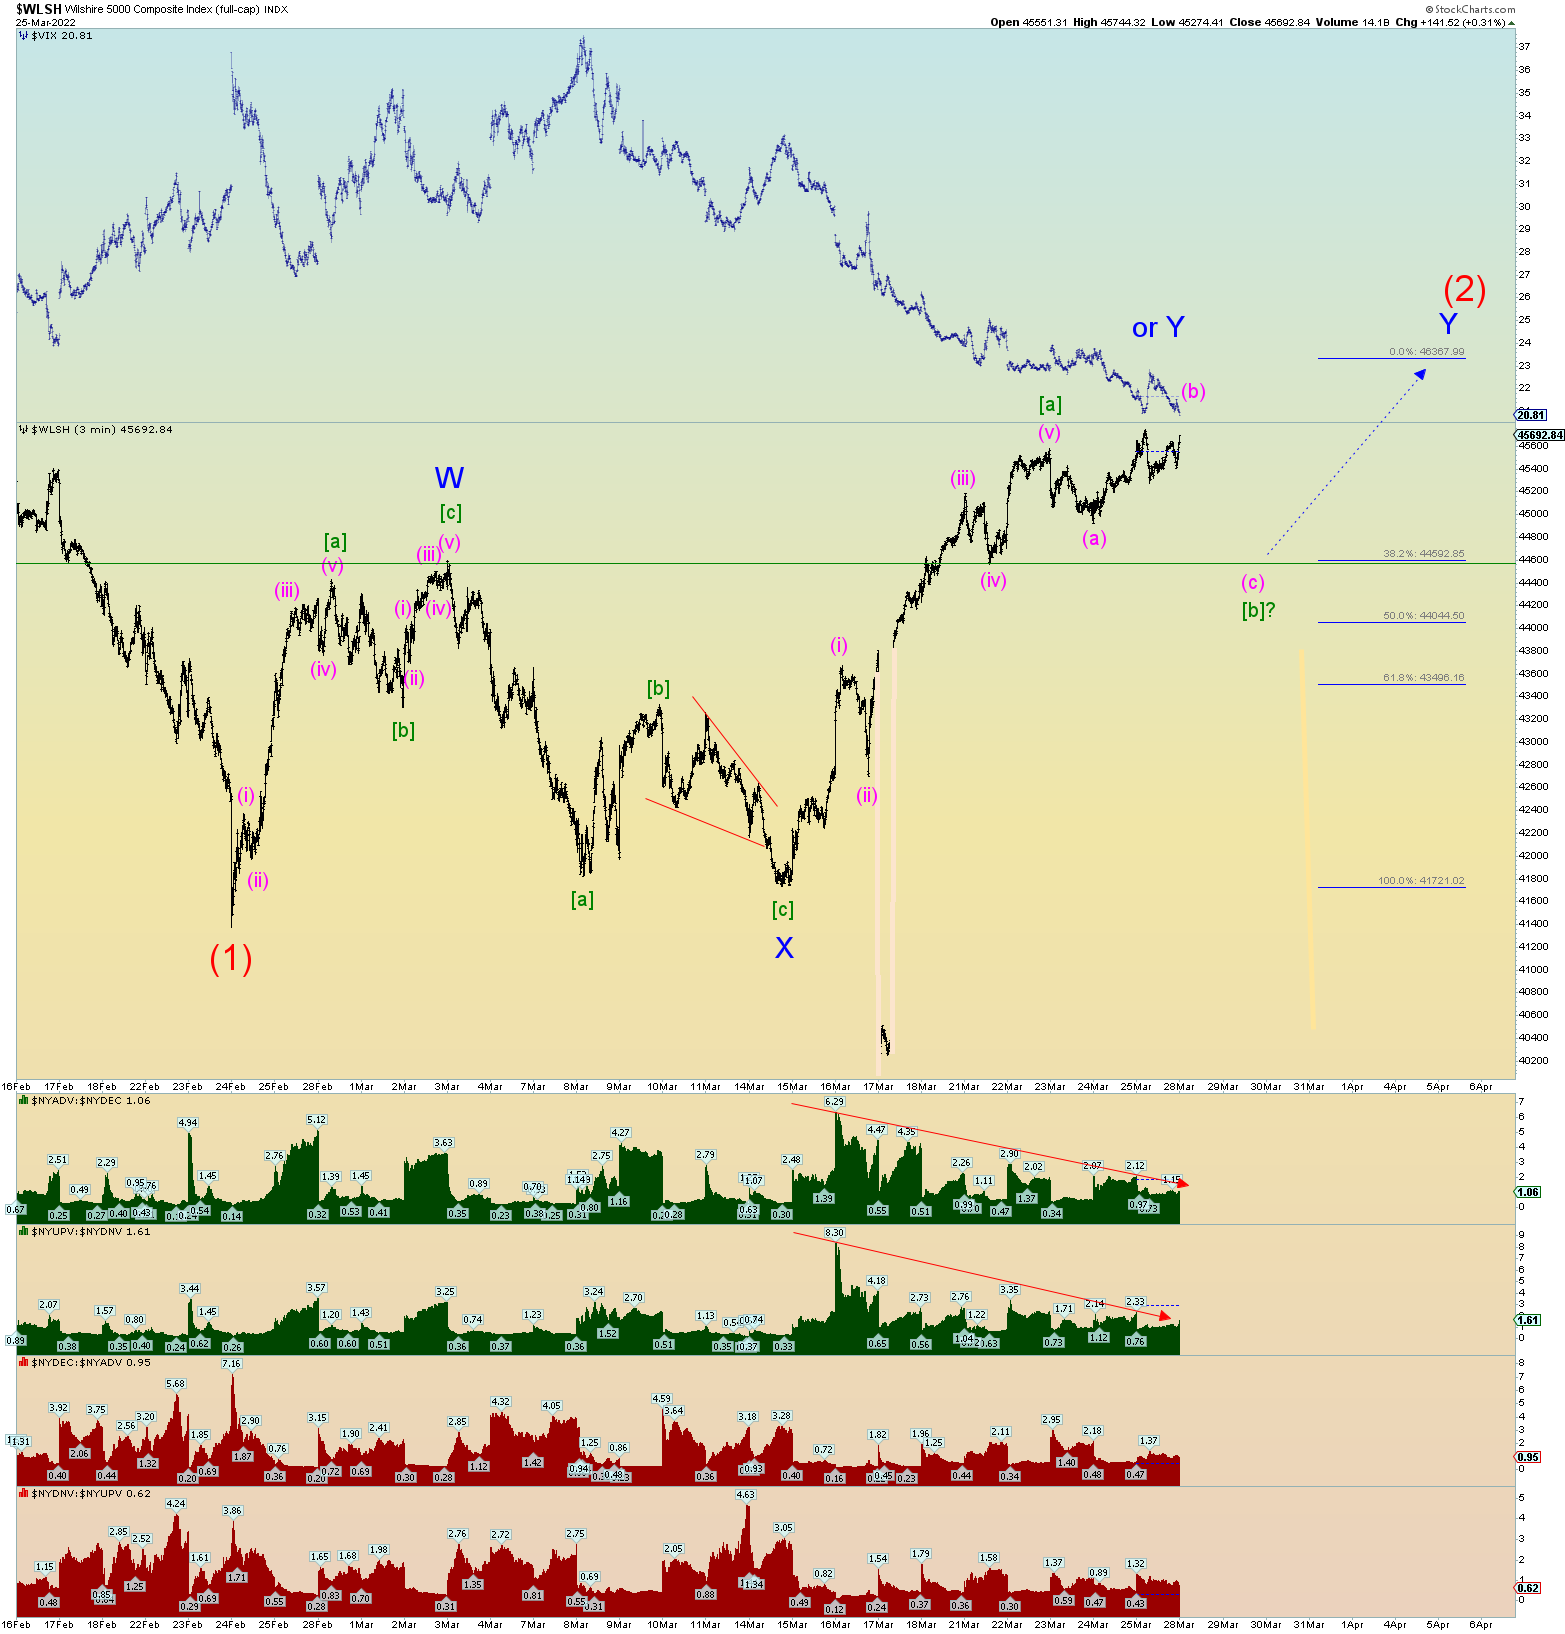
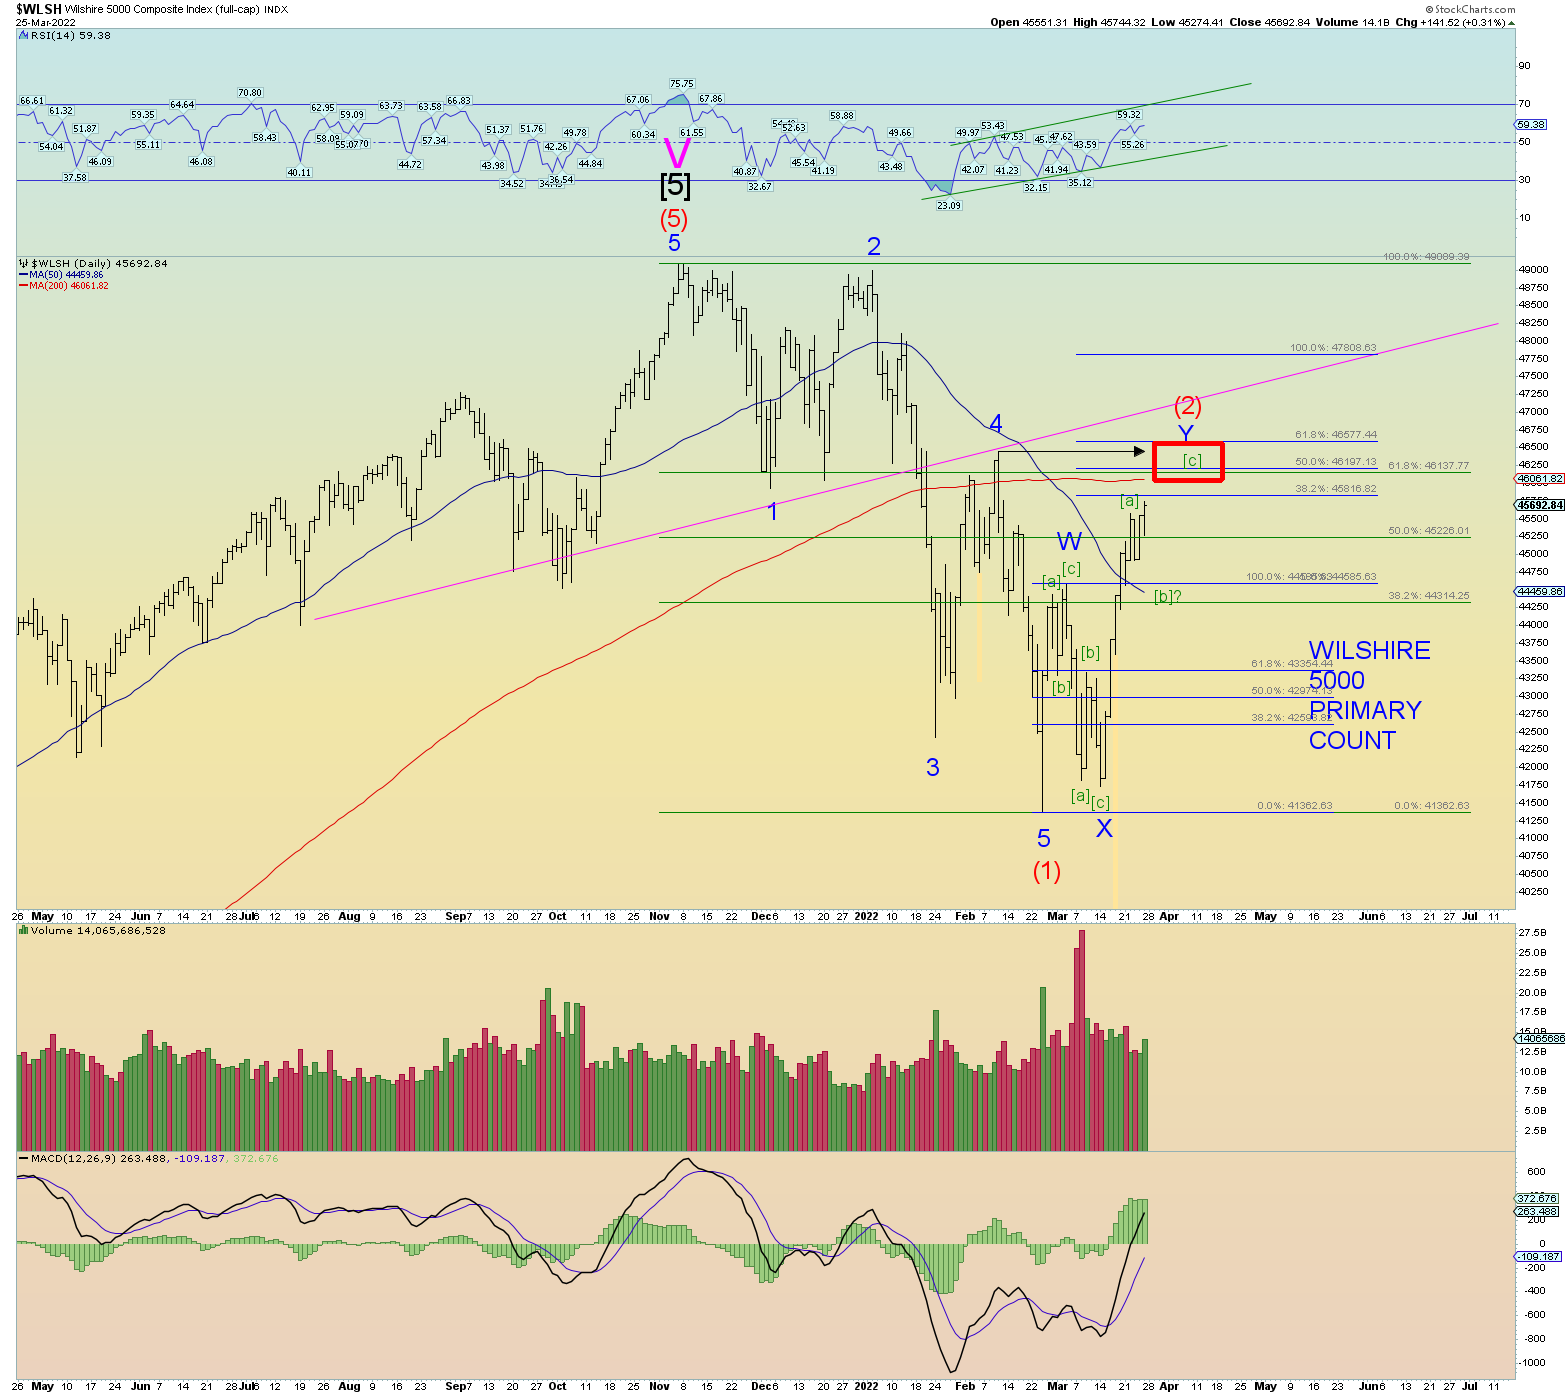
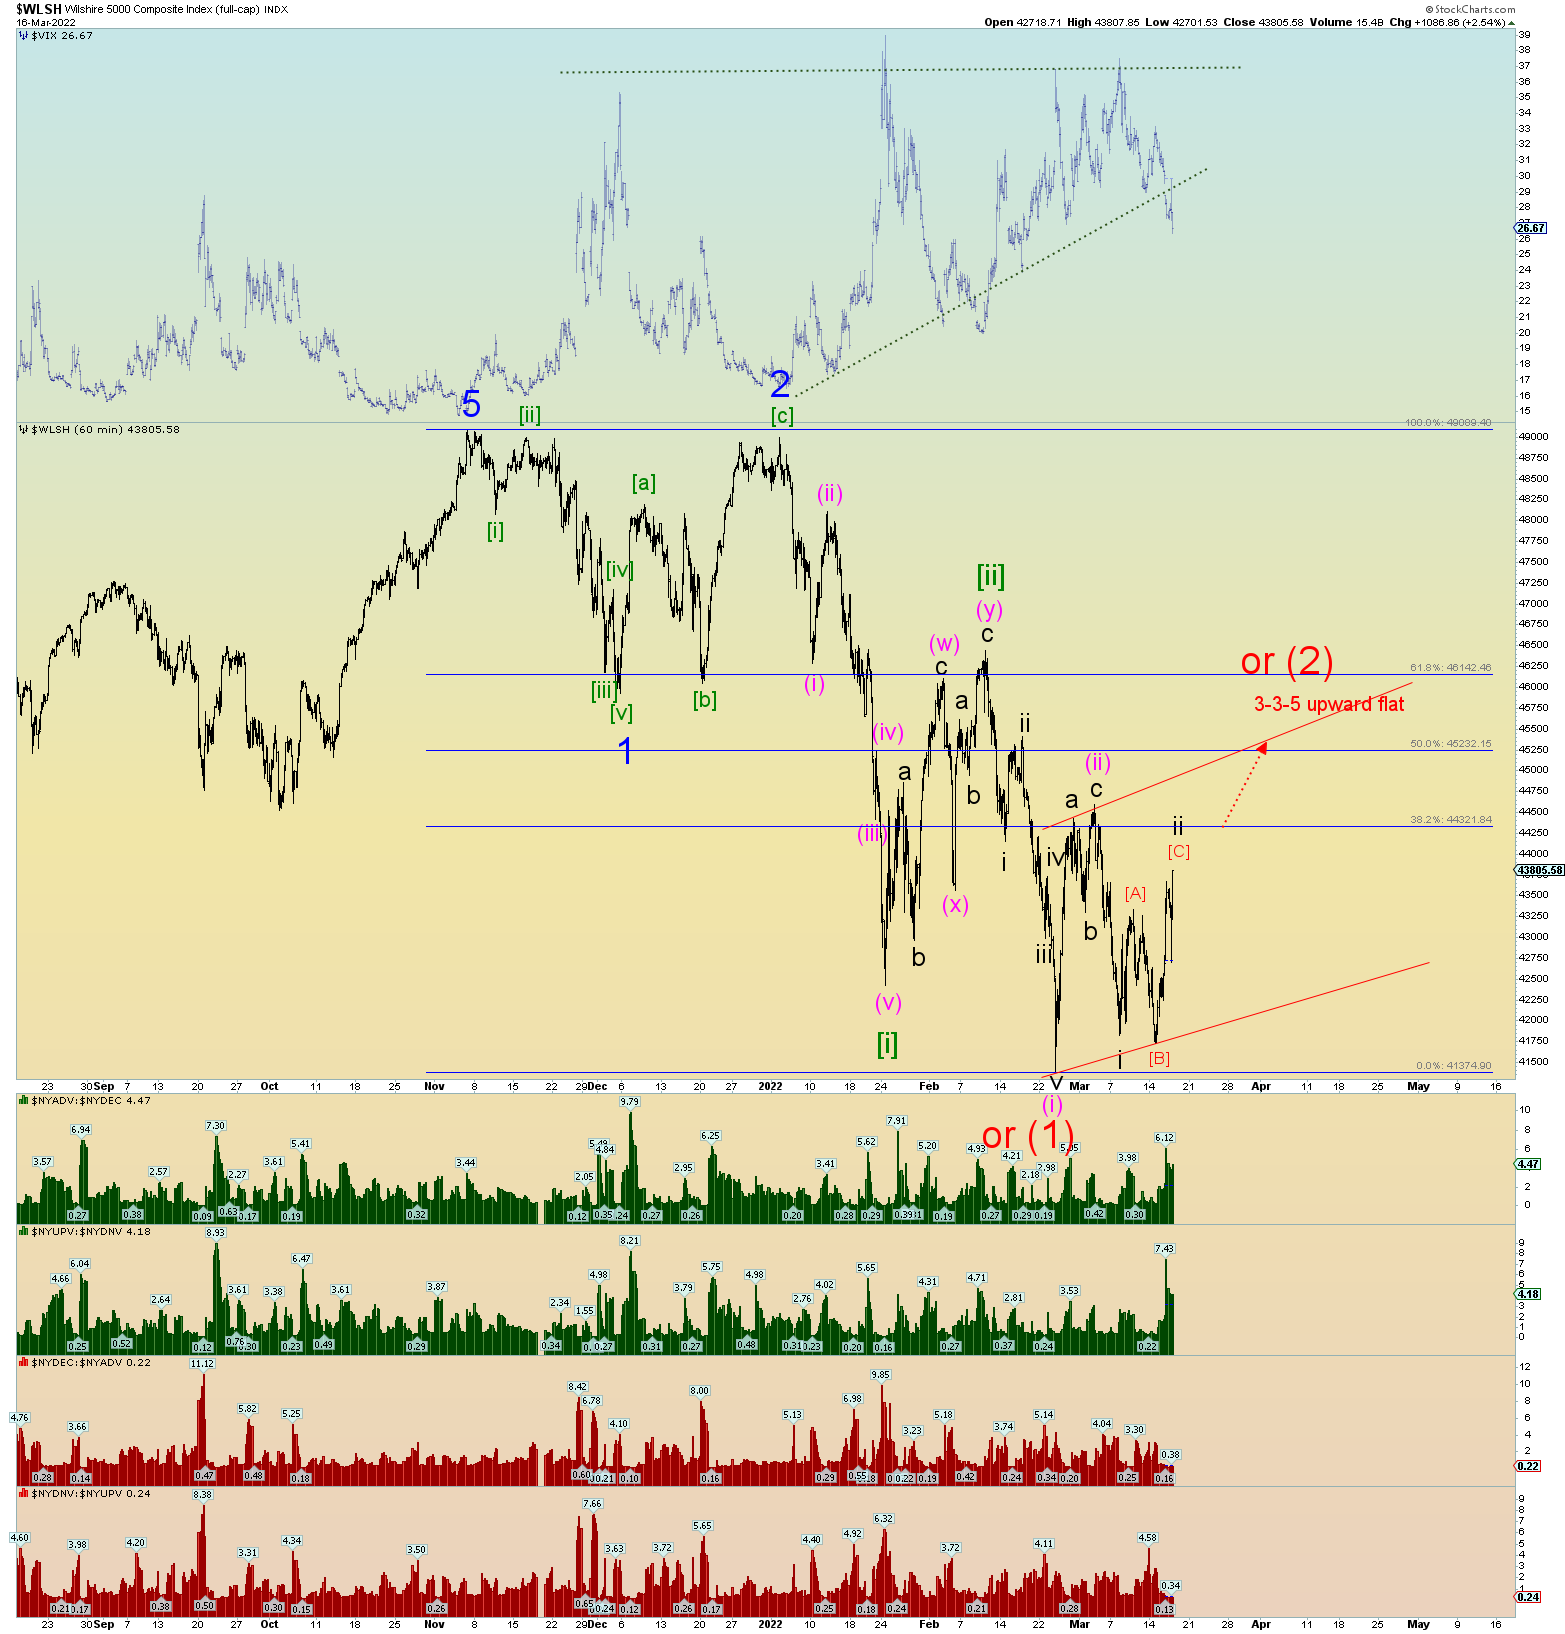
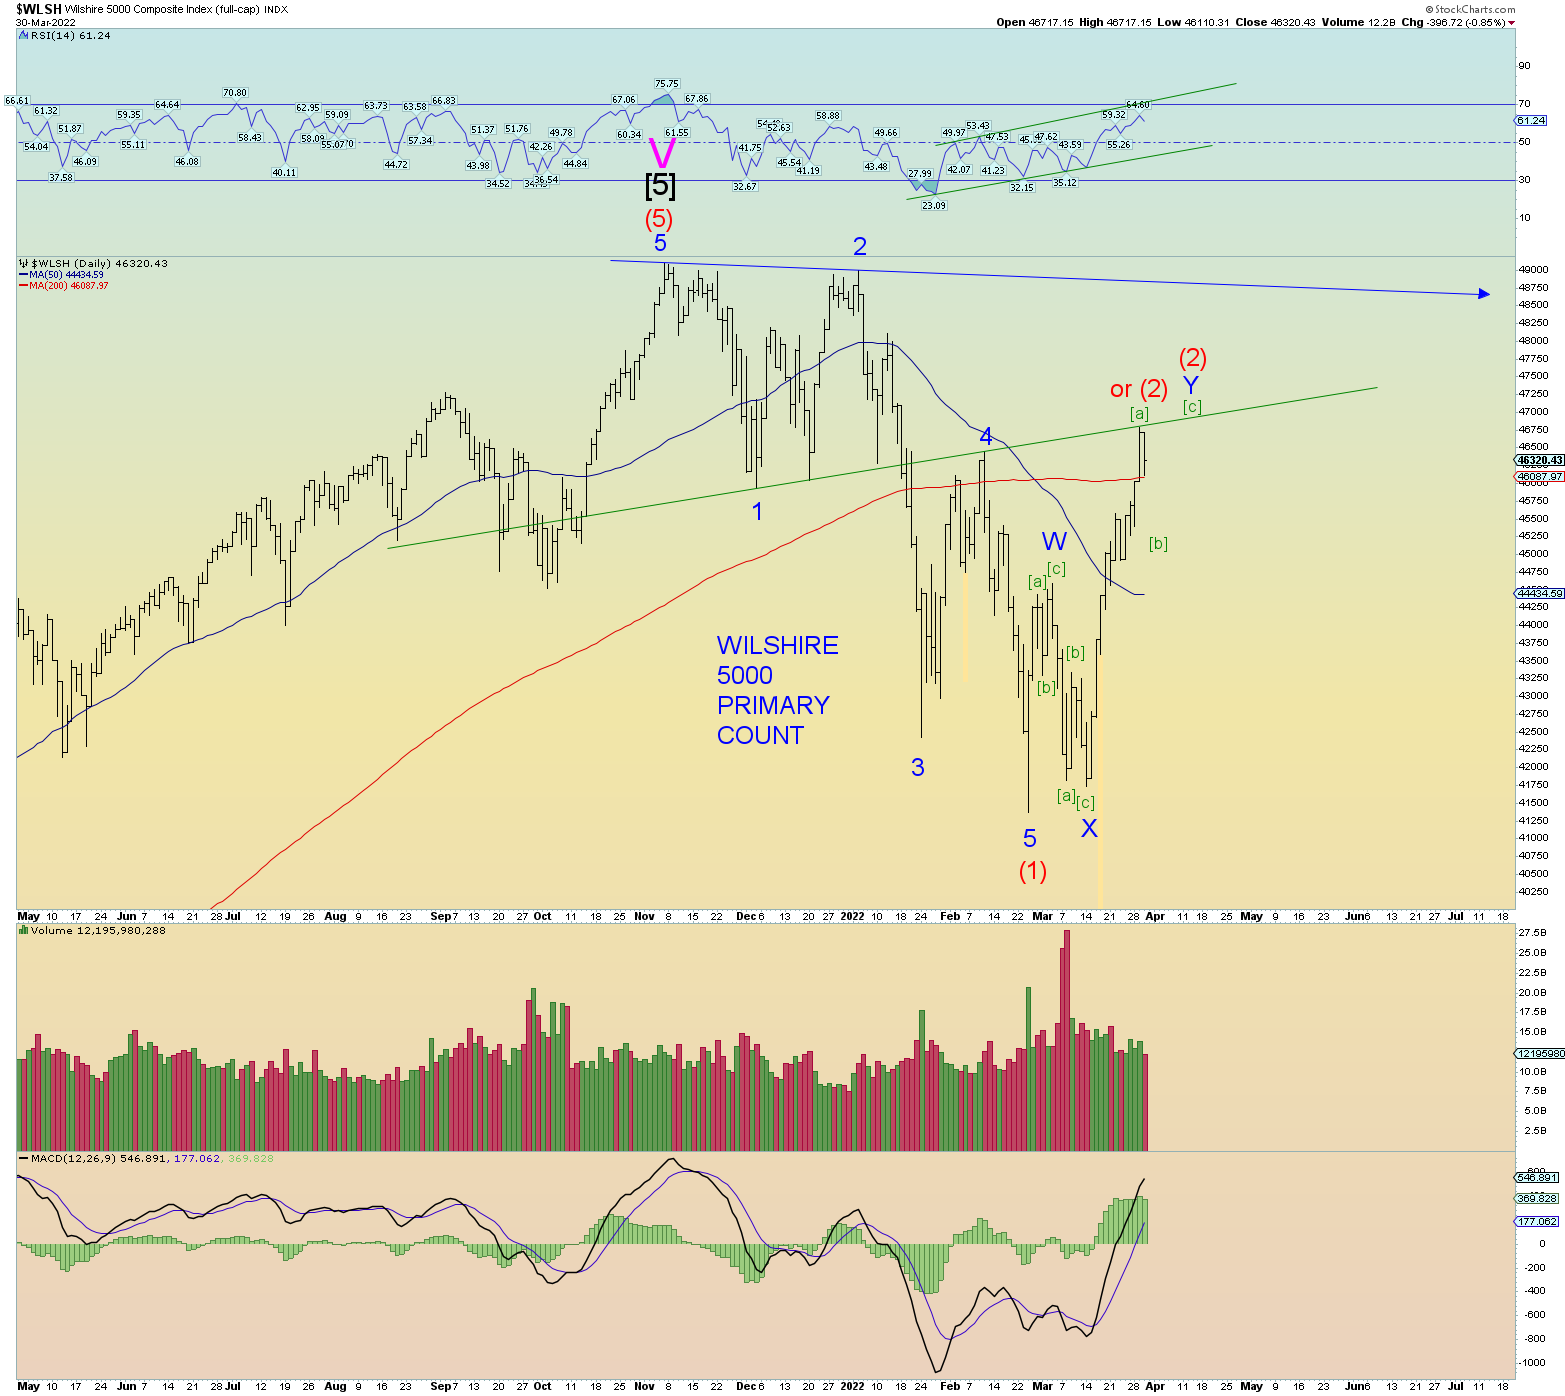
A potential squiggle count. Waves [b] and [c] of Y is just shown for form only. Prices could pull back more in [b] and go higher in [c] and/or take more time. We may be nearing a short term top as some significant wave relationships are shown on the chart.

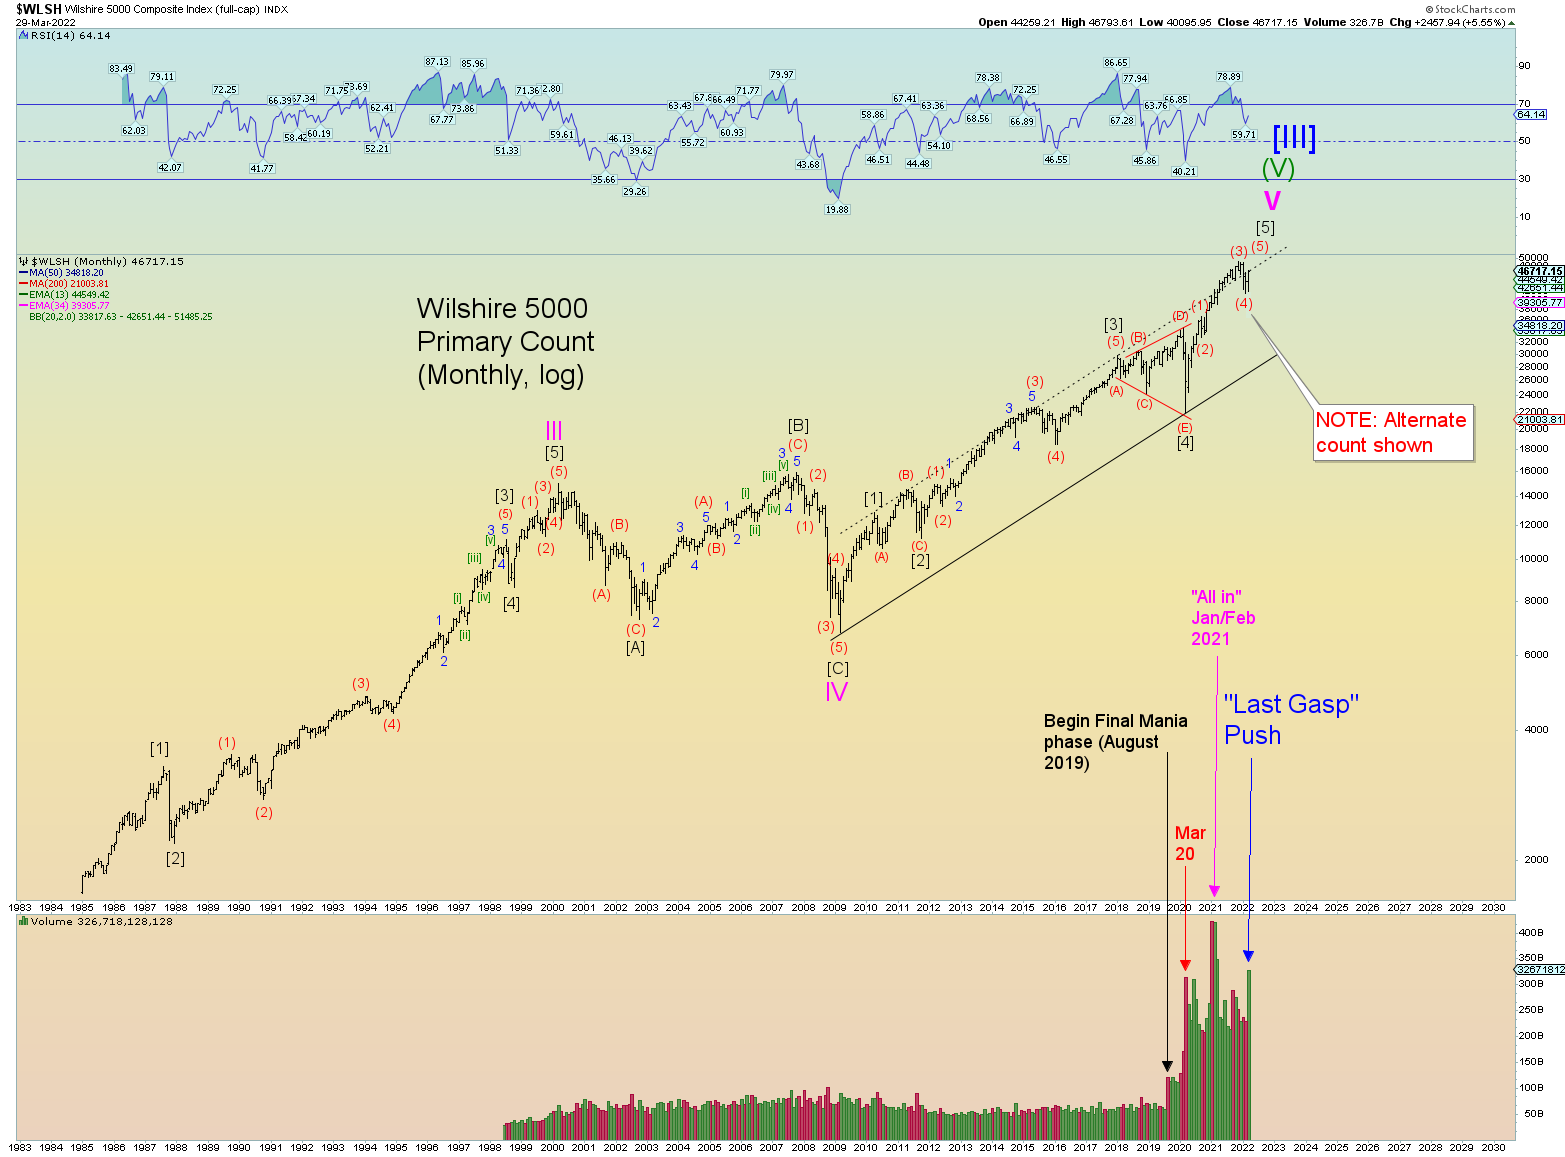
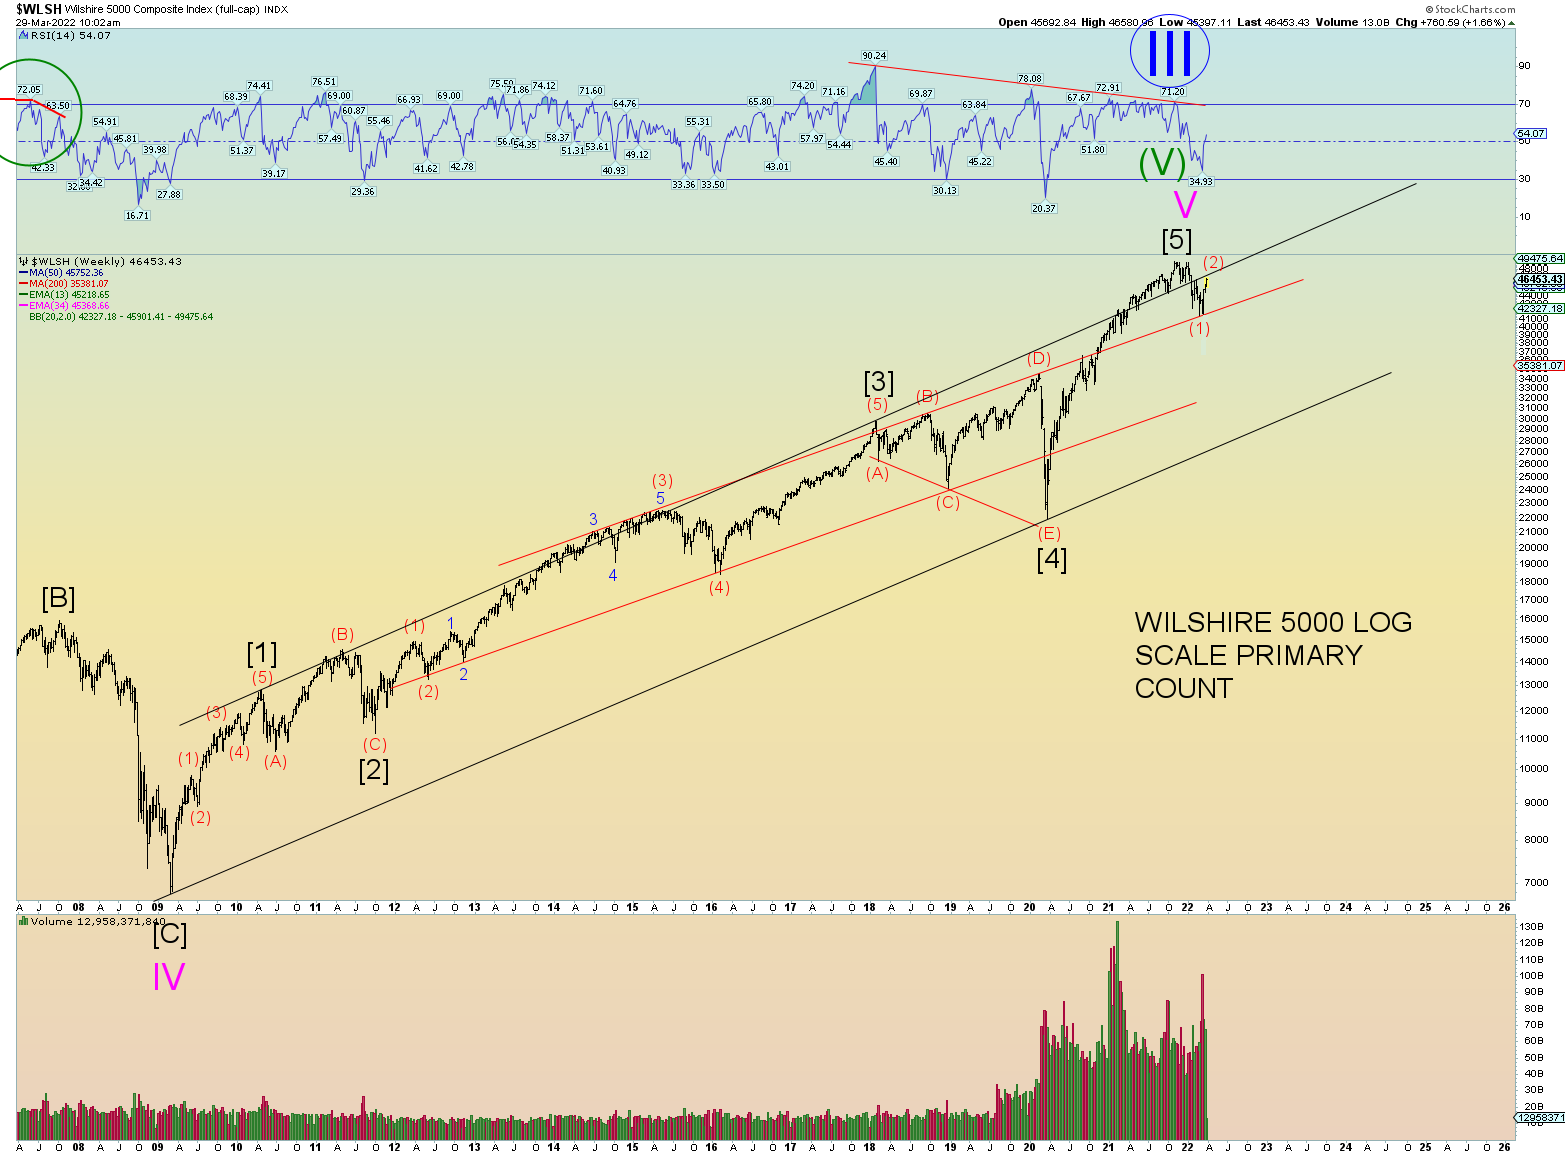
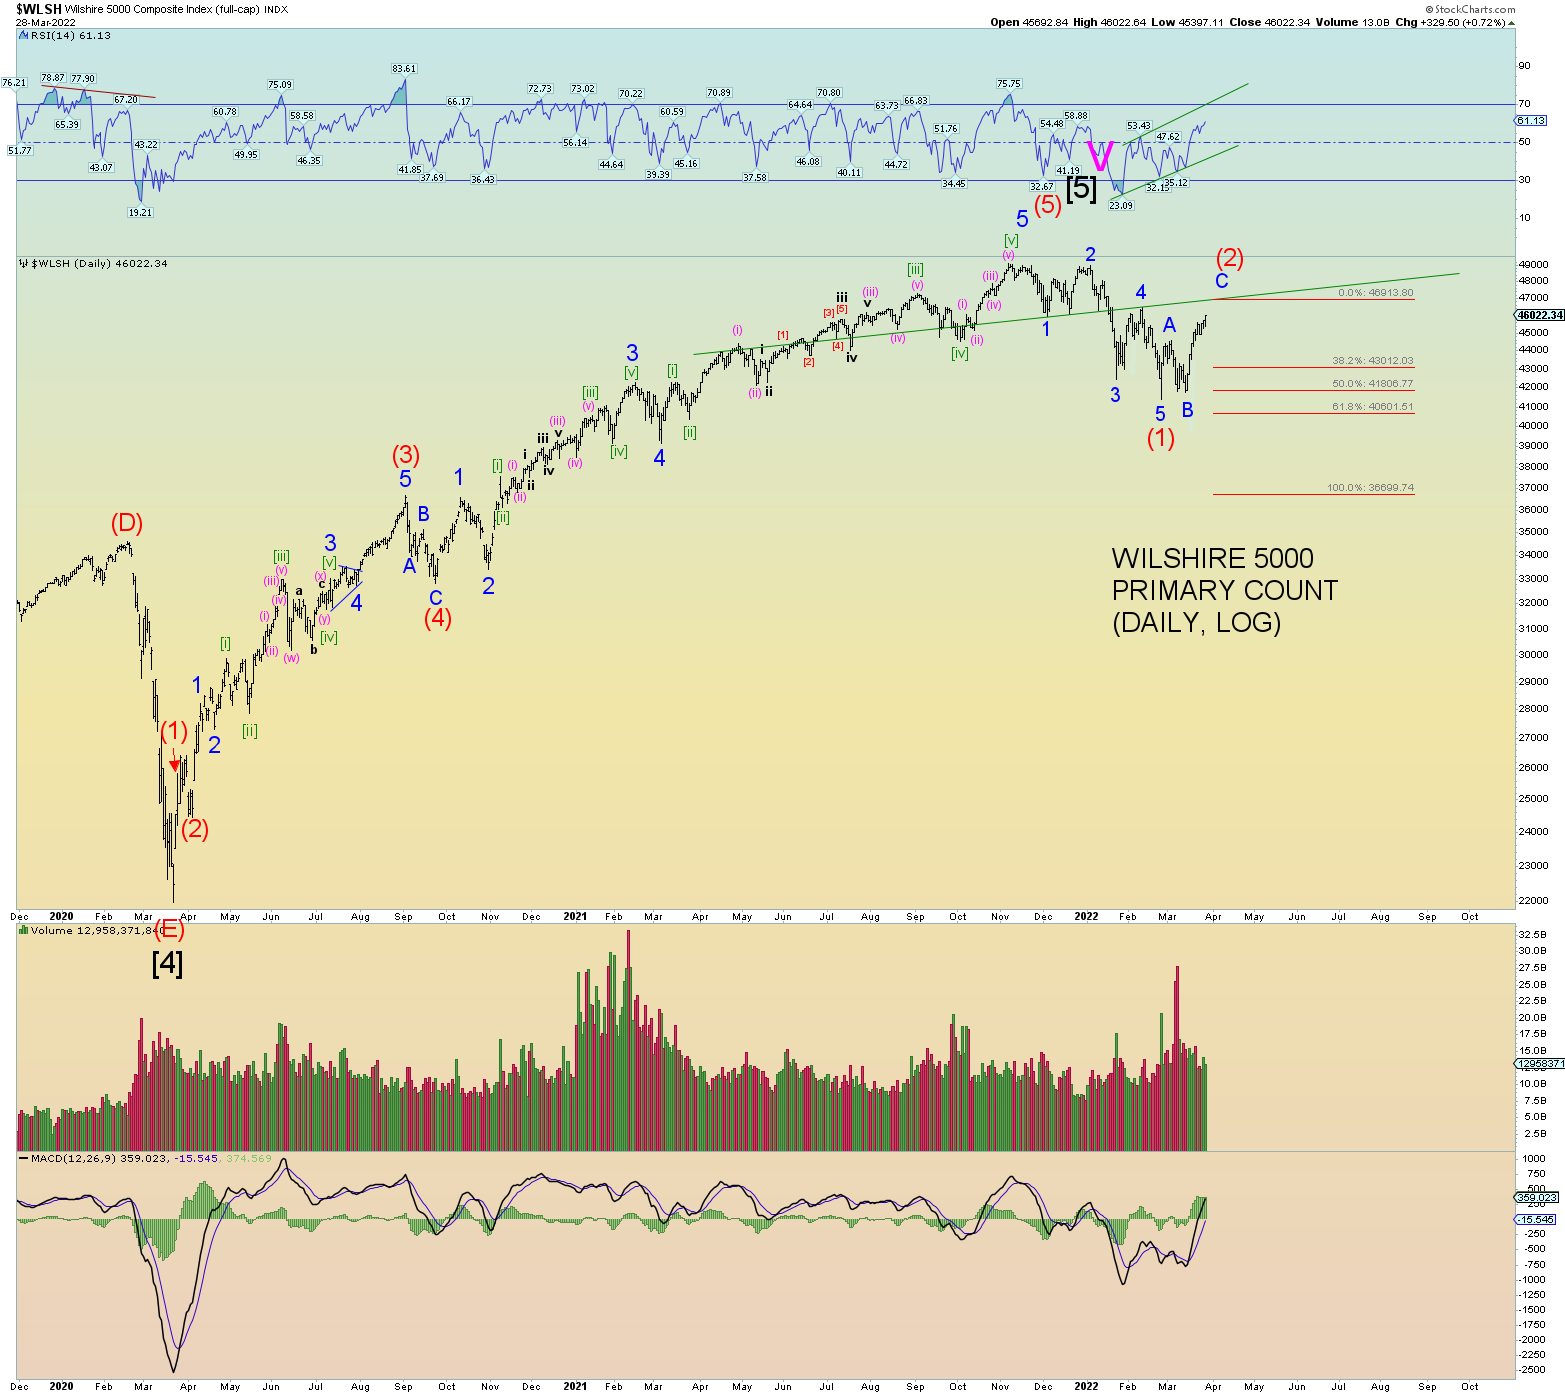
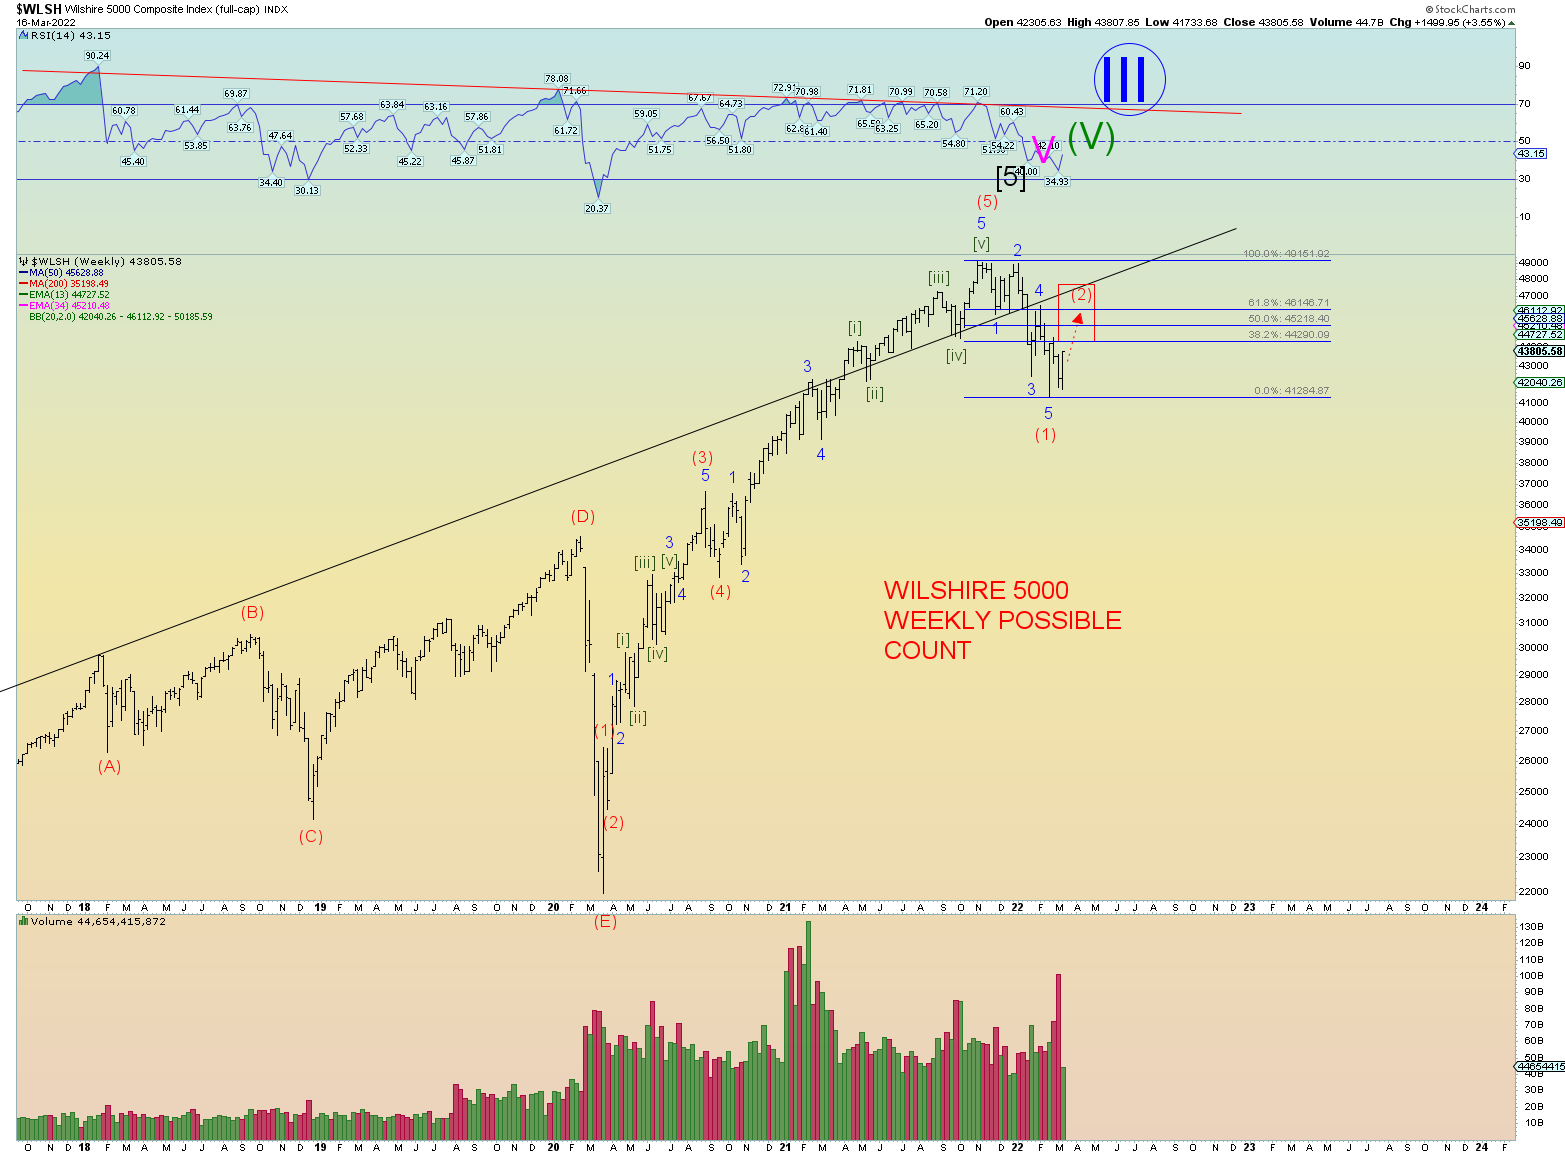
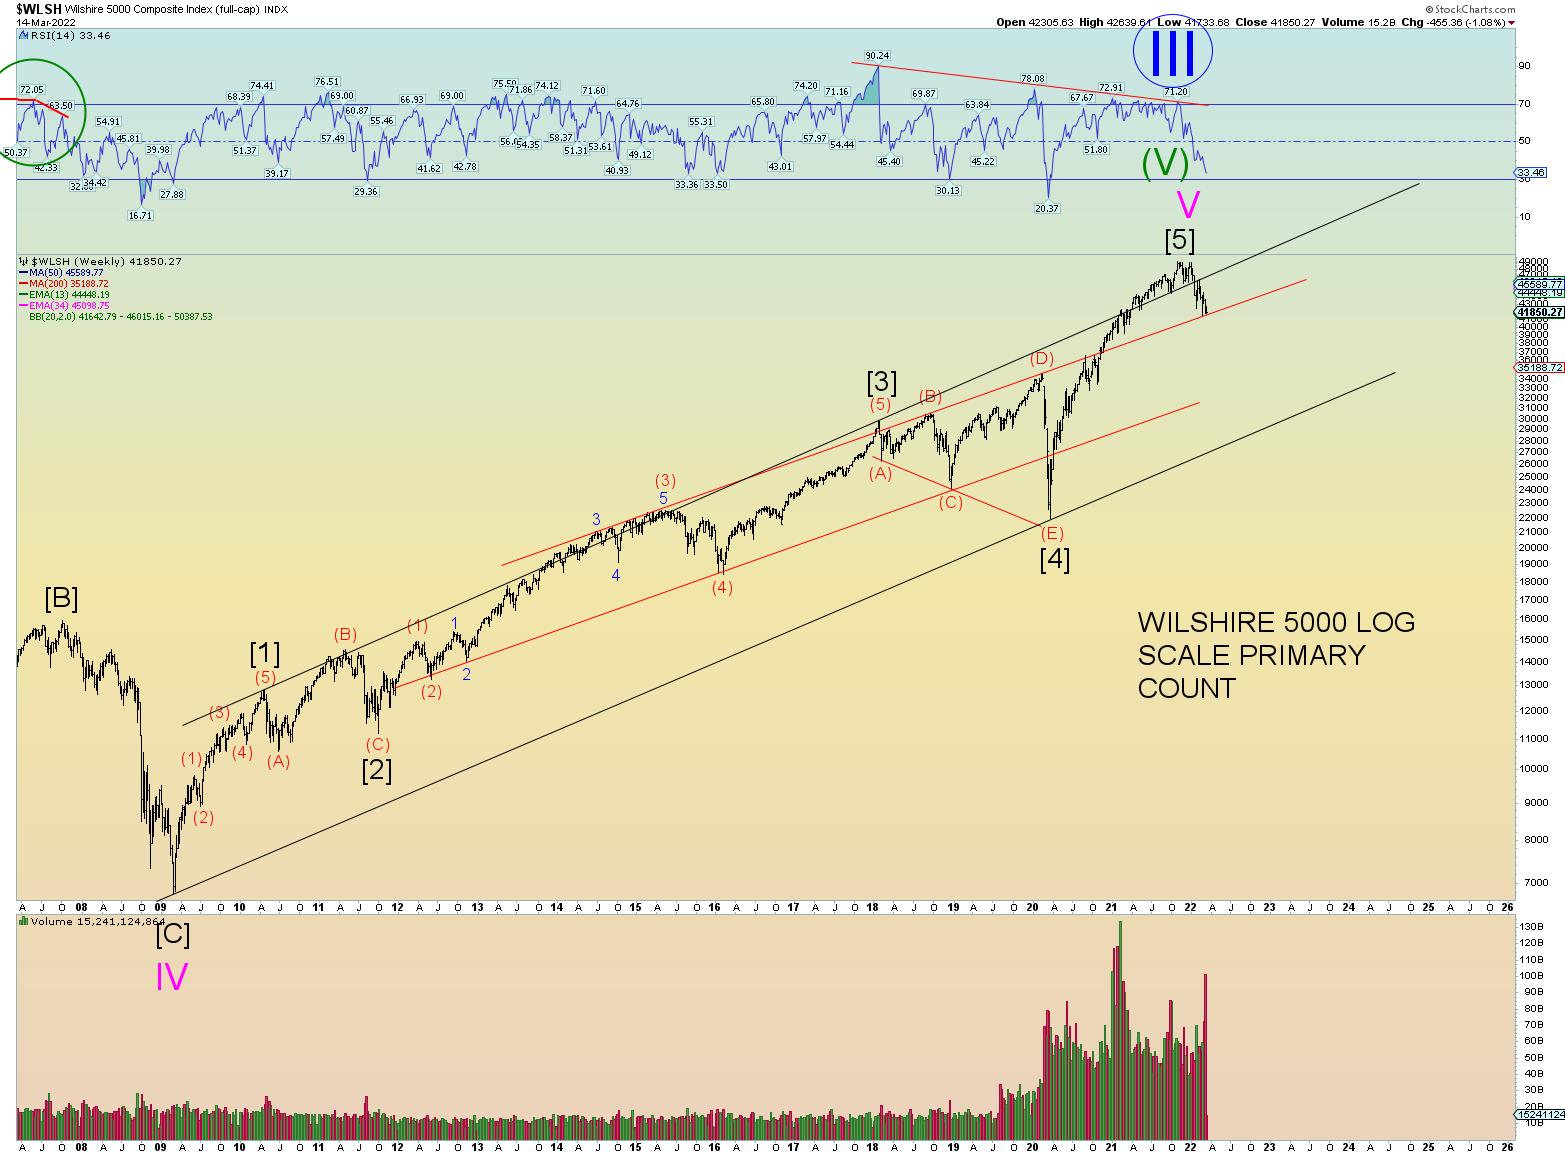
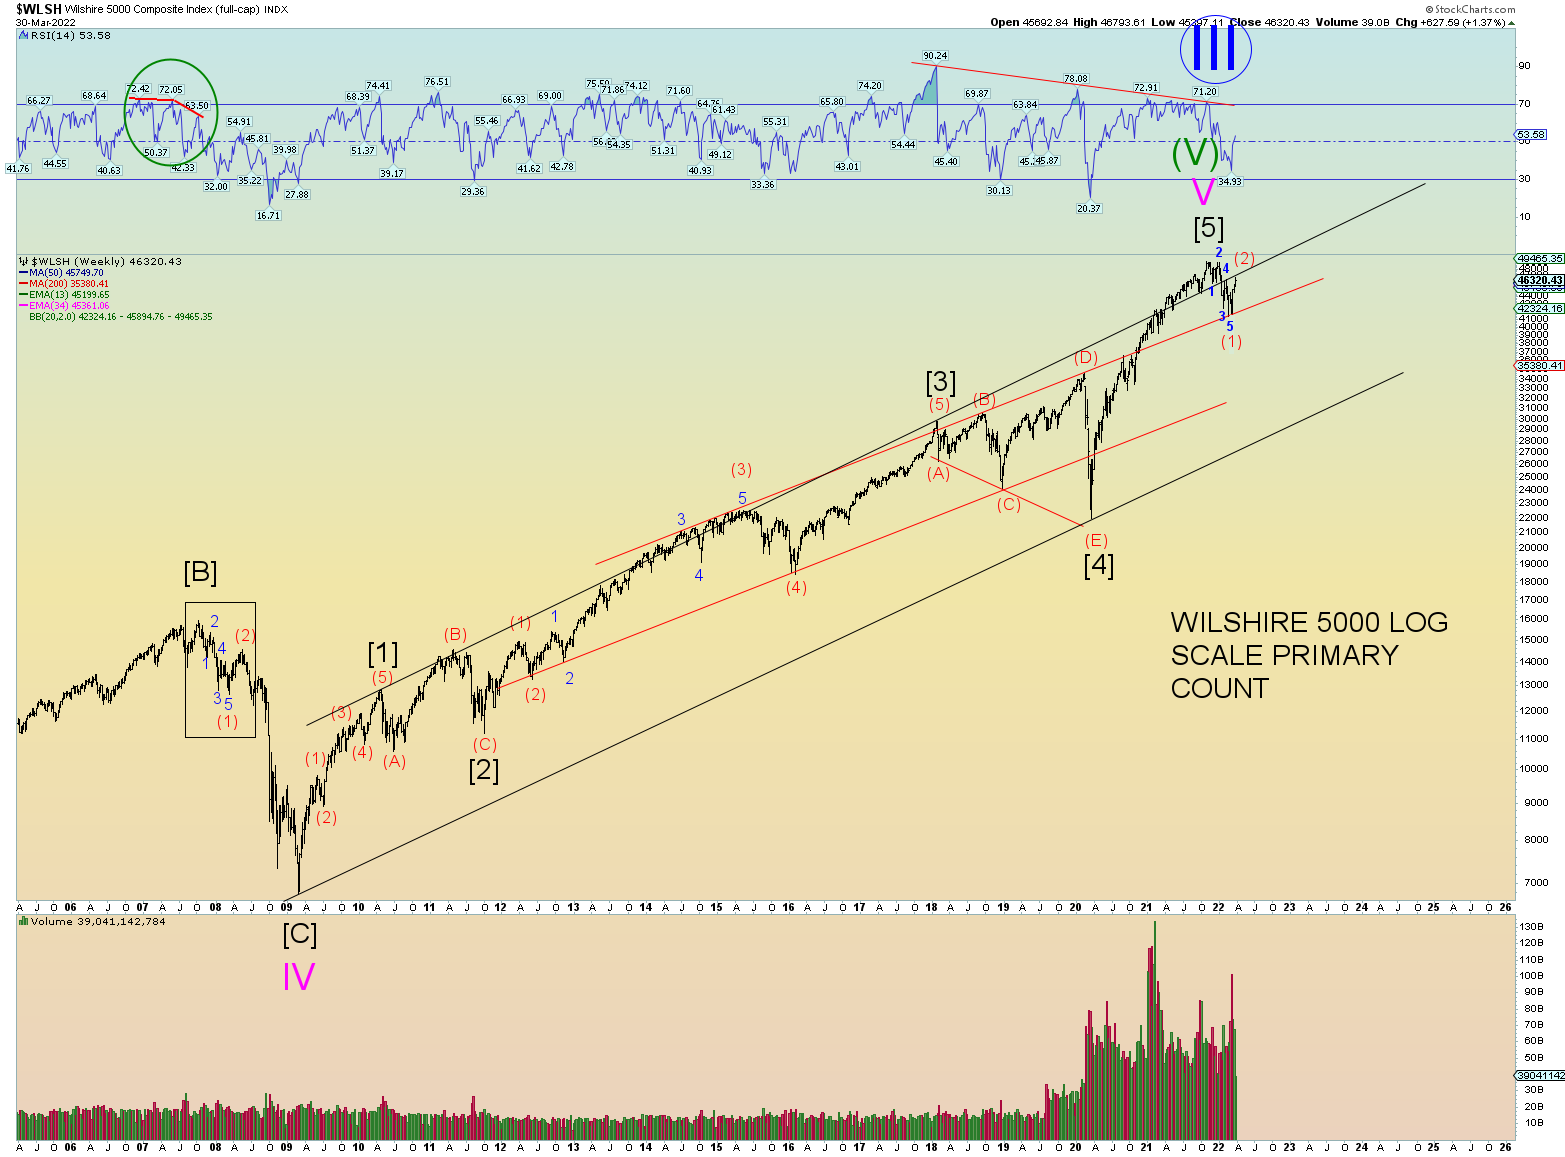
And finally, the longest-term count shown on the monthly. Note how I have put the top long term alternate count on this chart which makes the recent February 24th low wave (4) of [5]. The fact that you can “see” the waves on the monthly gives this count credence.

Note this month’s total volume bar on the Wilshire. There is likely a LOT of churn going on underneath as the uber-elite rich is using this opportunity to sell into it. Their are still 2 trading days of volume to go including end of quarter Thursday. Volume spikes such as these are worth paying attention to. In this case it appears to be a final push to either a new short term all-time high or very close.

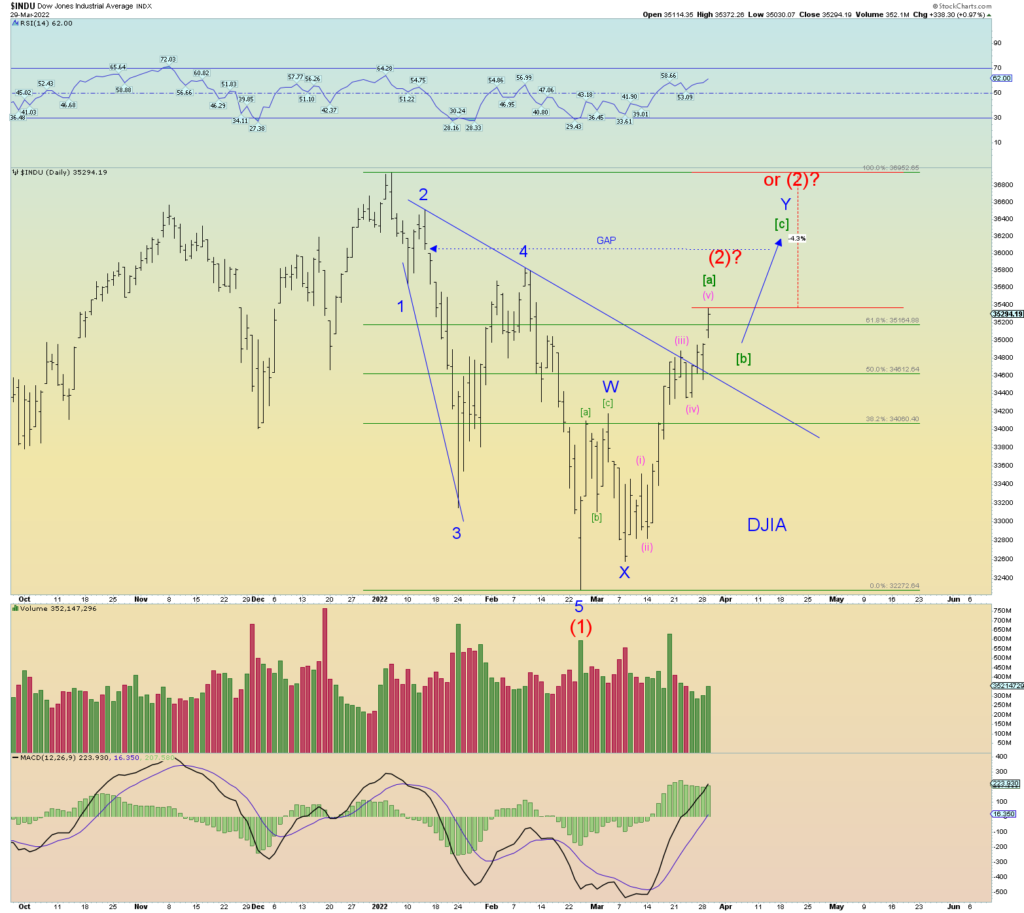
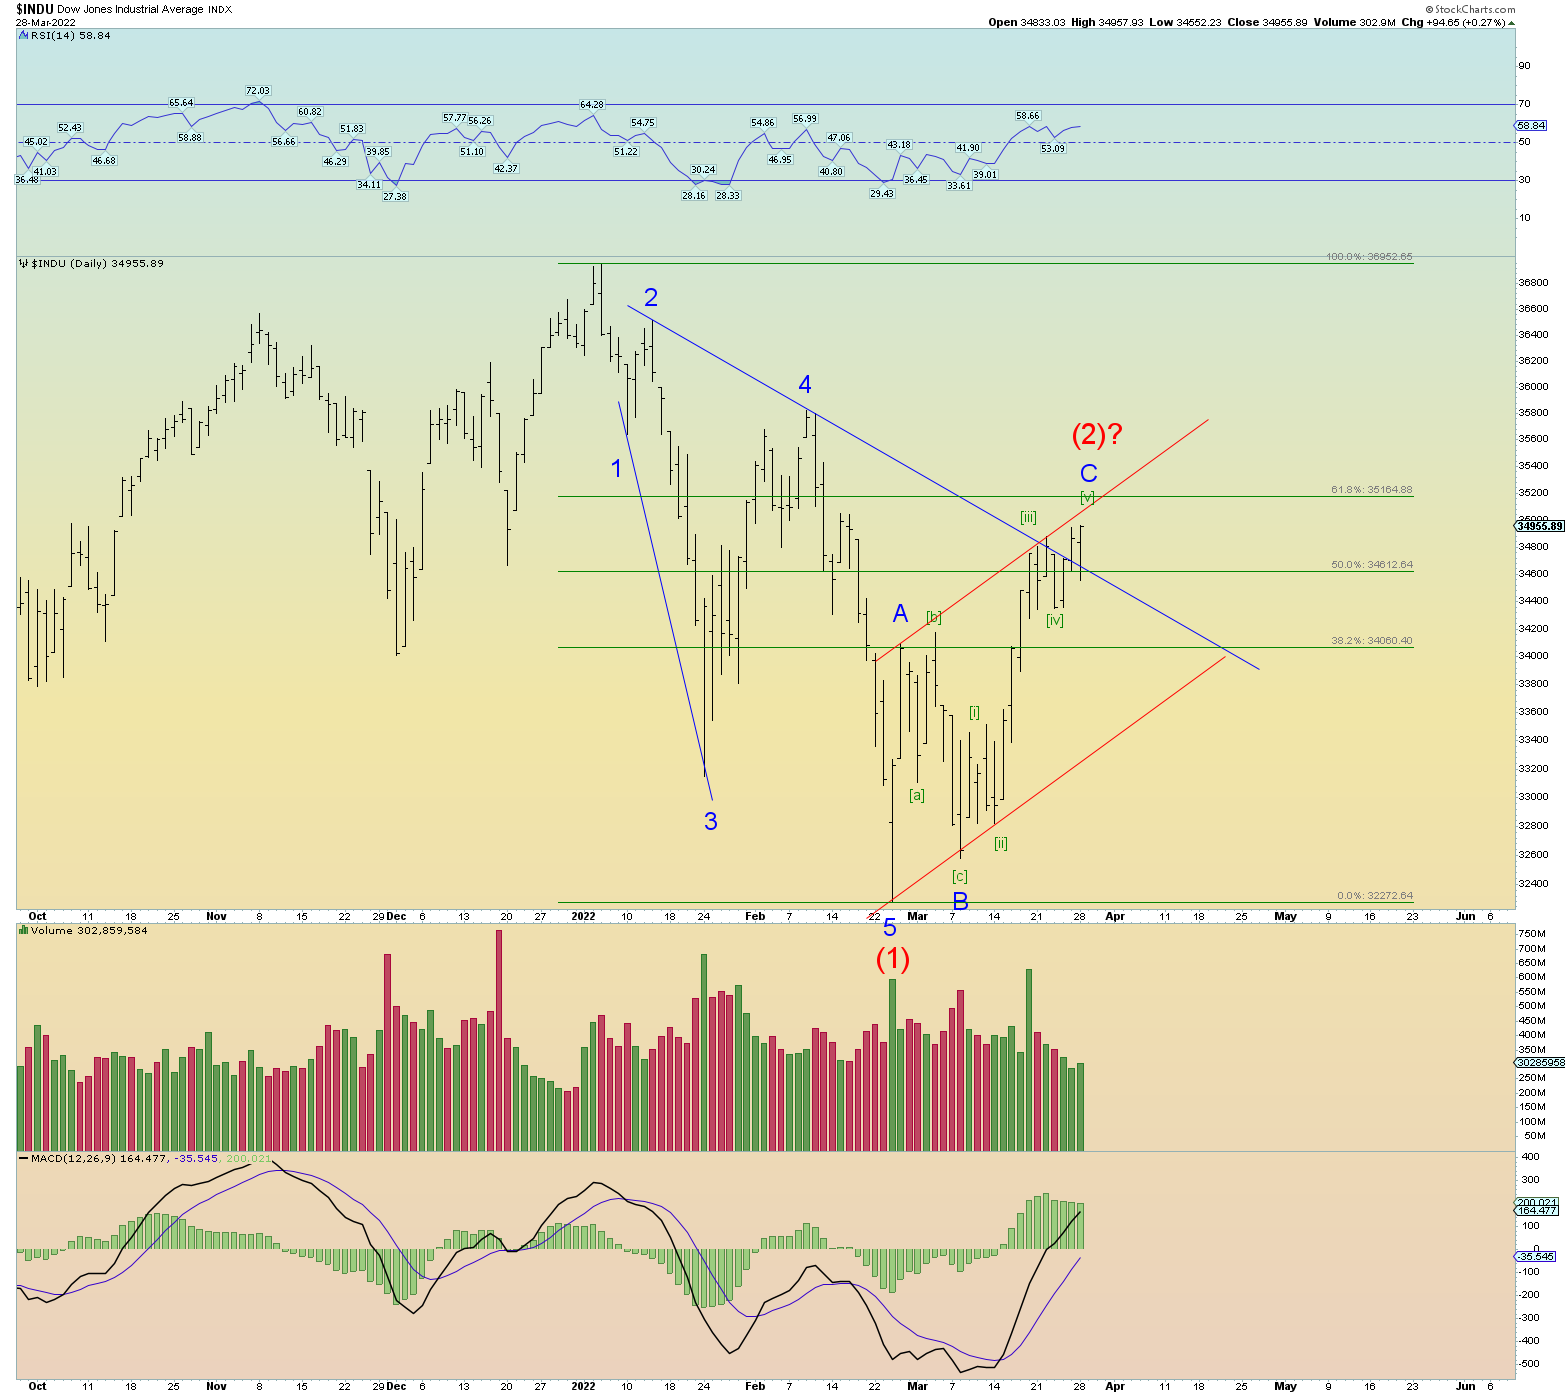
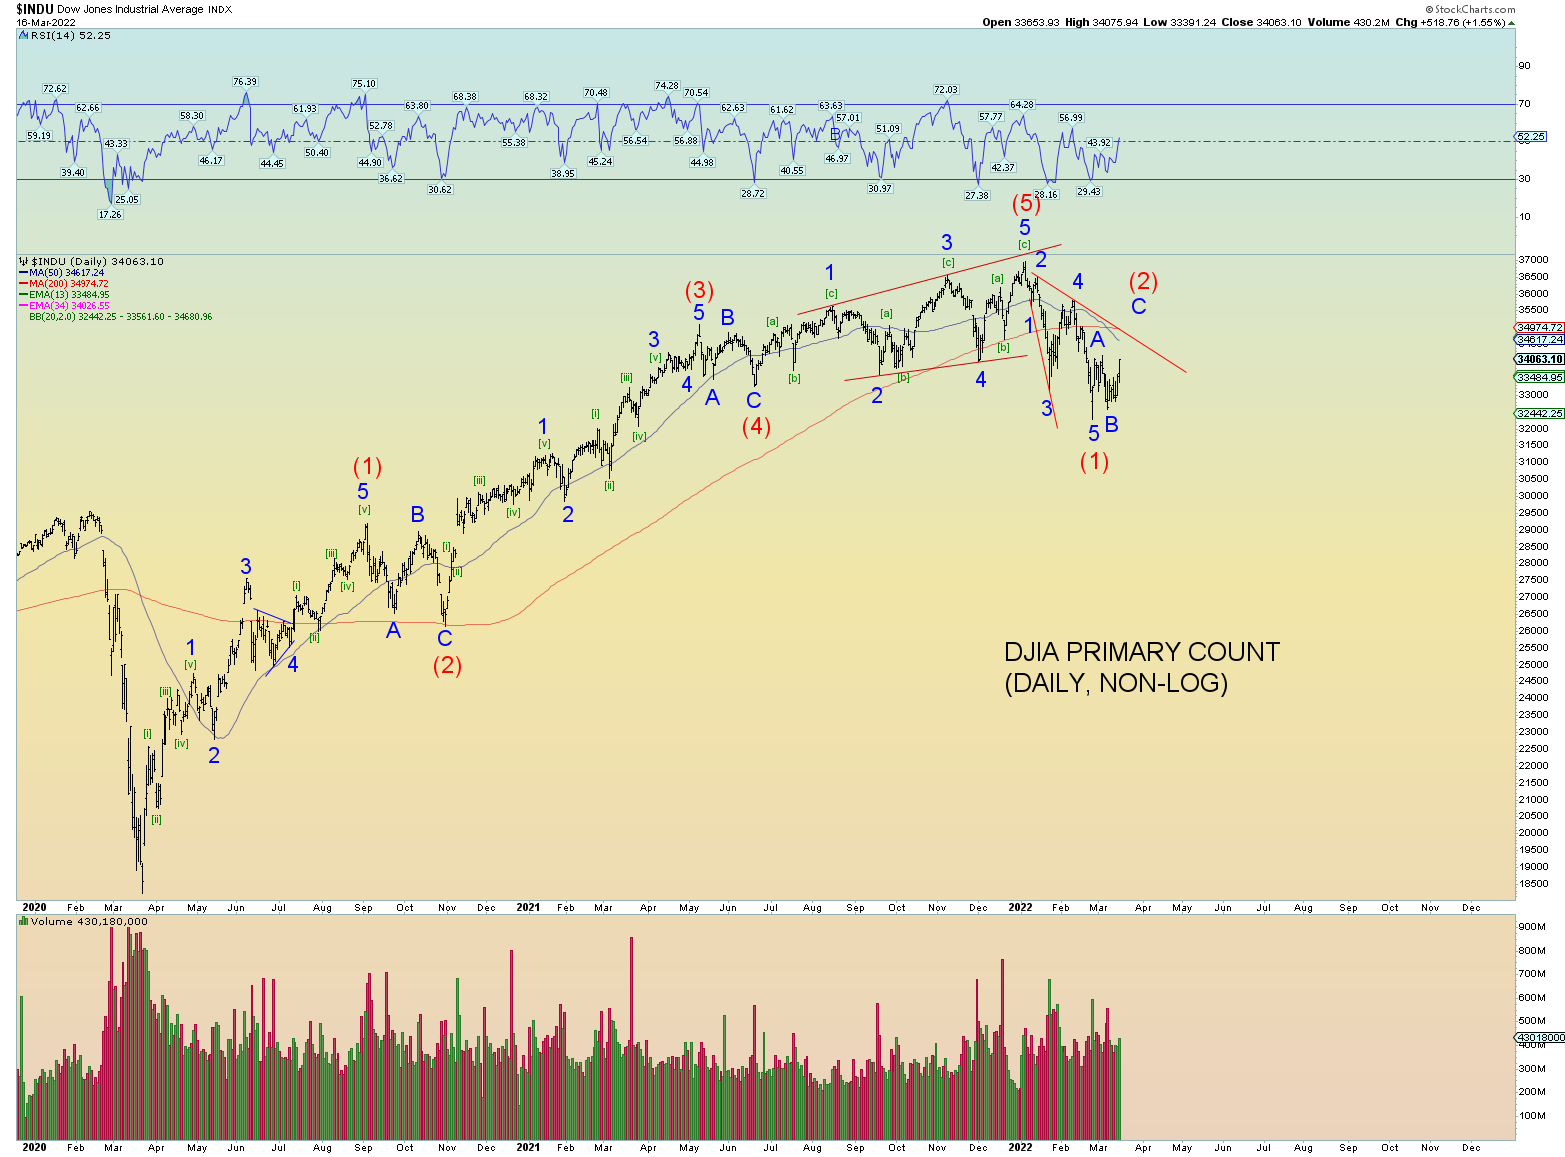
The DJIA. Same pattern as the SPX but not quite as close to its January high. I show the bear count, but if the DOW makes a new all-time high, wave (1) down would be labeled wave (4) of course just like on the NYSE and the alt count shown on the Wilshire monthly above.

The S&P500. Same pattern as the DOW. Note that the DJIA and SPX differ in patterns from the NYSE. It has moved prices into the open gap as was suggested the last few days.

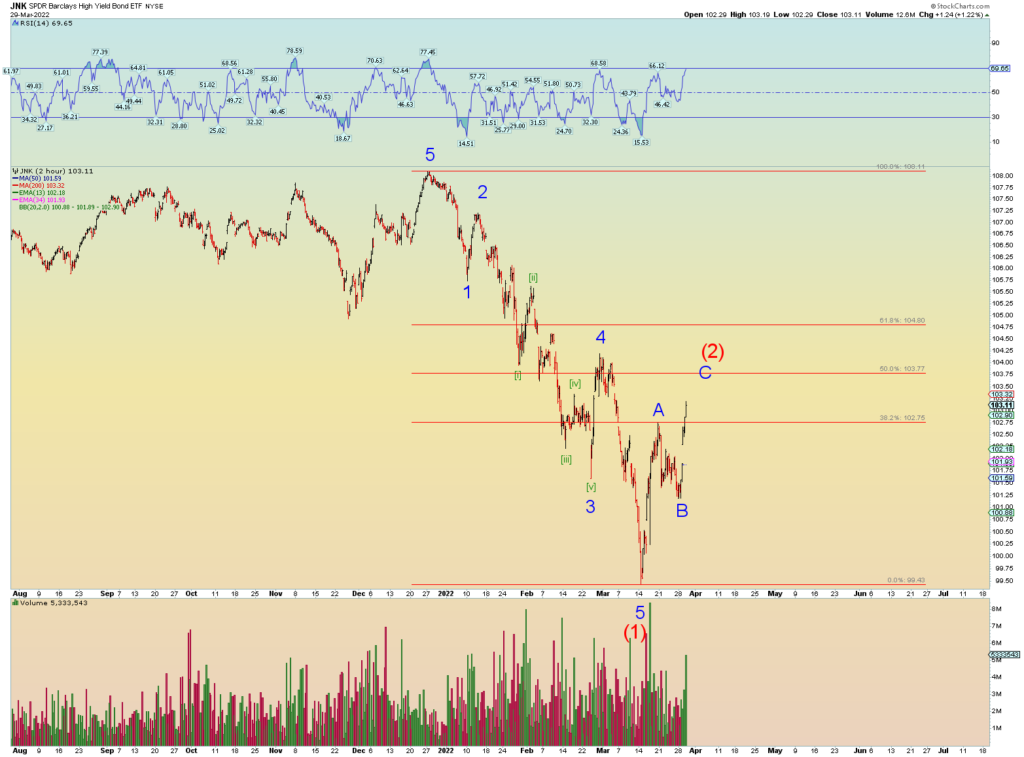
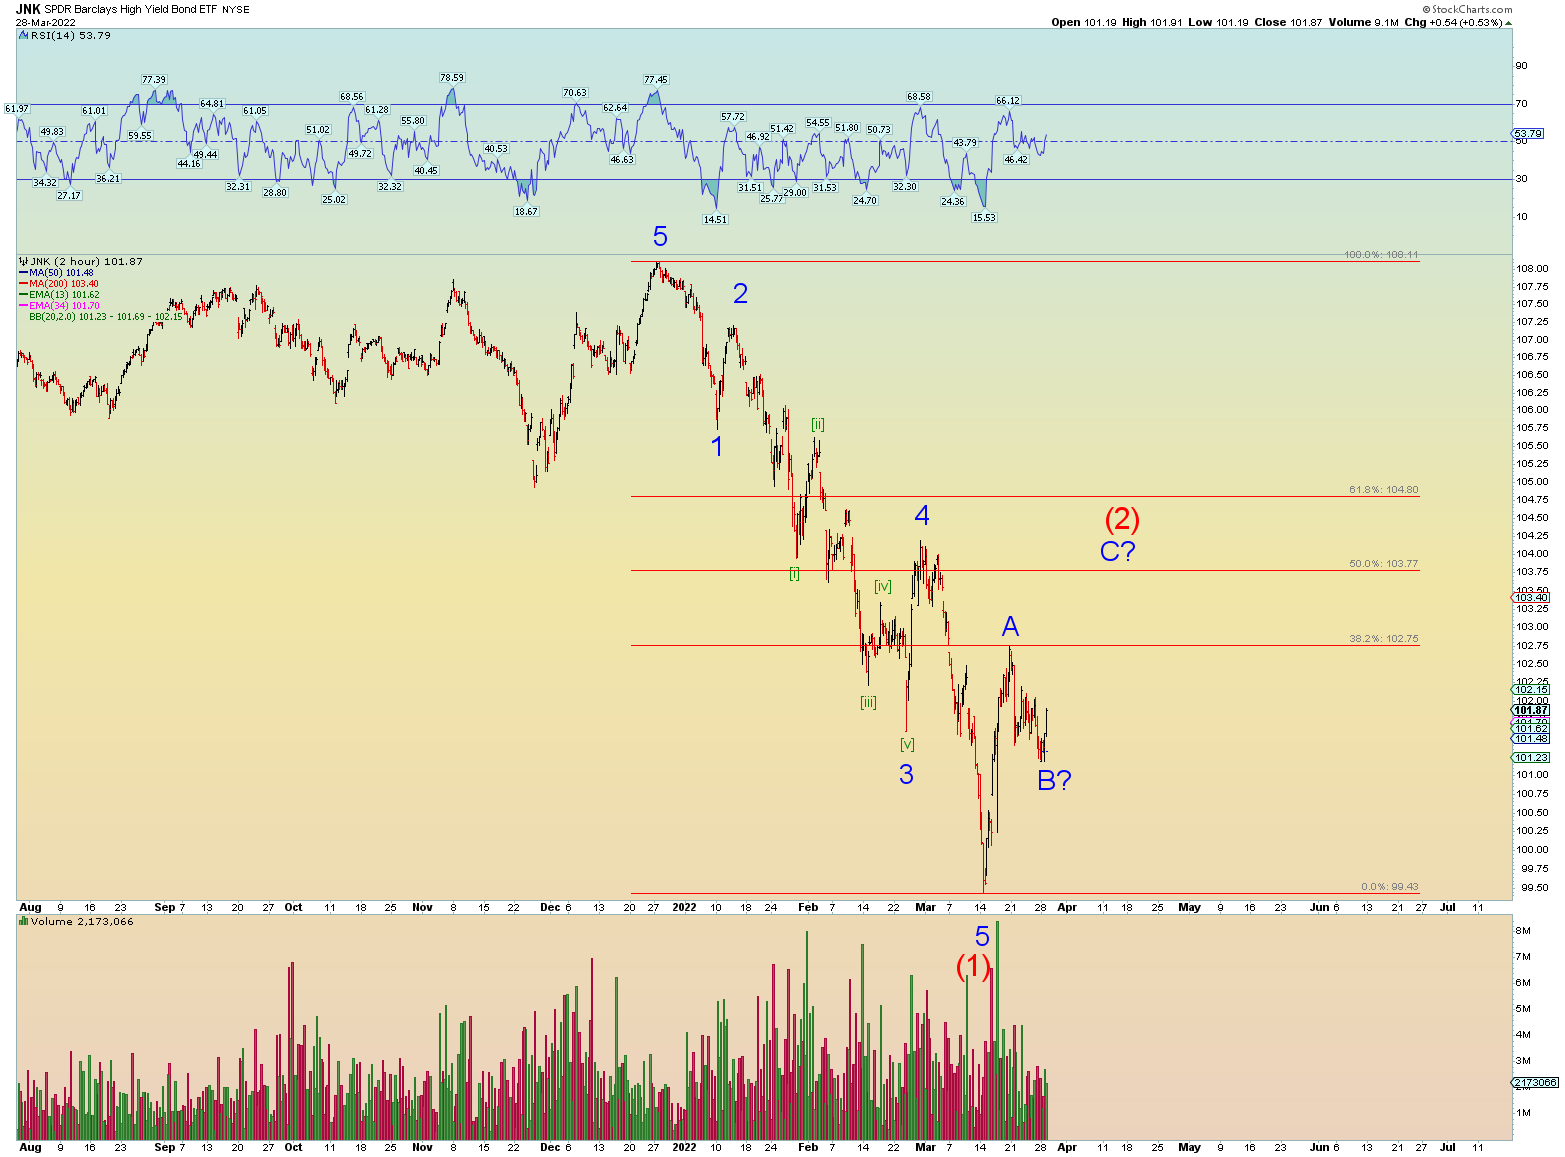
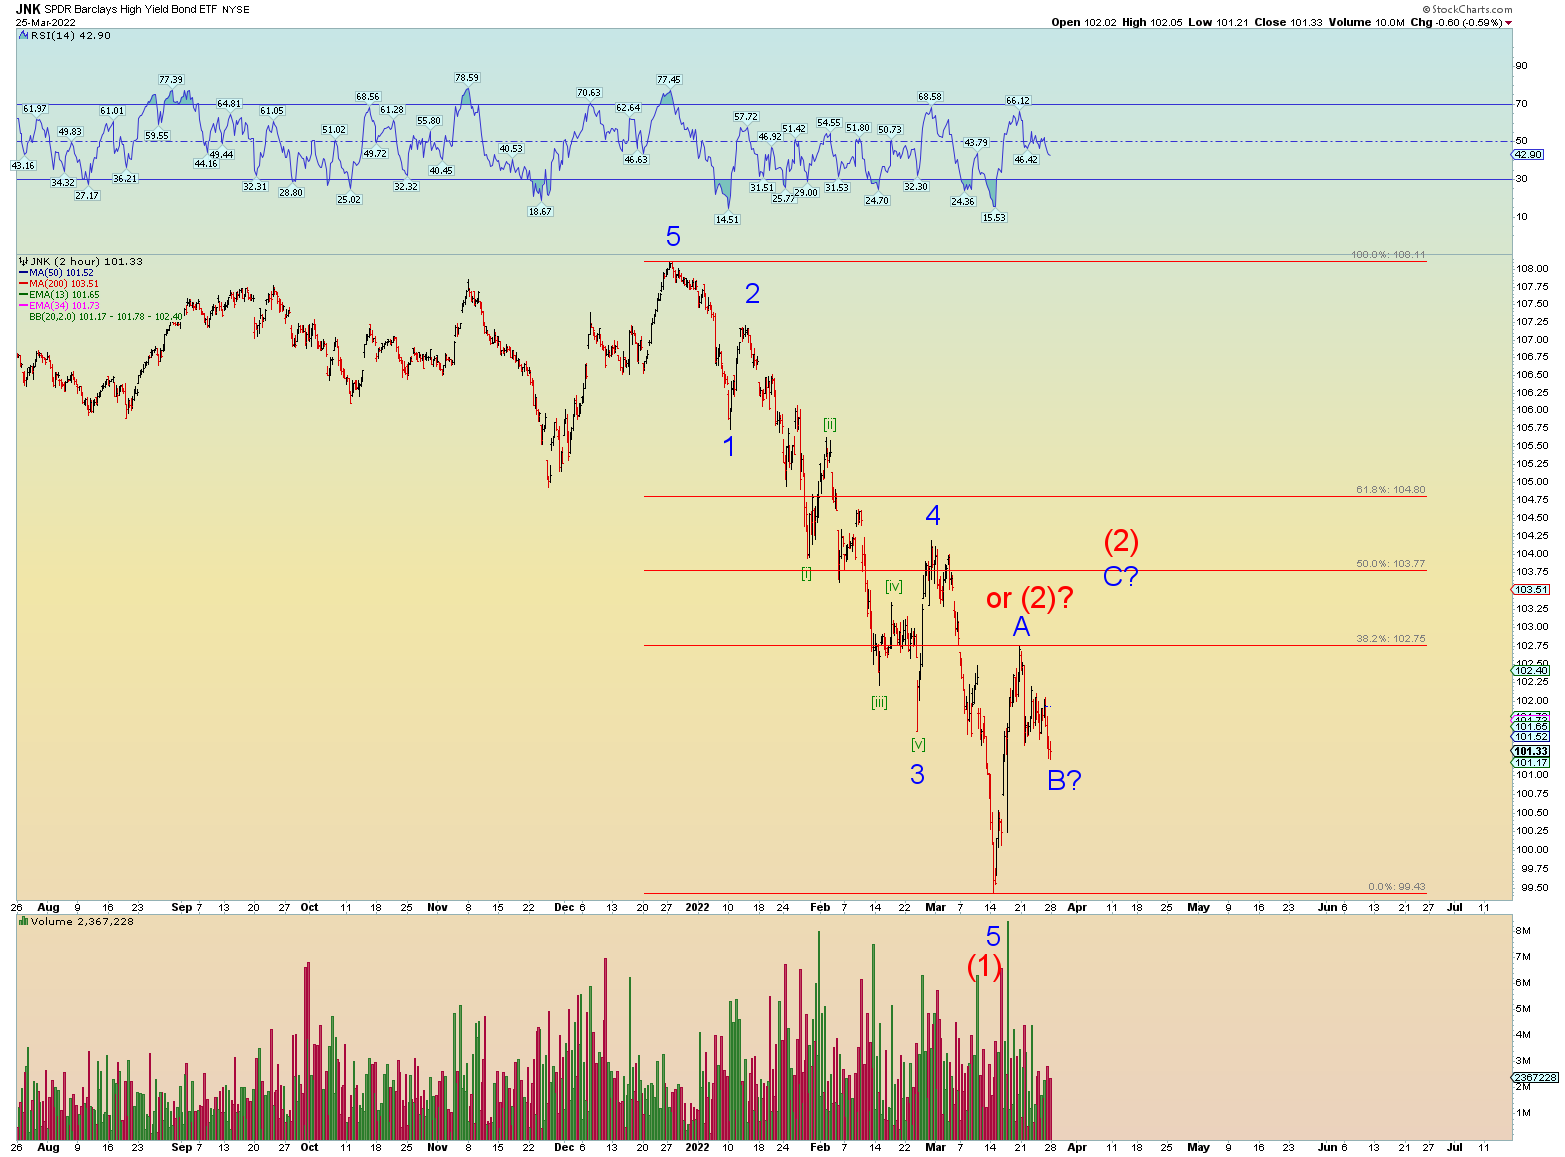
JUNK made its move higher to form what is now a solid A-B-C pattern. We’ll keep an eye on this as if it starts to diverge again from stocks and bleeding lower that could be a clue stocks are ready to top.

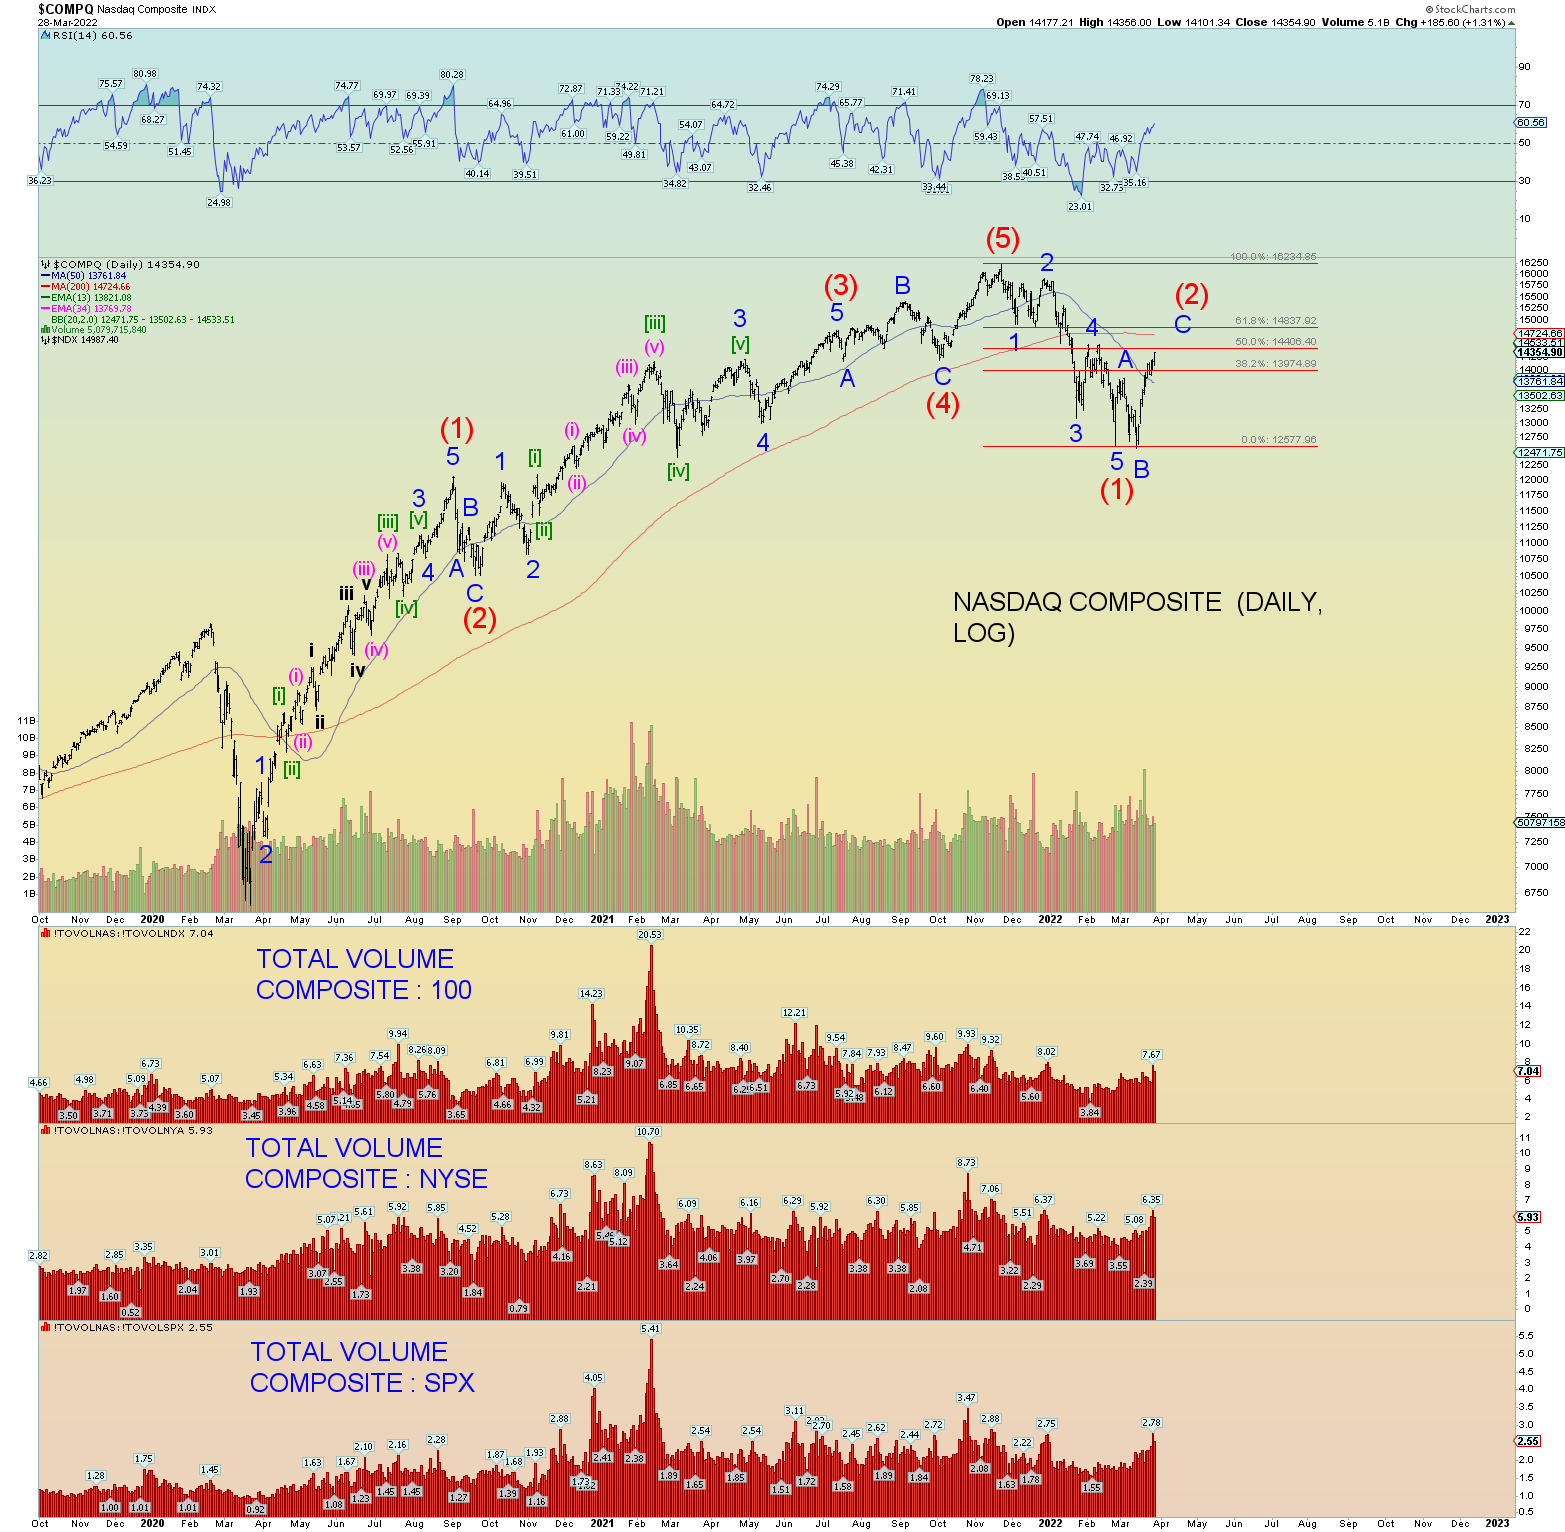
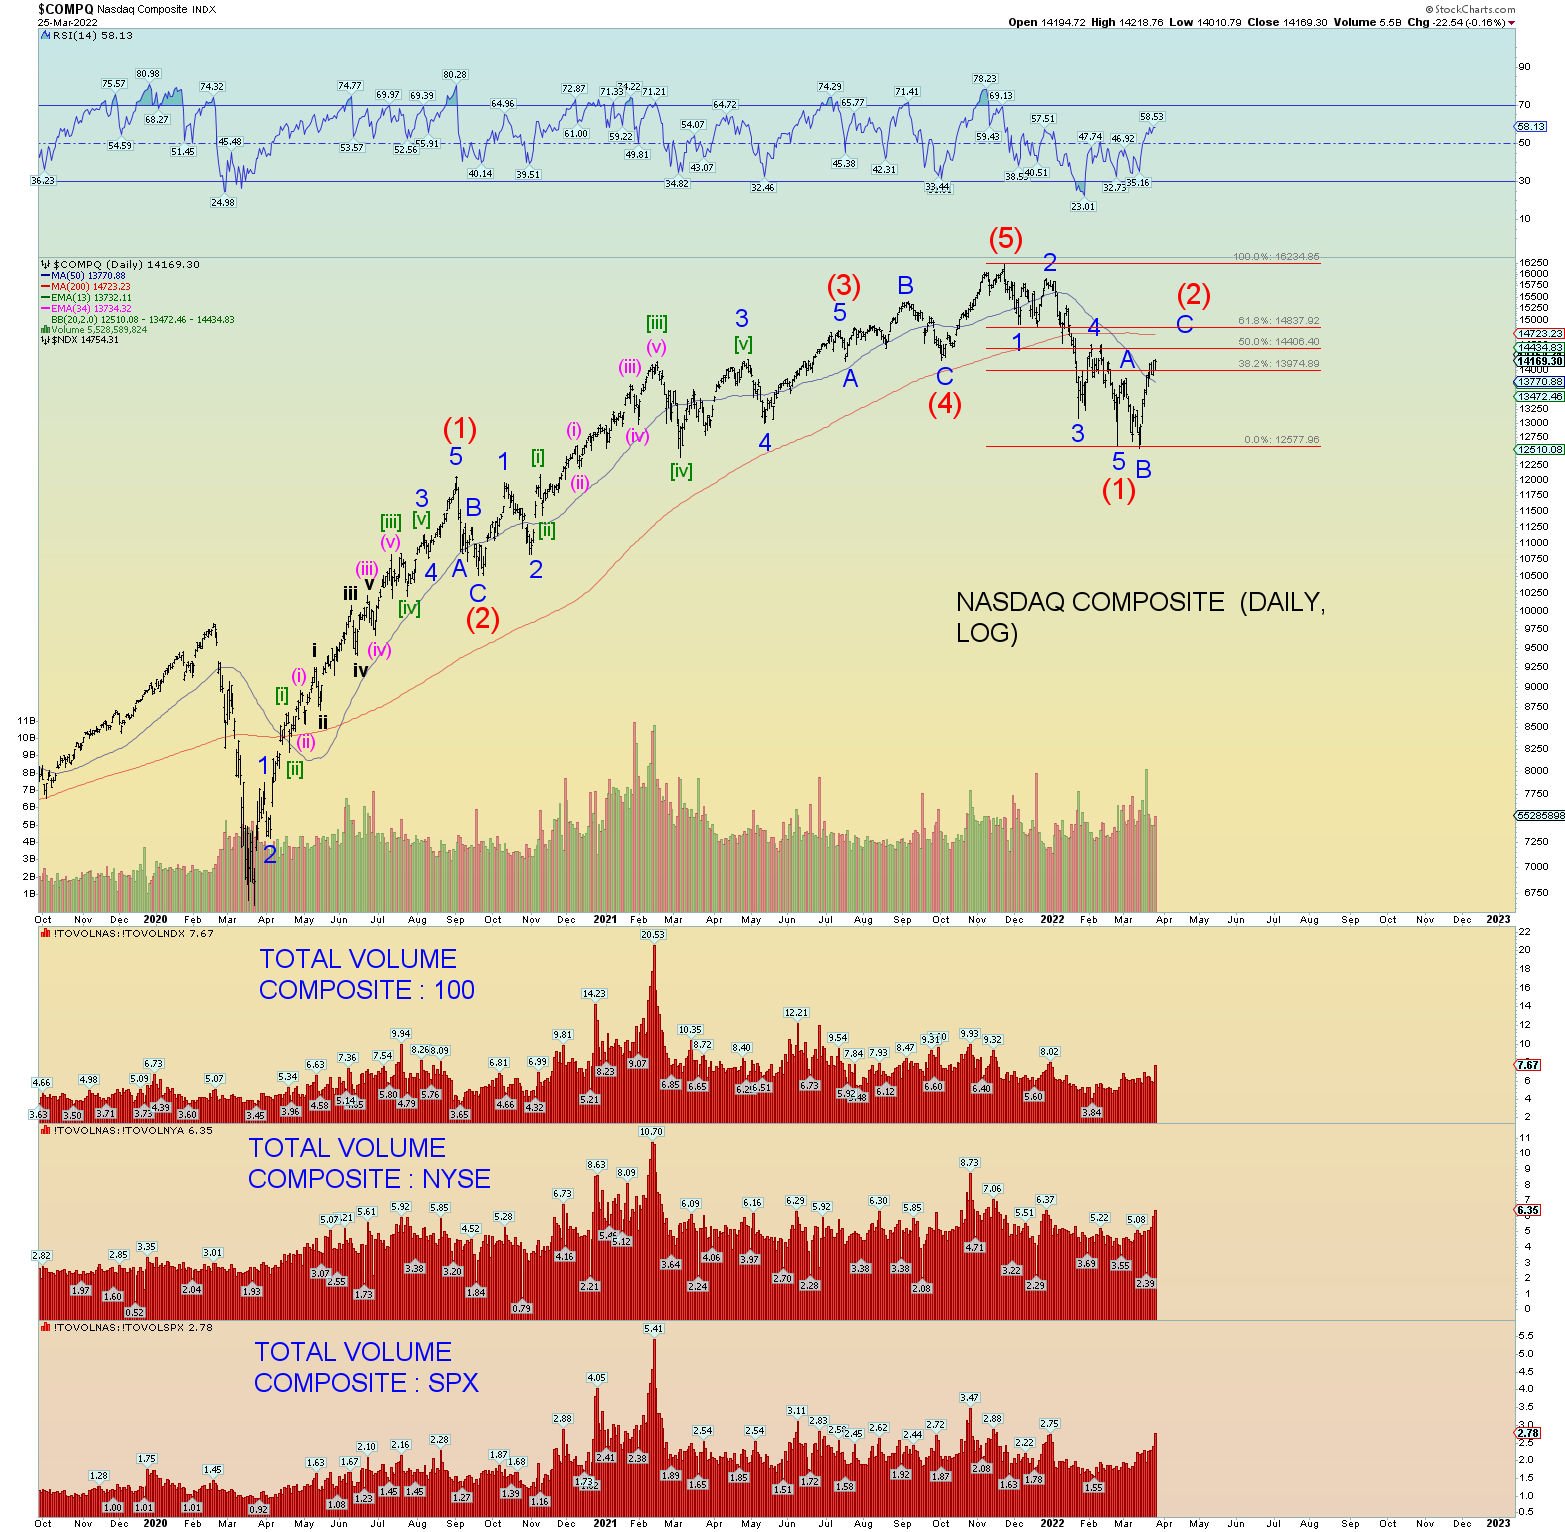
NASDAQ Composite. Just like the Wilshire 5000, if it keeps tracing higher the blue downtrend line is an interesting spot. Like JUNK, we should look to this index to see if it eventually diverges from the SPX and starts to peel lower as it has been leading the way down since November.

And finally, I will repeat what I said last week: The market “bottomed” on February 24th on the opening of the Ukraine war. There is an excellent chance the next “peak” will bring a peace deal – whether that be a new all-time high on some indexes and not others – is something I am very much looking for. That’s how social mood works after all. Wars begin at the lows and eventually peace (in this case I think it would be temporary) returns as social mood moves higher. Signing a peace deal at the peak would be a great opportunity to sell the farm. My bet is that the elite certainly will be.

The Great Reset cannot wait any longer in their eyes. Biden is still trying to provoke Putin every day with his comments, and we are doing nothing but trying to stoke a wider war. Satan is working his evil-doings behind the scenes you can be sure.

Based on my view of the bible, seal 2 (Antichrist being released from Heavan onto this earth) will be opened about June 15th. The result of seal 2 is total global war.

As a side note, also look for the Jewish daily sacrifice to begin again on a mobile platform they wheel up to the western wall on or about June 5th. I just thought I’d throw that in there because it is something I am looking for. Maybe it is done in secret so who knows. I am less sure about this.

Again, I am not dogmatic on the world having started Daniel’s 70th week last September. If we do not have total global war at the very latest by September 2022, then I am likely wrong. September 2022 would be late for seal 2 so I expect it earlier June 15th, 2022, to be precise.

Elliott Wave Update Intraday ~ 29 Mar 2022

Update:

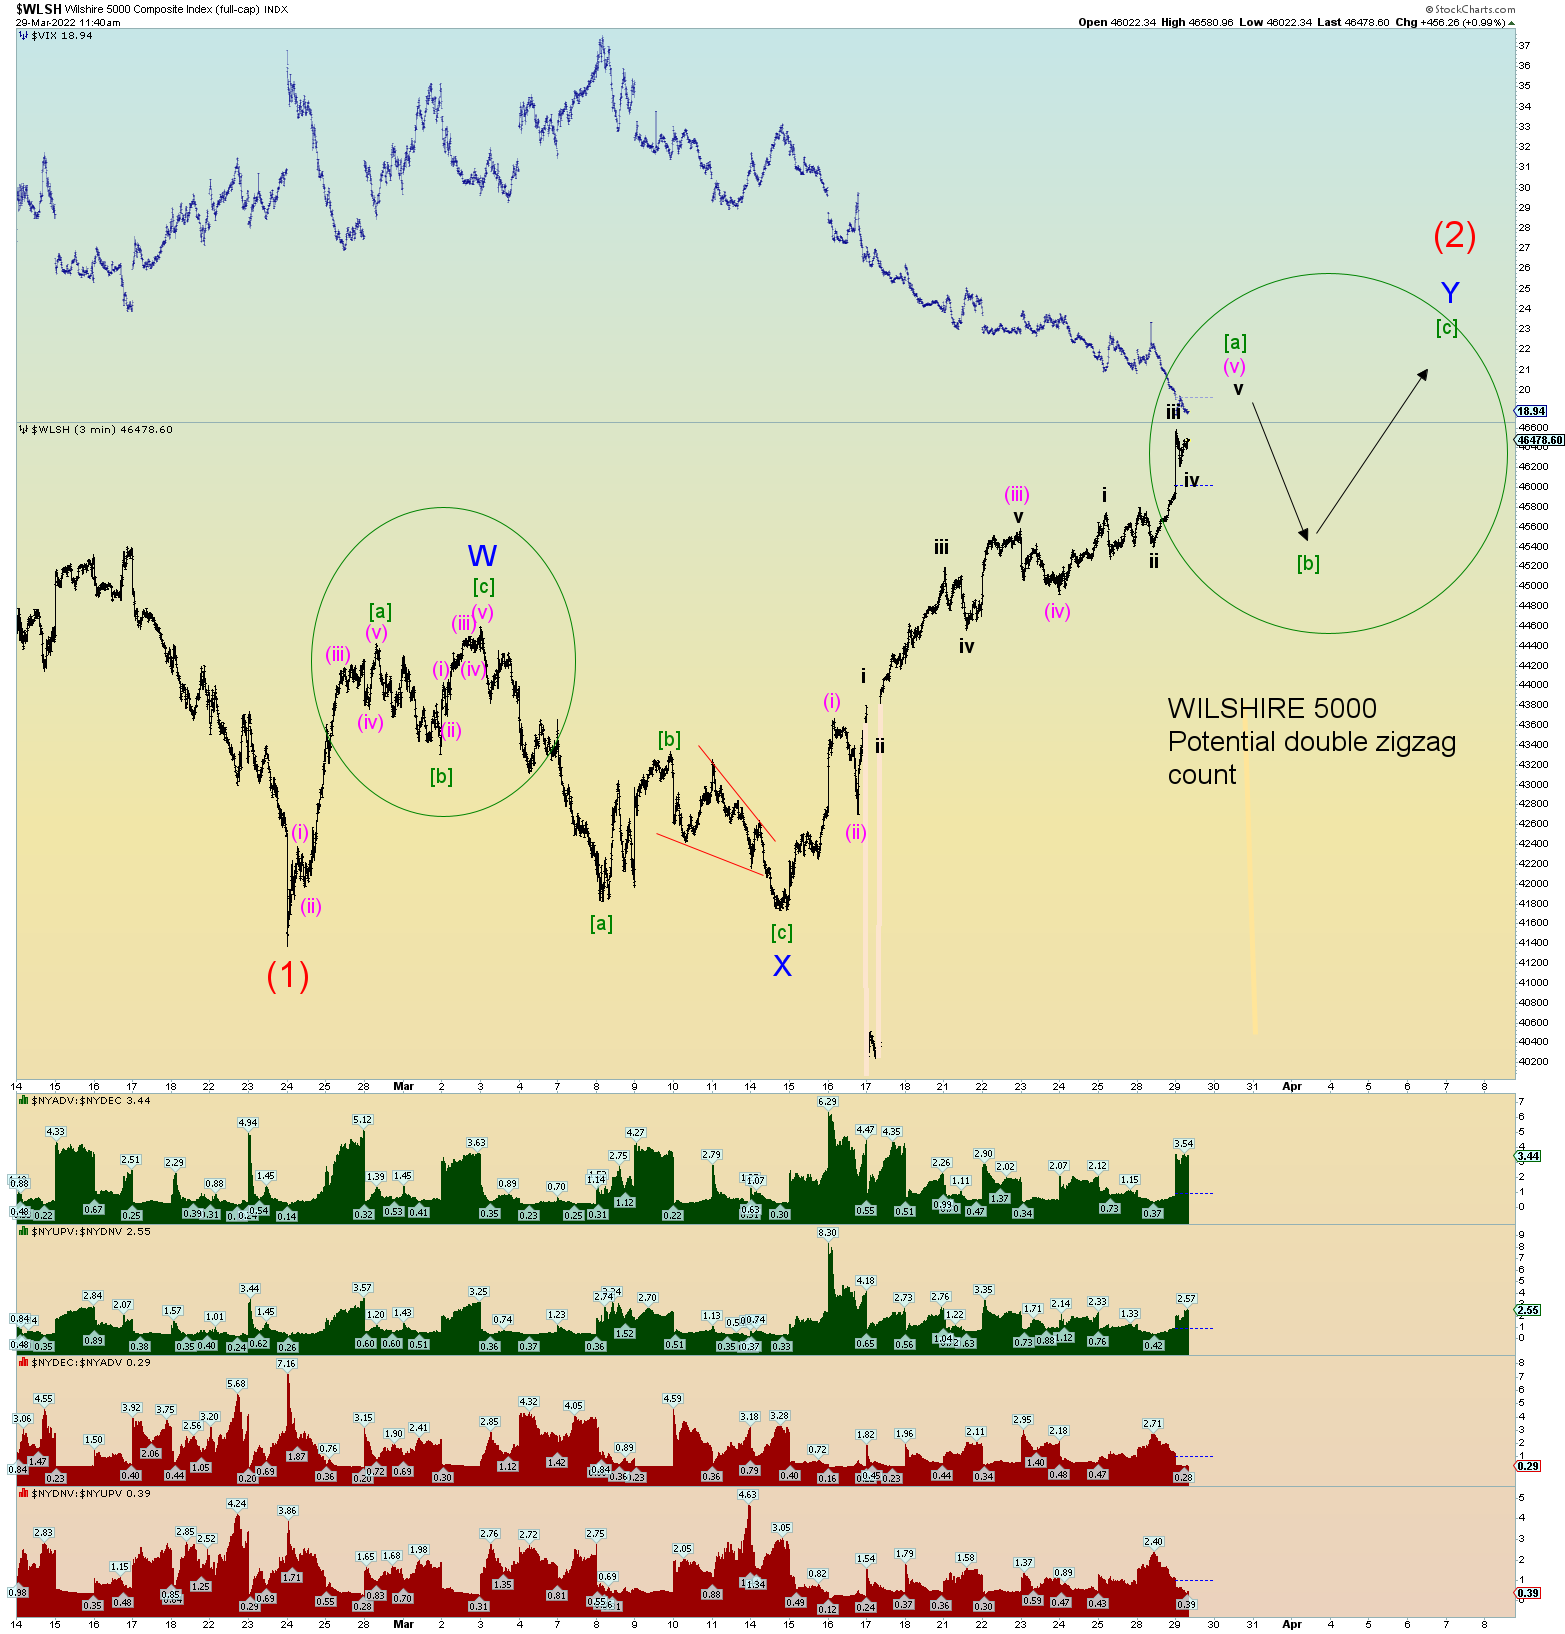
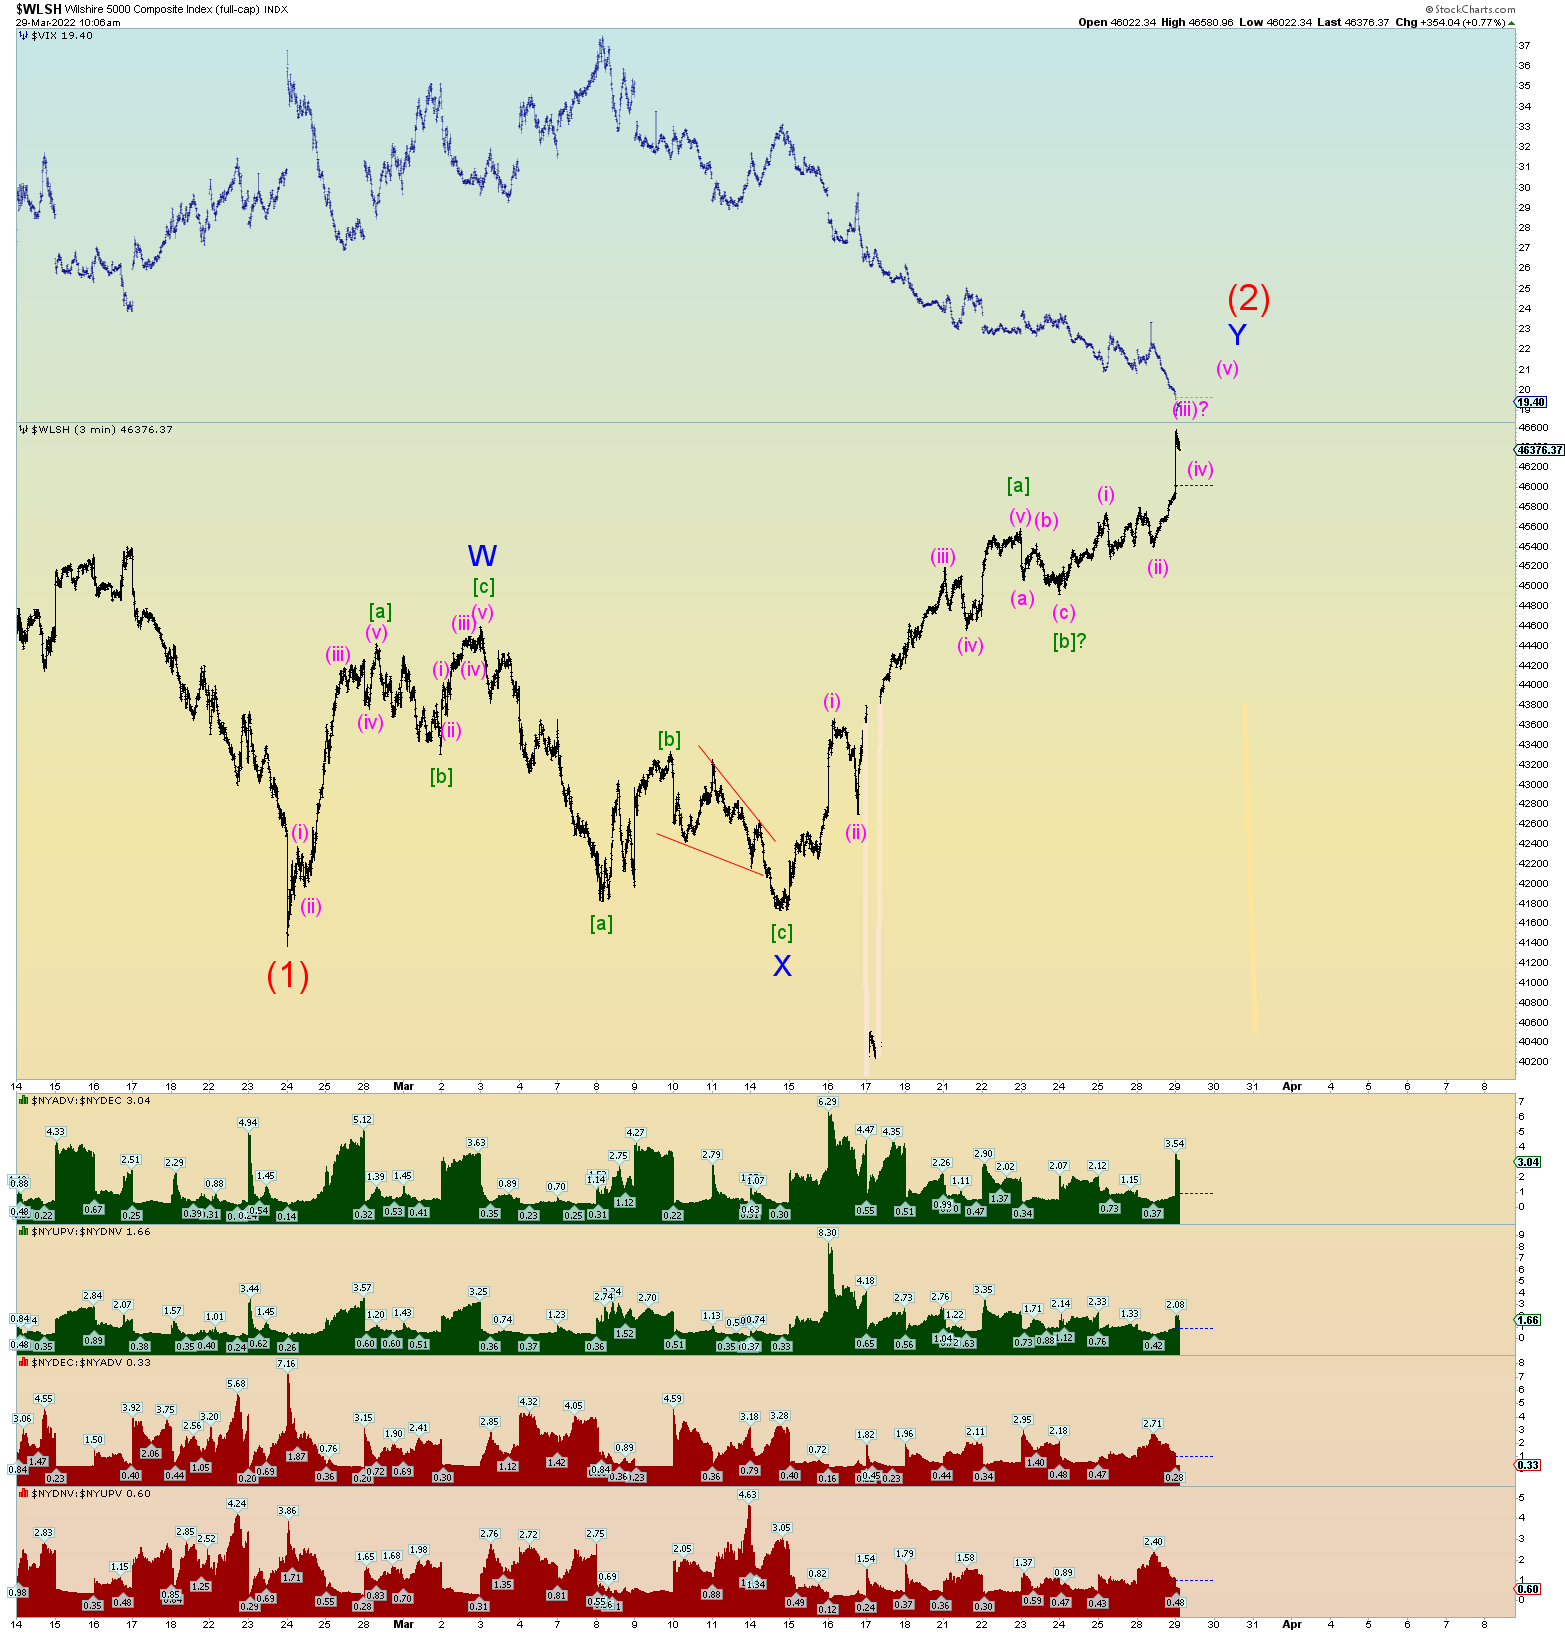
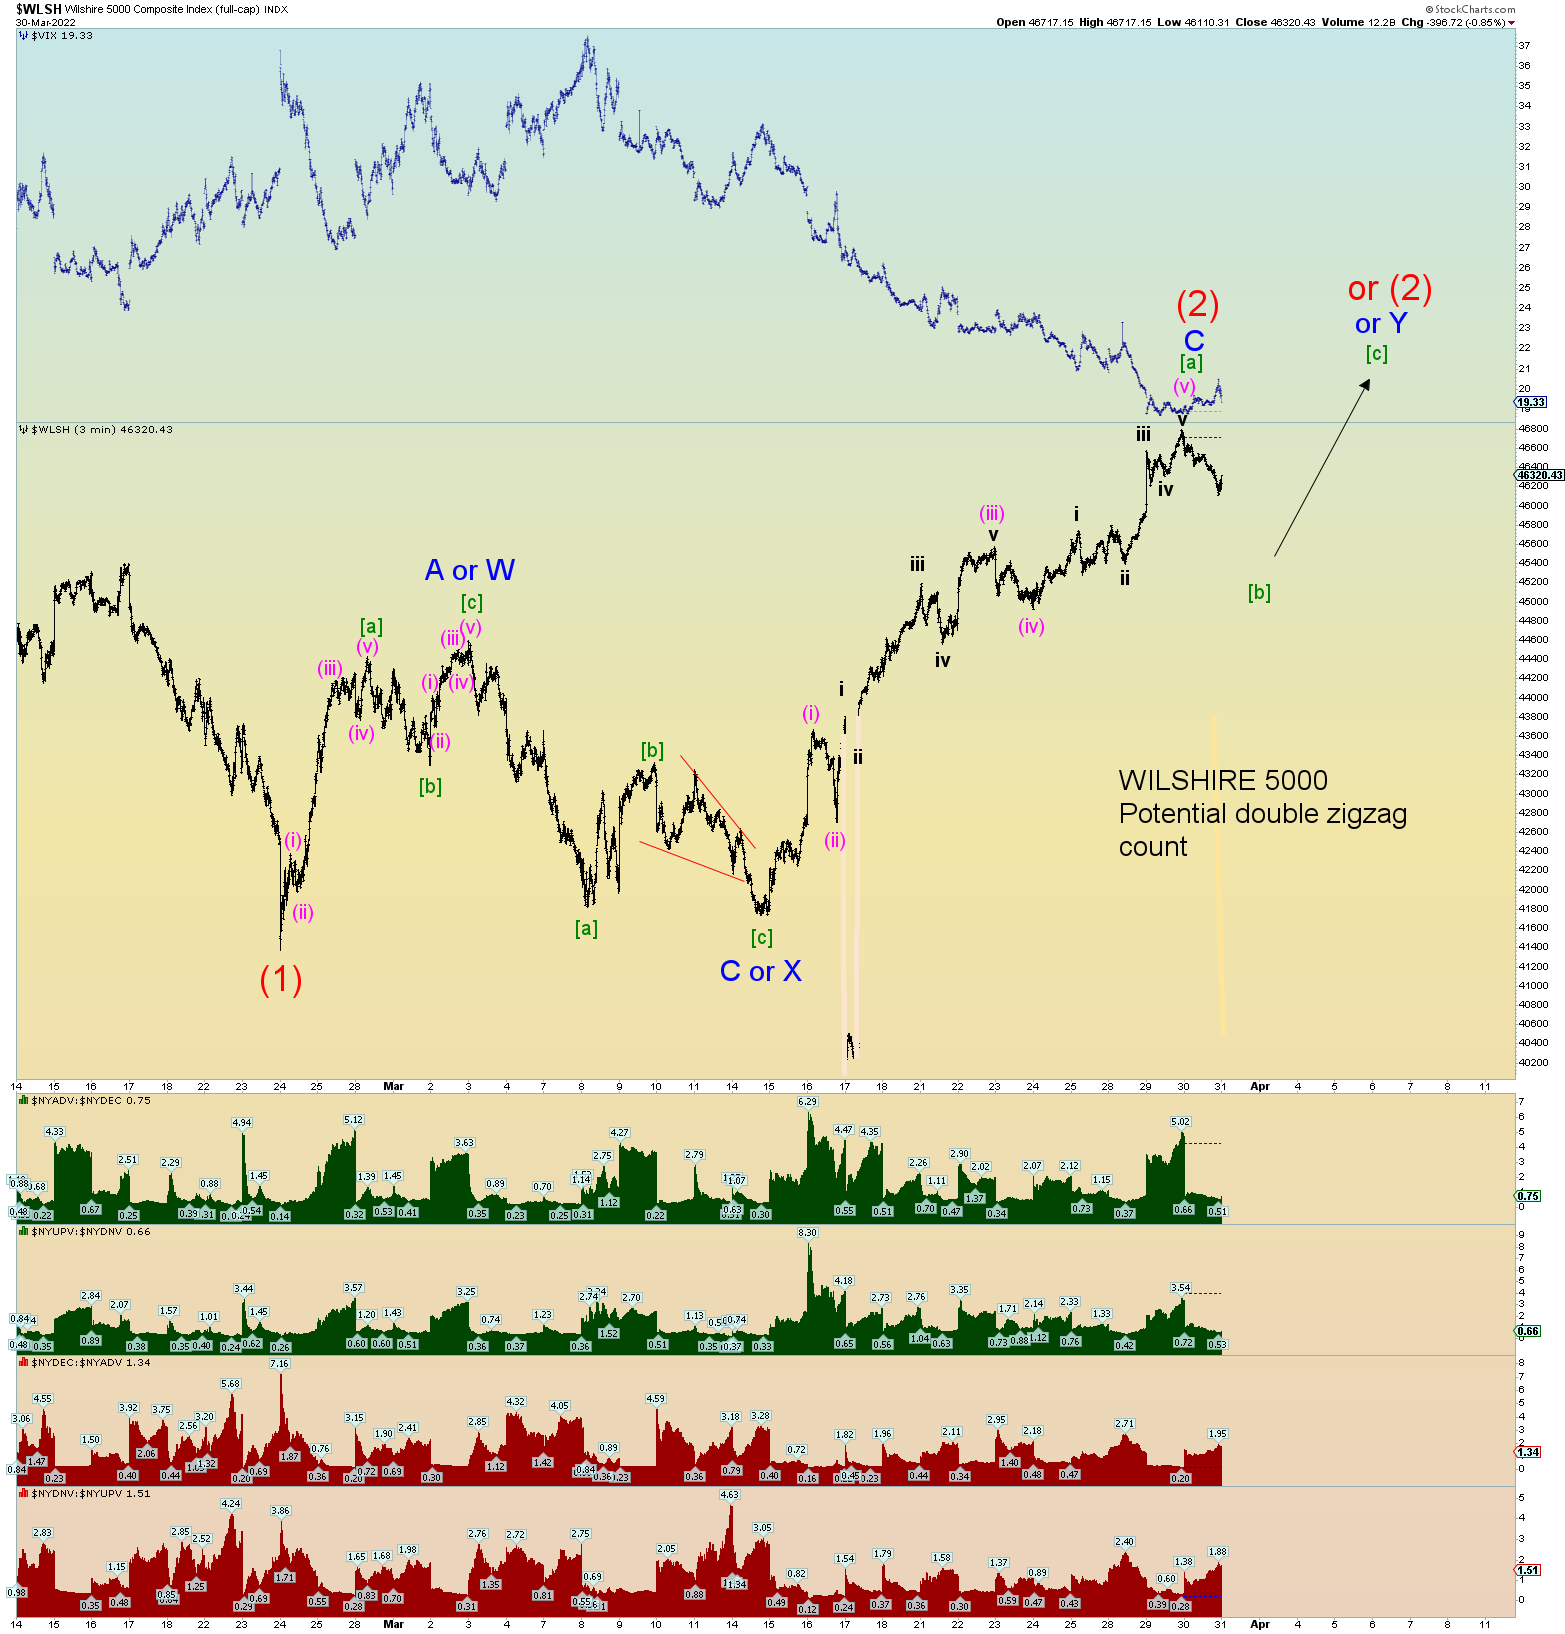
Another good potential squiggle count is presented below. Basically, finishing the quarter on or near a rebound high, start April with a down move (perhaps opening gap down) and then move higher to meet the underside of the long-term upper channel line as shown on the weekly.

This count has us finishing up wave [a] of Y of (2).

Remember, the Wilshire has what appears as a misprint on stockcharts. I tried to cover it up. Basically, where wave ii of (iii) is.

Original Post:

I’ might have updates as the day goes on, if so, I’ll post here at the top of the post.

Wave (2) continues on without pause. In this over-leveraged market would we expect anything different?

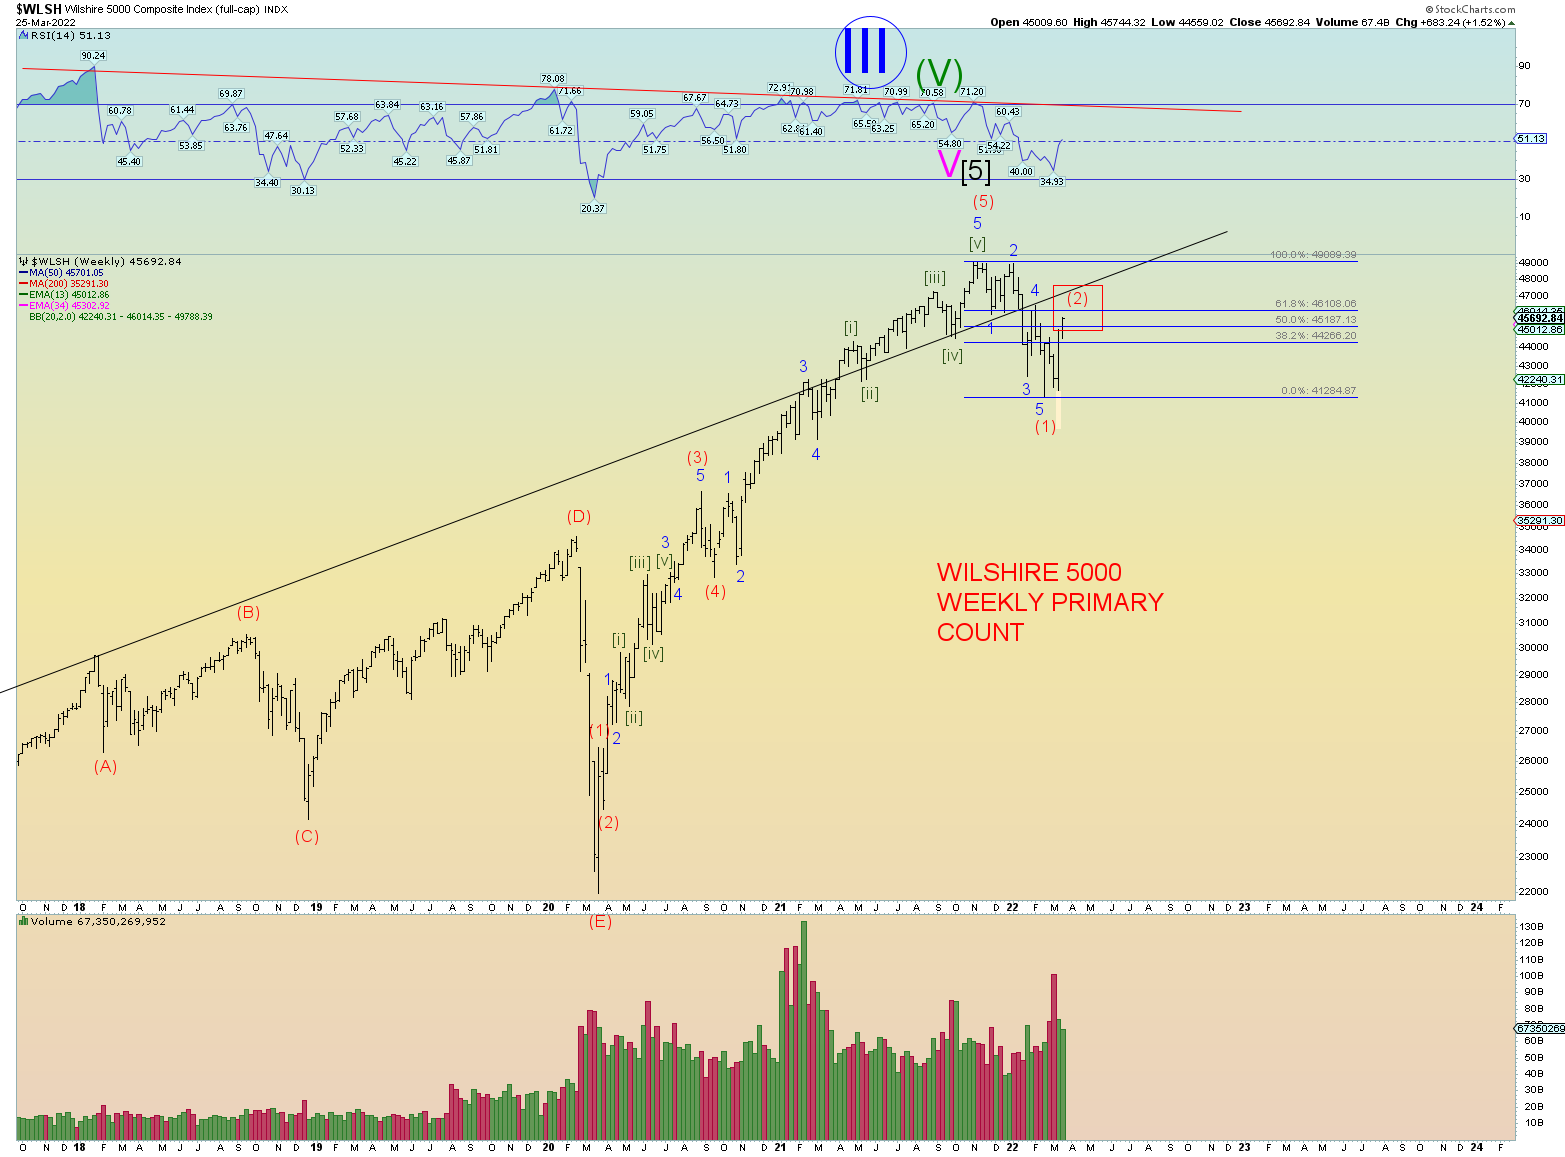
The ultimate target could be a backtest of the broken long term upper channel line. At the top, prices overthrew this line for quite many months. Then it finally broke under. For the bull market to continue, prices need to get back above this channel line. It’s that simple, I guess. So here we are.

Definitely in the wave (2) target zone I described a few posts ago.

Elliott Wave Update ~ 28 Mar 2022

COMMENTARY

This timely article via Zero Hedge is exactly how I feel about things, please read. “Gradually, …Then Suddenly!” | ZeroHedge

I would only add that the world is setting itself up for the return of Jesus Christ. There is no “fixing” things by man’s hands. The world is hopelessly broken. Everything is a massive fraud. A lie. Everything. Our financial markets, our medical system, our governments. They spray toxic chemicals in the sky on us constantly. They demand we inject our babies with poisons. They manipulate our food and water supplies. Our corporations are corrupt, the media is corrupt, the entertainment industry is a lie. I could go on and on. It is all set up for the return of Jesus. He will right every wrong, punish the evildoers, and reward the faithful. Oh yes, the meek shall inherit the earth you can believe that!

Zelensky is headed for hell. I am sure Putin is too. The western elite has pushed for this war, and I only suspect their ultimate goal is to get Russia to heel. To eliminate Putin and wreck Russia. Zelensky is the puppet of course. Or maybe they just want a world war. It sure seems that way. In either case, the end of times biblical prophecies predicts global war. Global war to tear down the current systems, and then the Antichrist and False Prophet comes on the scene to take it all over and “reset” in Satan’s image. Nations by then will gladly hand him power. One world government, one world currency (digital), and one world religion.

Christians better be prepared as we will have to face the Antichrist’s minions prior to Jesus’s return. I rejoice nonetheless and eagerly await the great reset. For just when Satan thinks he has won, Jesus comes back and will indeed reset this earth and not to the elite’s liking. They will feel God’s wrath.

THE COUNTS

A healthy wave (2). Approaching Fibonacci 61.8% on the Wilshire and 50% on the NASDAQ. DJIA approaching 61.8%. This is about when everyone starts squealing that the bears have no clue, yadda, yadda, yadda. I’m expecting the emails any minute. Even Cramer called the bear market over last Friday, but he is usually right for a day or 2 or maybe a week. I am still thinking about April 6th is when this wave tops if not before then.

The higher end retrace has the WIlshire backtesting the brokjen neckline at about 47,000.

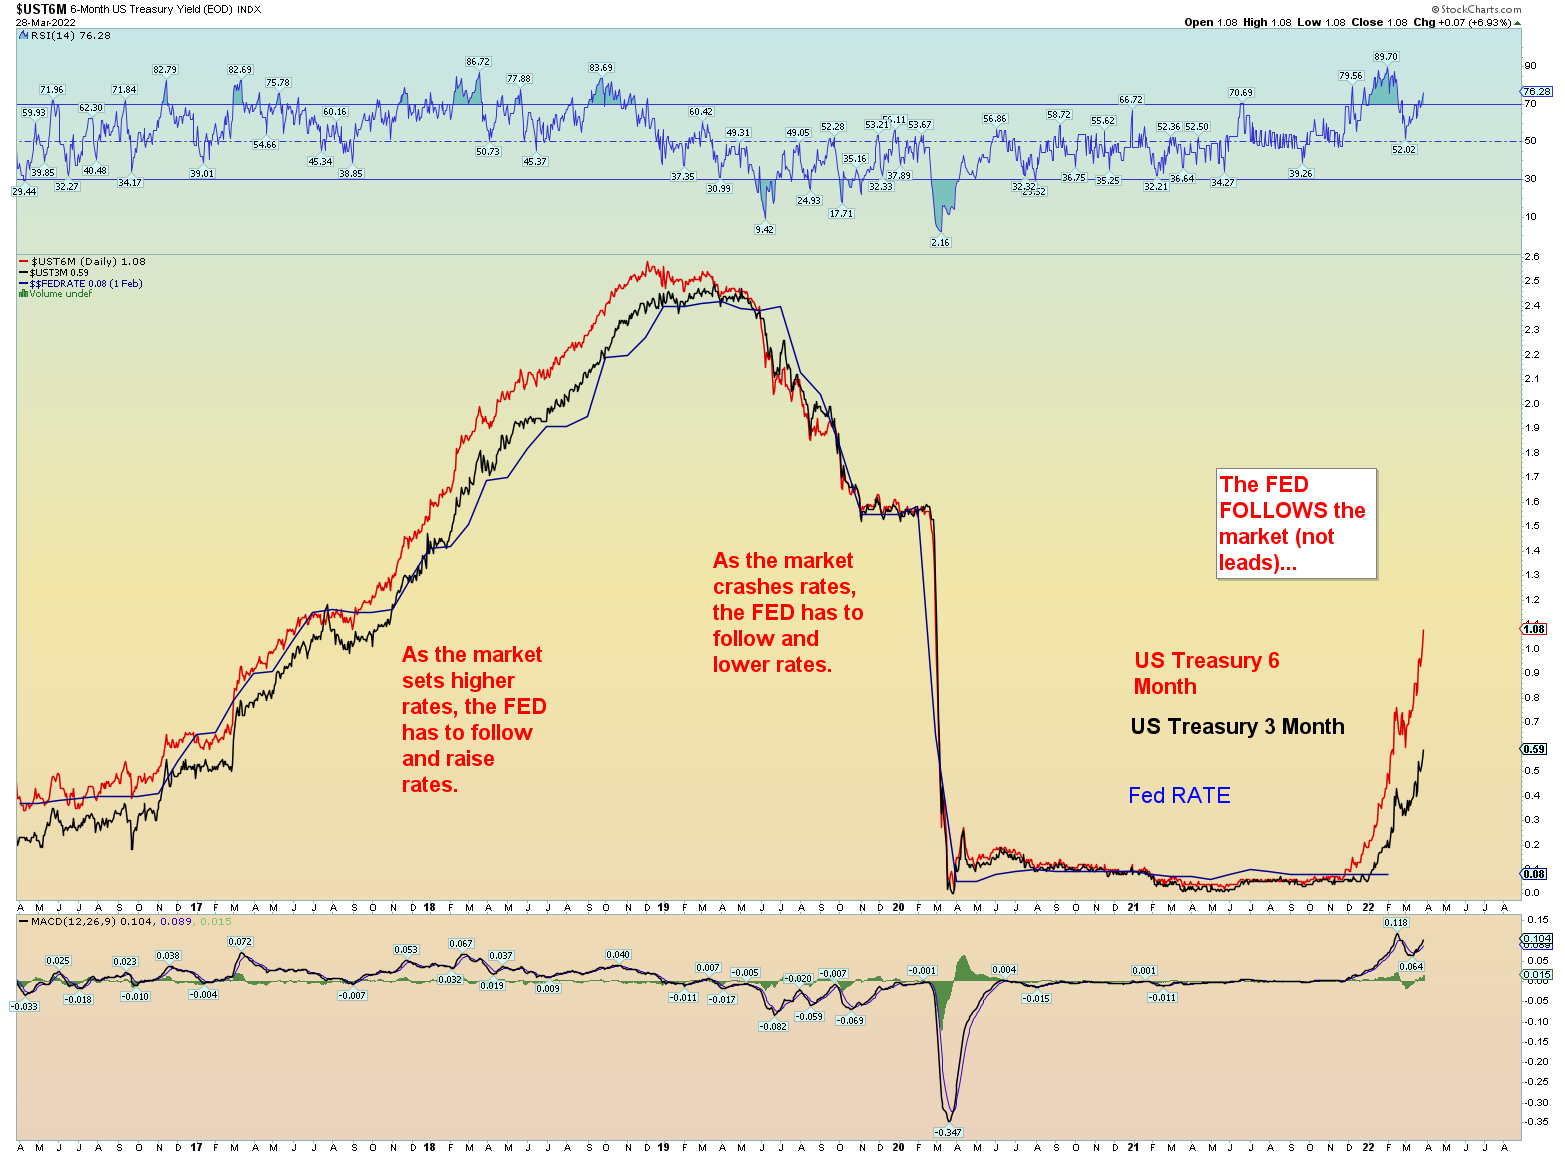
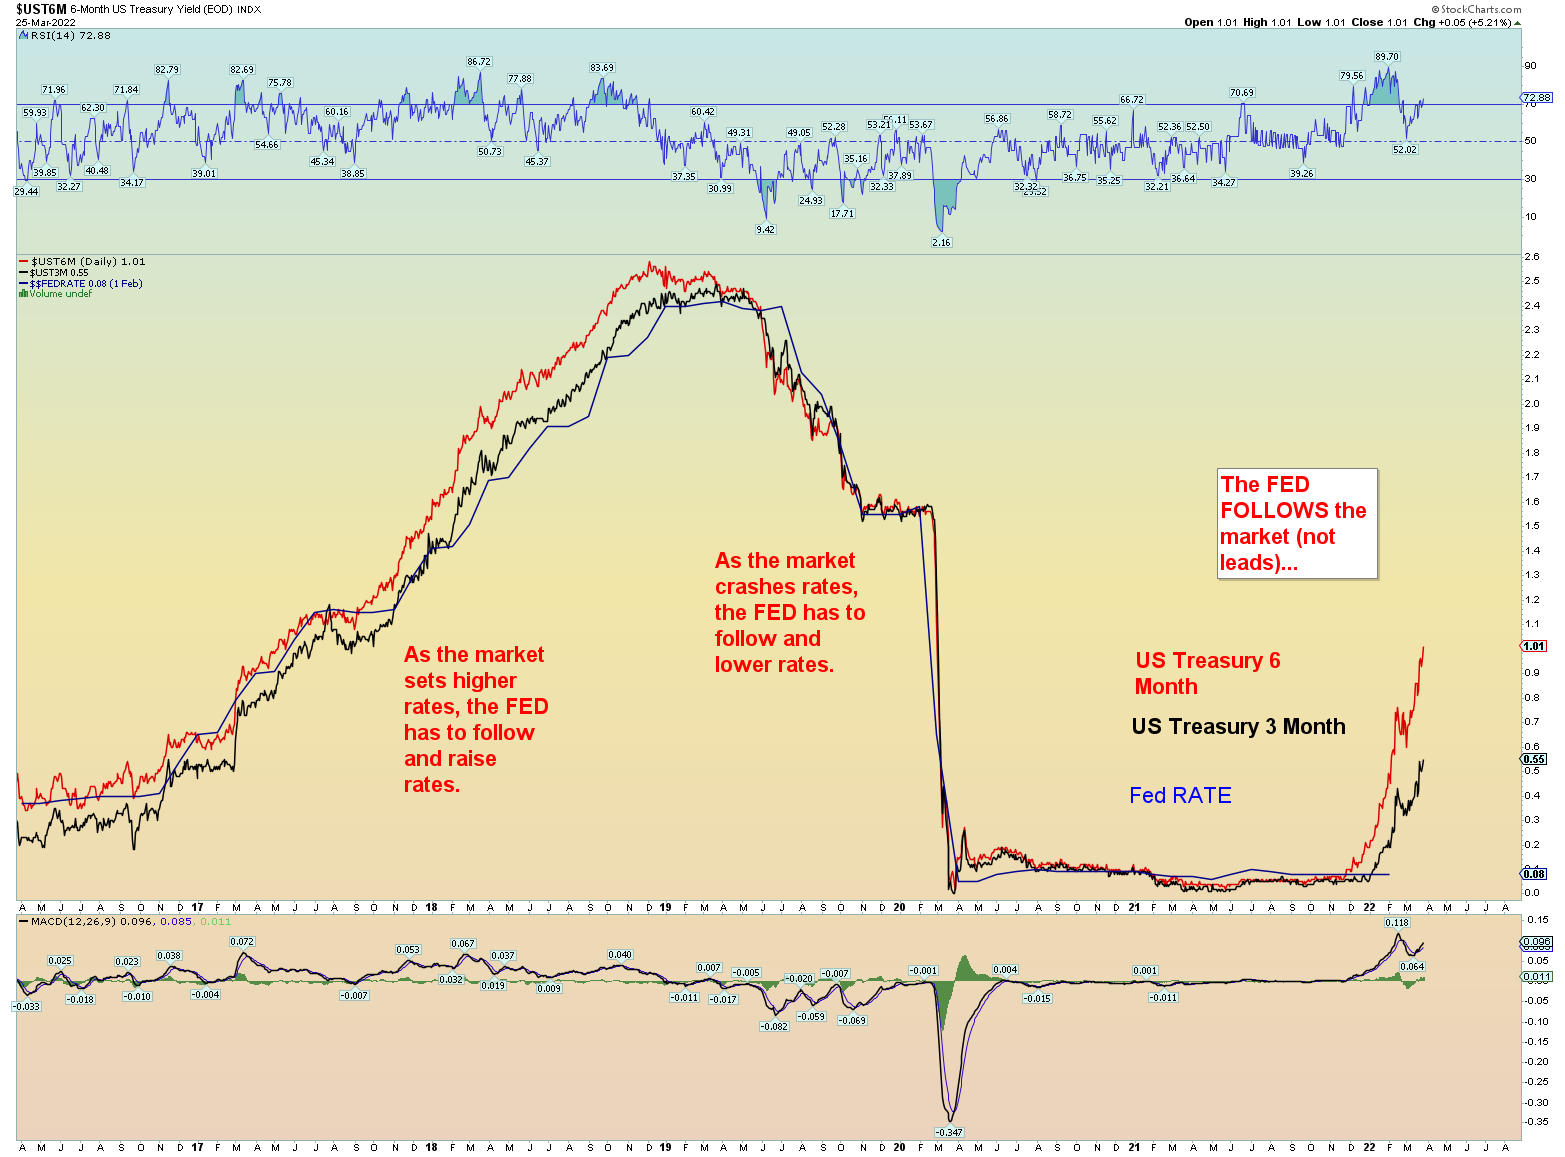
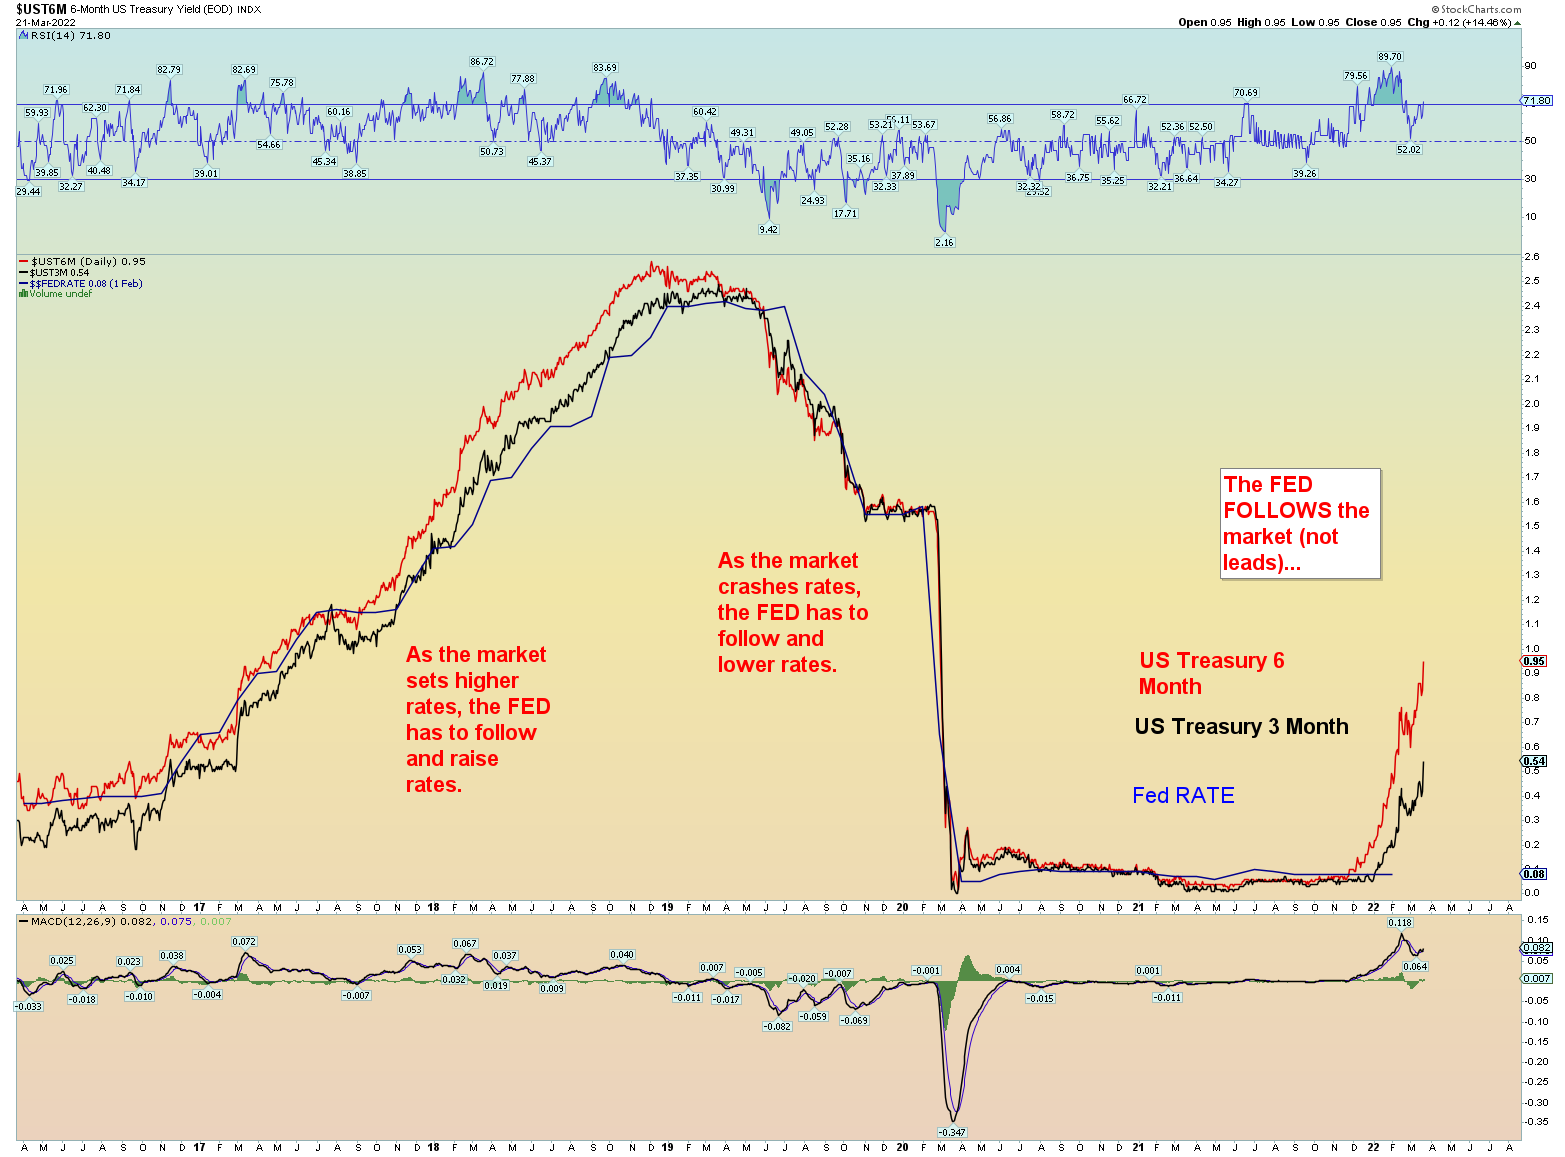
Short term rates still climbing. The Fed is already a full .25 point behind the market (the Fed rate is running at about .33) and the next Fed meeting is not until 28-29 April. This is why they hinted they may have to raise rates 1/2 point at the next meeting. Of course, if things get really out of hand, they could make an emergency rate raise prior to that

Elliott Wave Update ~ 25 Mar 2022

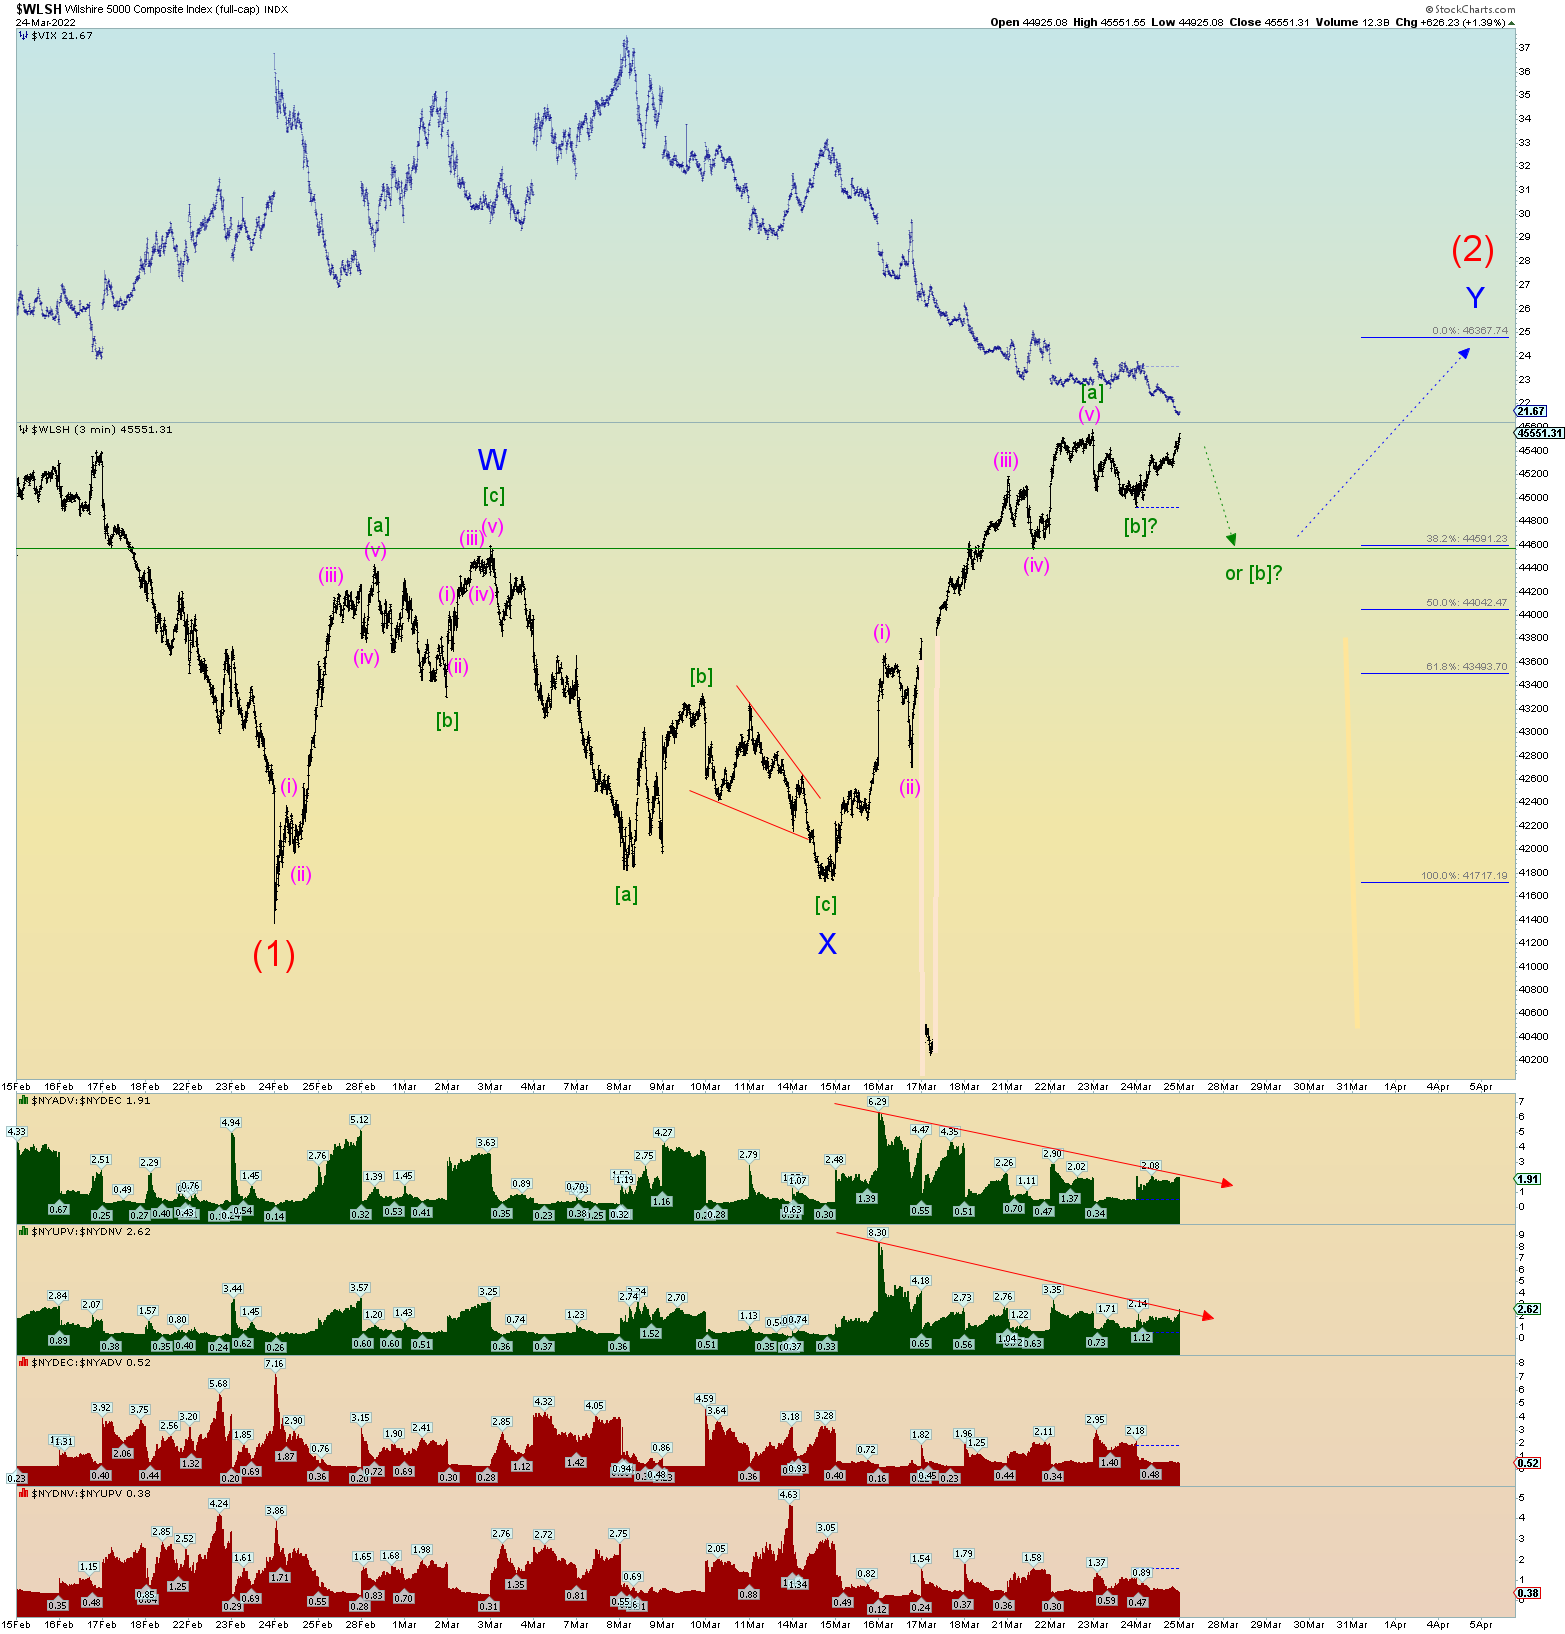
Best guess squiggle count for the double zigzag pattern for wave (2). Still looking for confirmation of a wave [b] of Y. I’m looking for a dip down early next week and then rally through the end of quarter on Thursday the 31st.

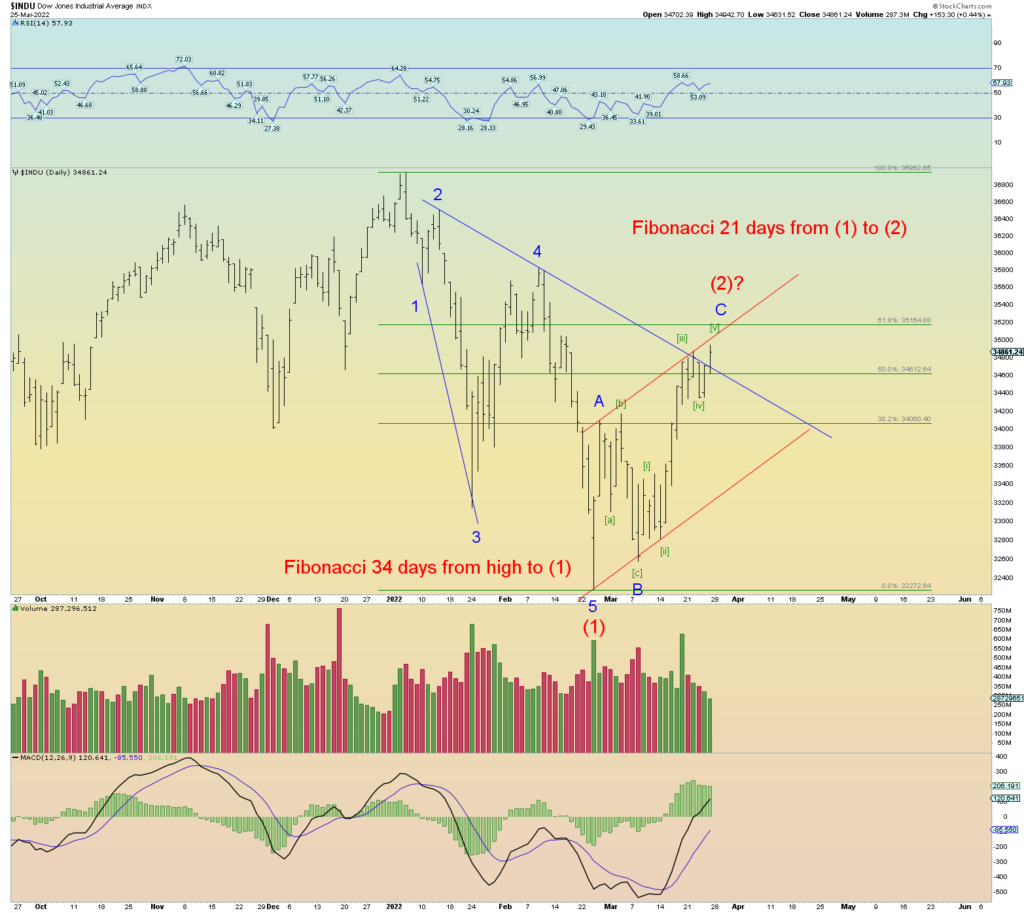
If you compare the above Wilshire count (which topped 1st week of November) and the DJIA chart below, you can see why a quicker, rather than longer, resolution to wave (2) would work nicely. Obviously at the tops there was significant divergence.

But this is why I use the total market Wilshire 5000 as my base index for counting waves. We have a clear 5 waves down albeit with waves 1 and 4 overlap which is not ideal. However, considering a total market in transition the Wilshire traced a remarkable pattern. Yet even so, the DJIA is interesting also. A potential leading diagonal triangle down.

Wave (2) could very well be over. A very nice 34/21 split in time for the DJIA (and SPX). The retrace in all the indices – DJIA, SPX, Wilshire, and NASDAQ Composite has more than satisfied a typical wave (2) retrace (although the Composite is lagging a bit but to be expected it is considered leading the way lower).

Junk touched on a Fibonacci 38.2% retrace but has pulled back in price. Junk should be leading the way down so this could be a something to watch. You can say it is already diverging.

Surging yields. The Fed is already about a 1/4 point behind the market. An unannounced emergency rate hike is a possibility.

My target line is like a magic magnet. Sort of like the vaccine goo.

And finally, this chart still exists. It’s not the preferred count at the moment but we still have a lower high situation intact.

Elliott Wave Update ~ 24 Mar 2022

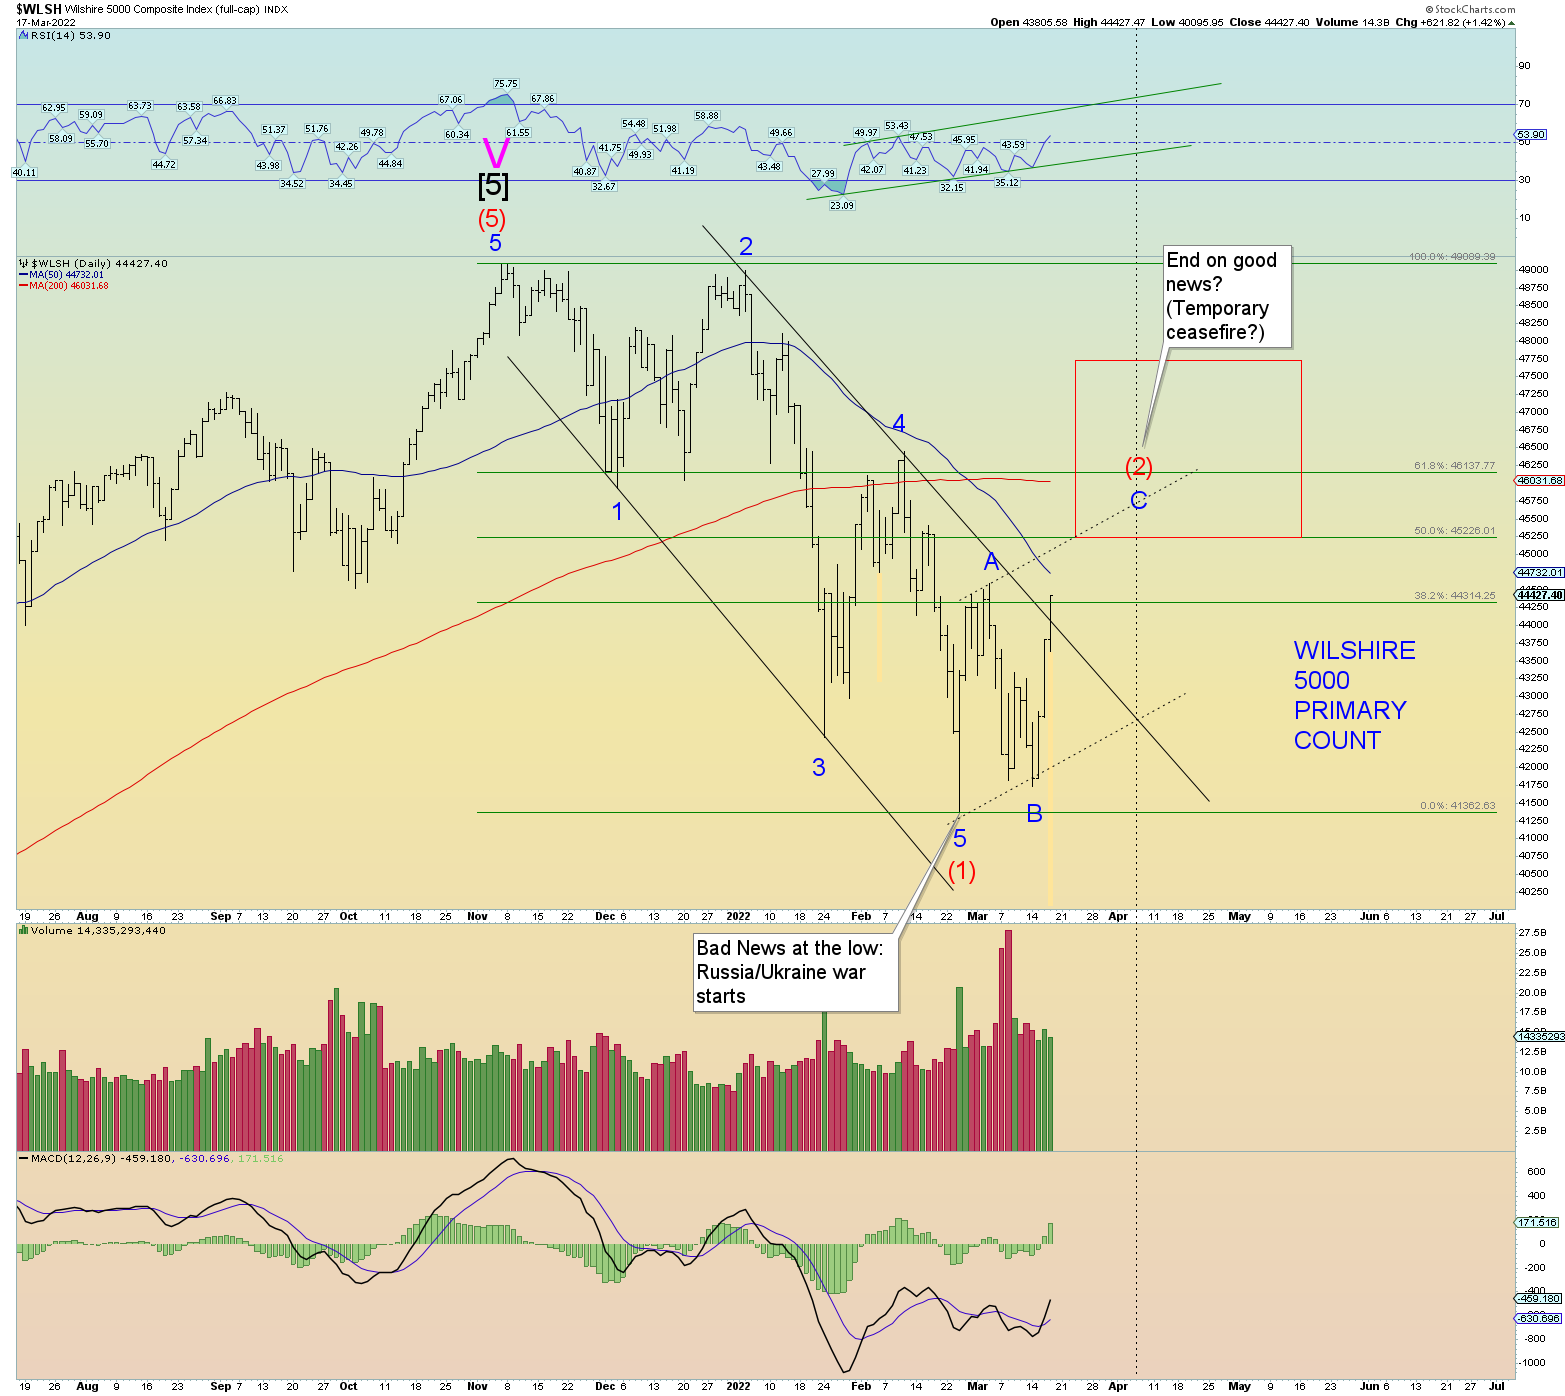
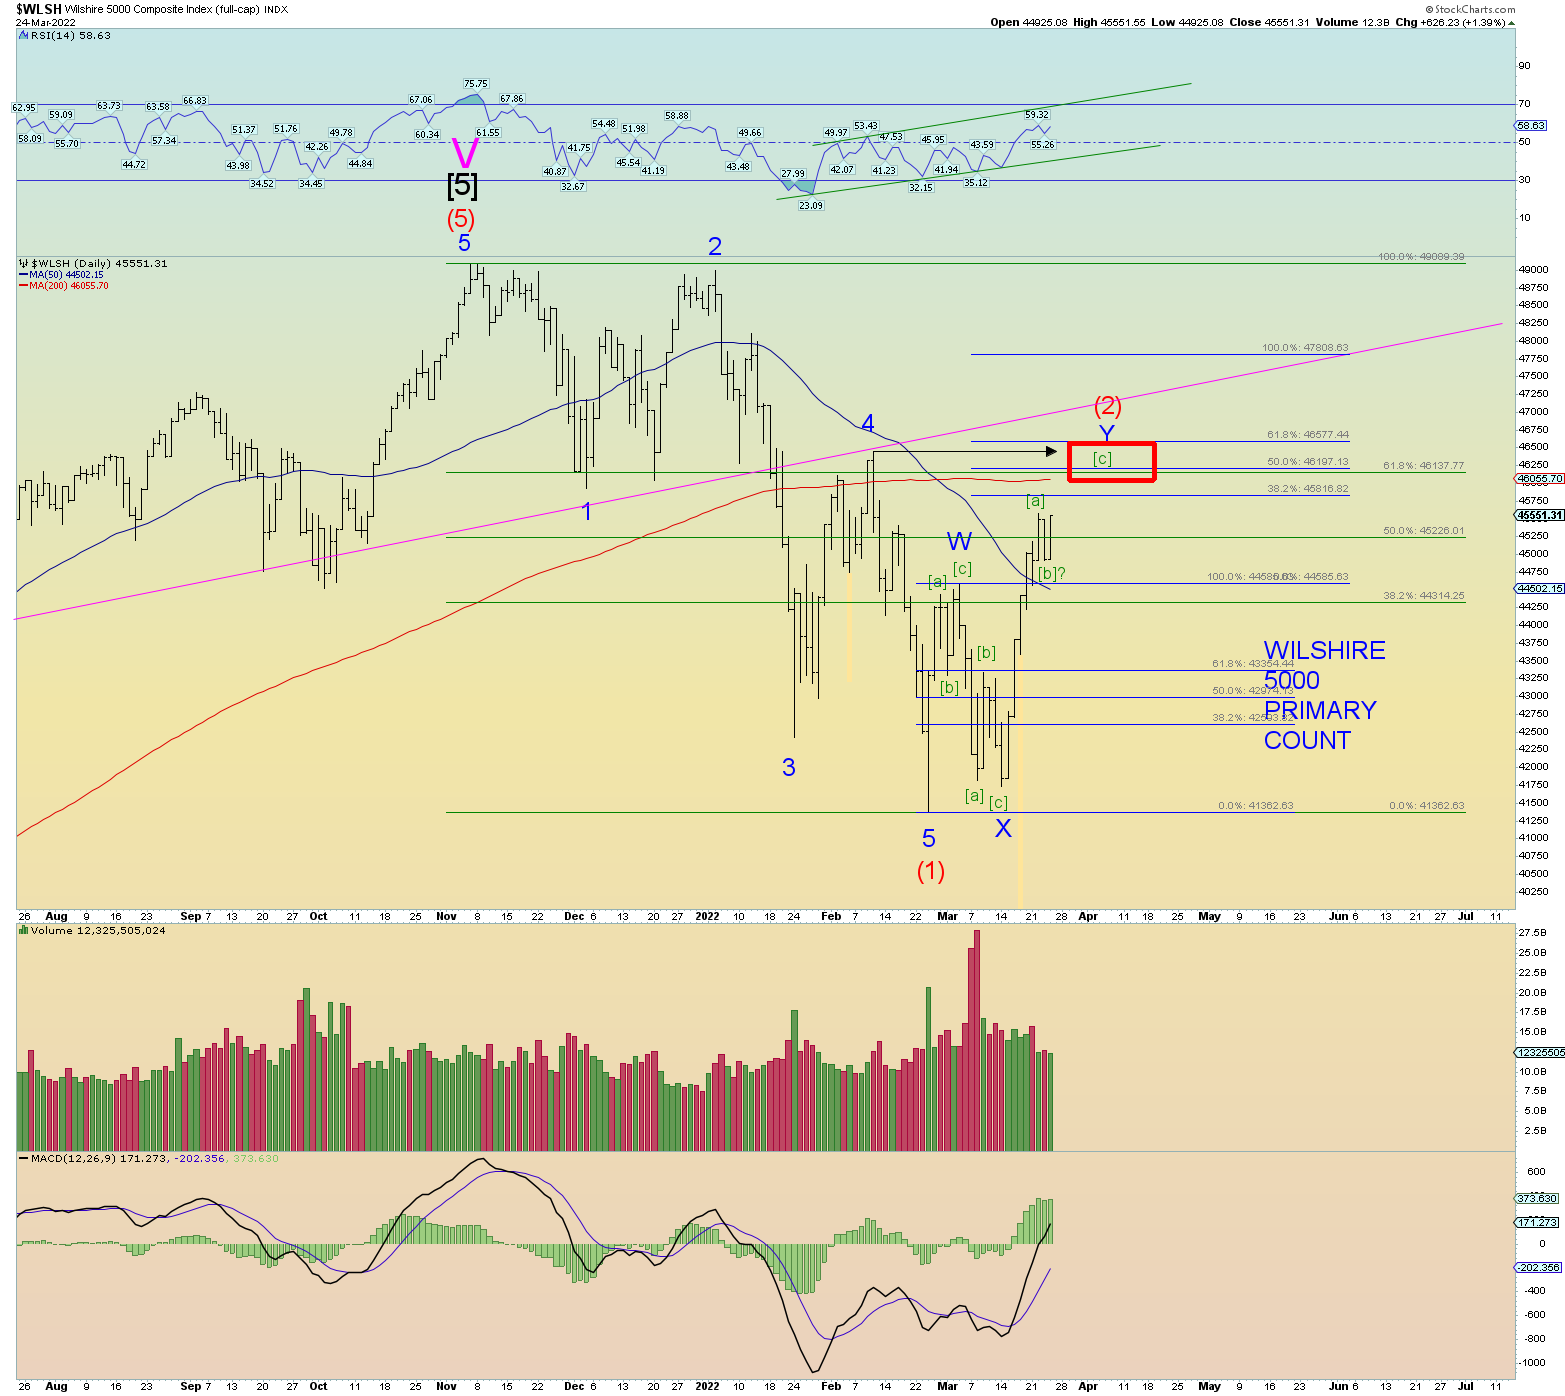
We have a potential stopping zone for wave (2) of the Wilshire 5000. It is an area of lots of convergence. 1) 200 DMA @ 46,000. 2) 61.8% Fibonacci retrace of the entire drop from peak @ 46,140. 3) Wave Y of (2) would be 1.5 x wave W of 2 @ 46,200. 4) Fibonacci sequence #24 is at 46,368. 5) Wave Y of (2) would be 1.618 wave W of (2) @ 46,577. 6) Previous peak of 4 of (1) down is in this range.

So, the target range would be 46,000 – 46,580 thereabouts with the Fib Sequence #24 right in the middle of that range @ precisely 46,368. And then the market should run out of steam. My wave (2) target topping date is April 6th after the quarter is over and the subsequent rebalancing.

Ideally wave (2) would peak on great news (as if there has been any as of late.) A “ceasefire” (which I would judge as a temporary or false ceasefire) would fit the definition. If there is a true ceasefire, sell that news hard.

I attempted a squiggly chart. There is a misprint on the Wilshire stockcharts I try and cover it up. The retrace pattern of wave (2) appears to be a double zigzag which we would label W-X-Y in place of A-B-C. This would be typical as one zigzag was not enough in price or time. Therefore, the pattern repeats and the second zigzag is behaving as a third wave would with strength. But eventually that strength dies out in wave [c] of Y.

Elliott Wave Update ~ 21 Mar 2022

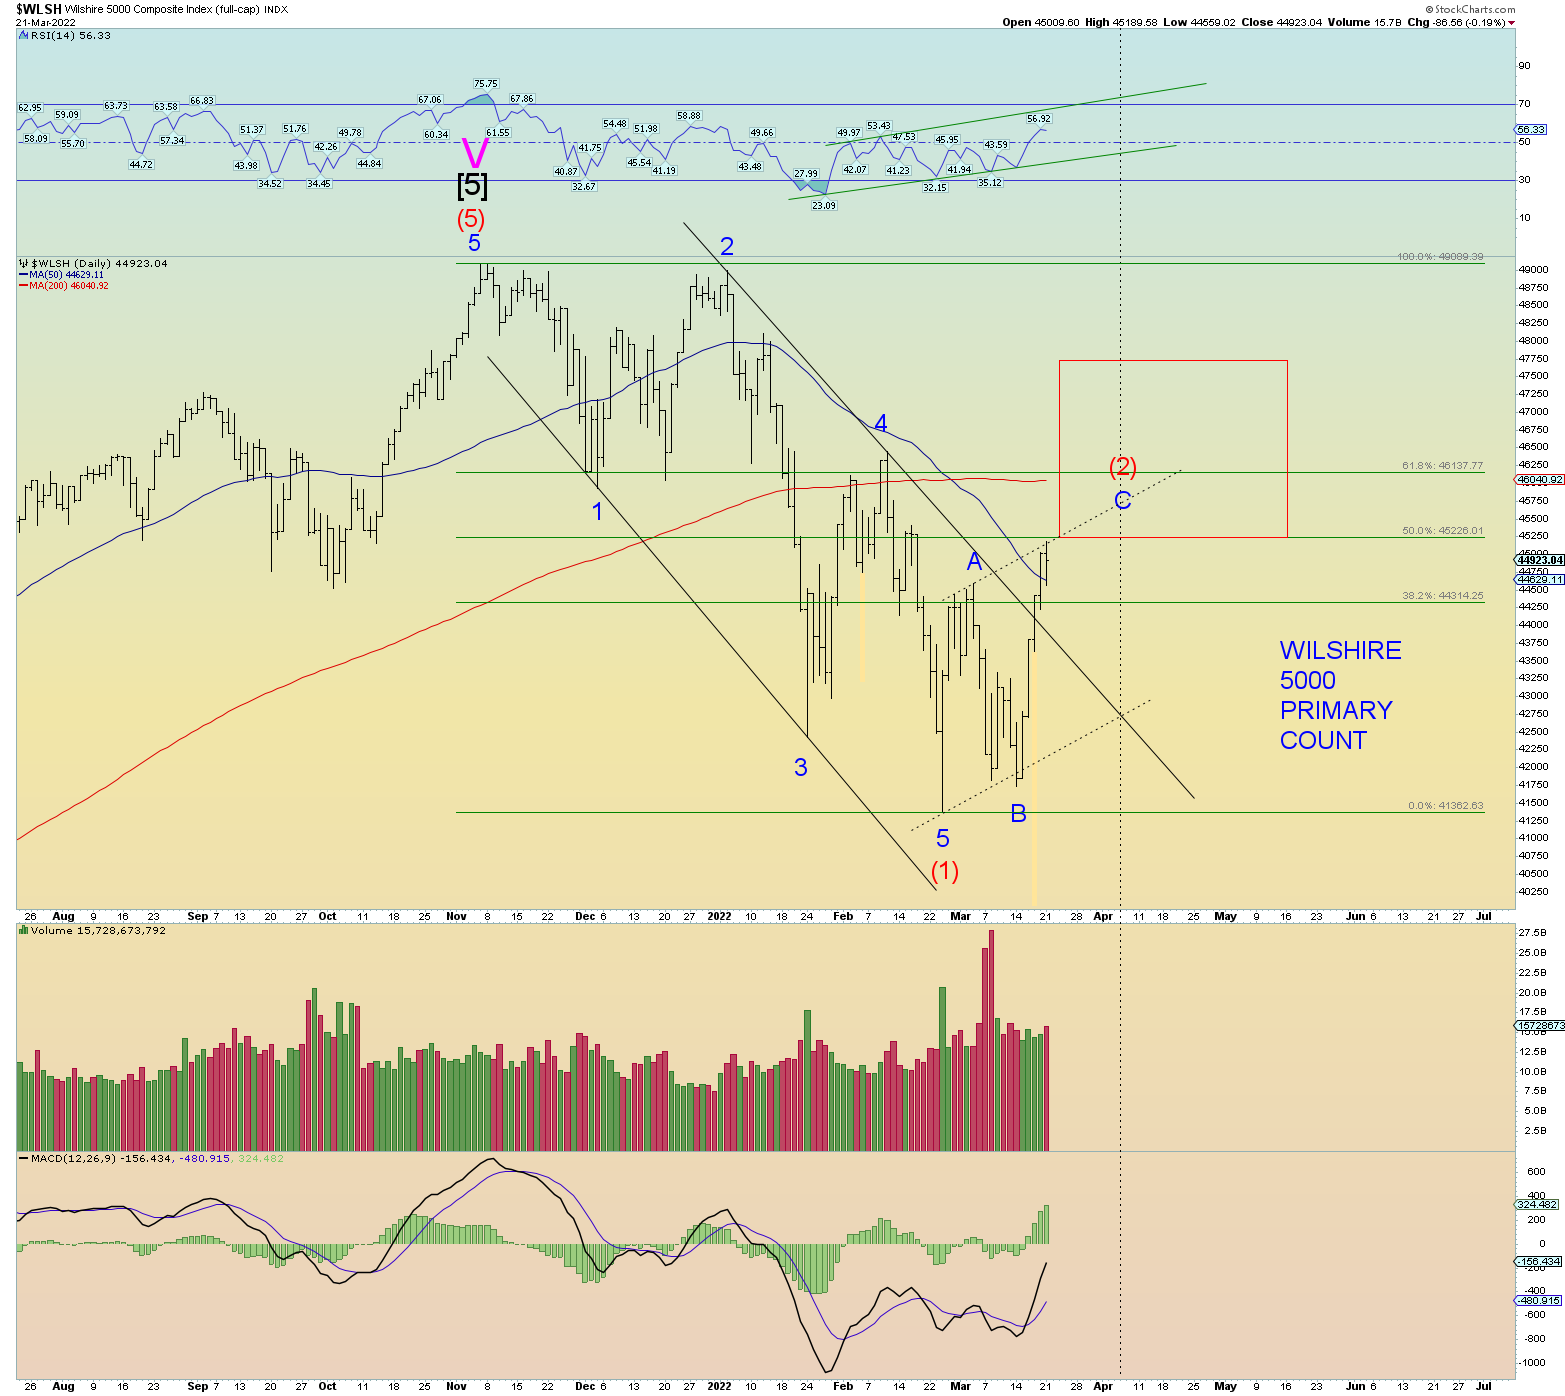
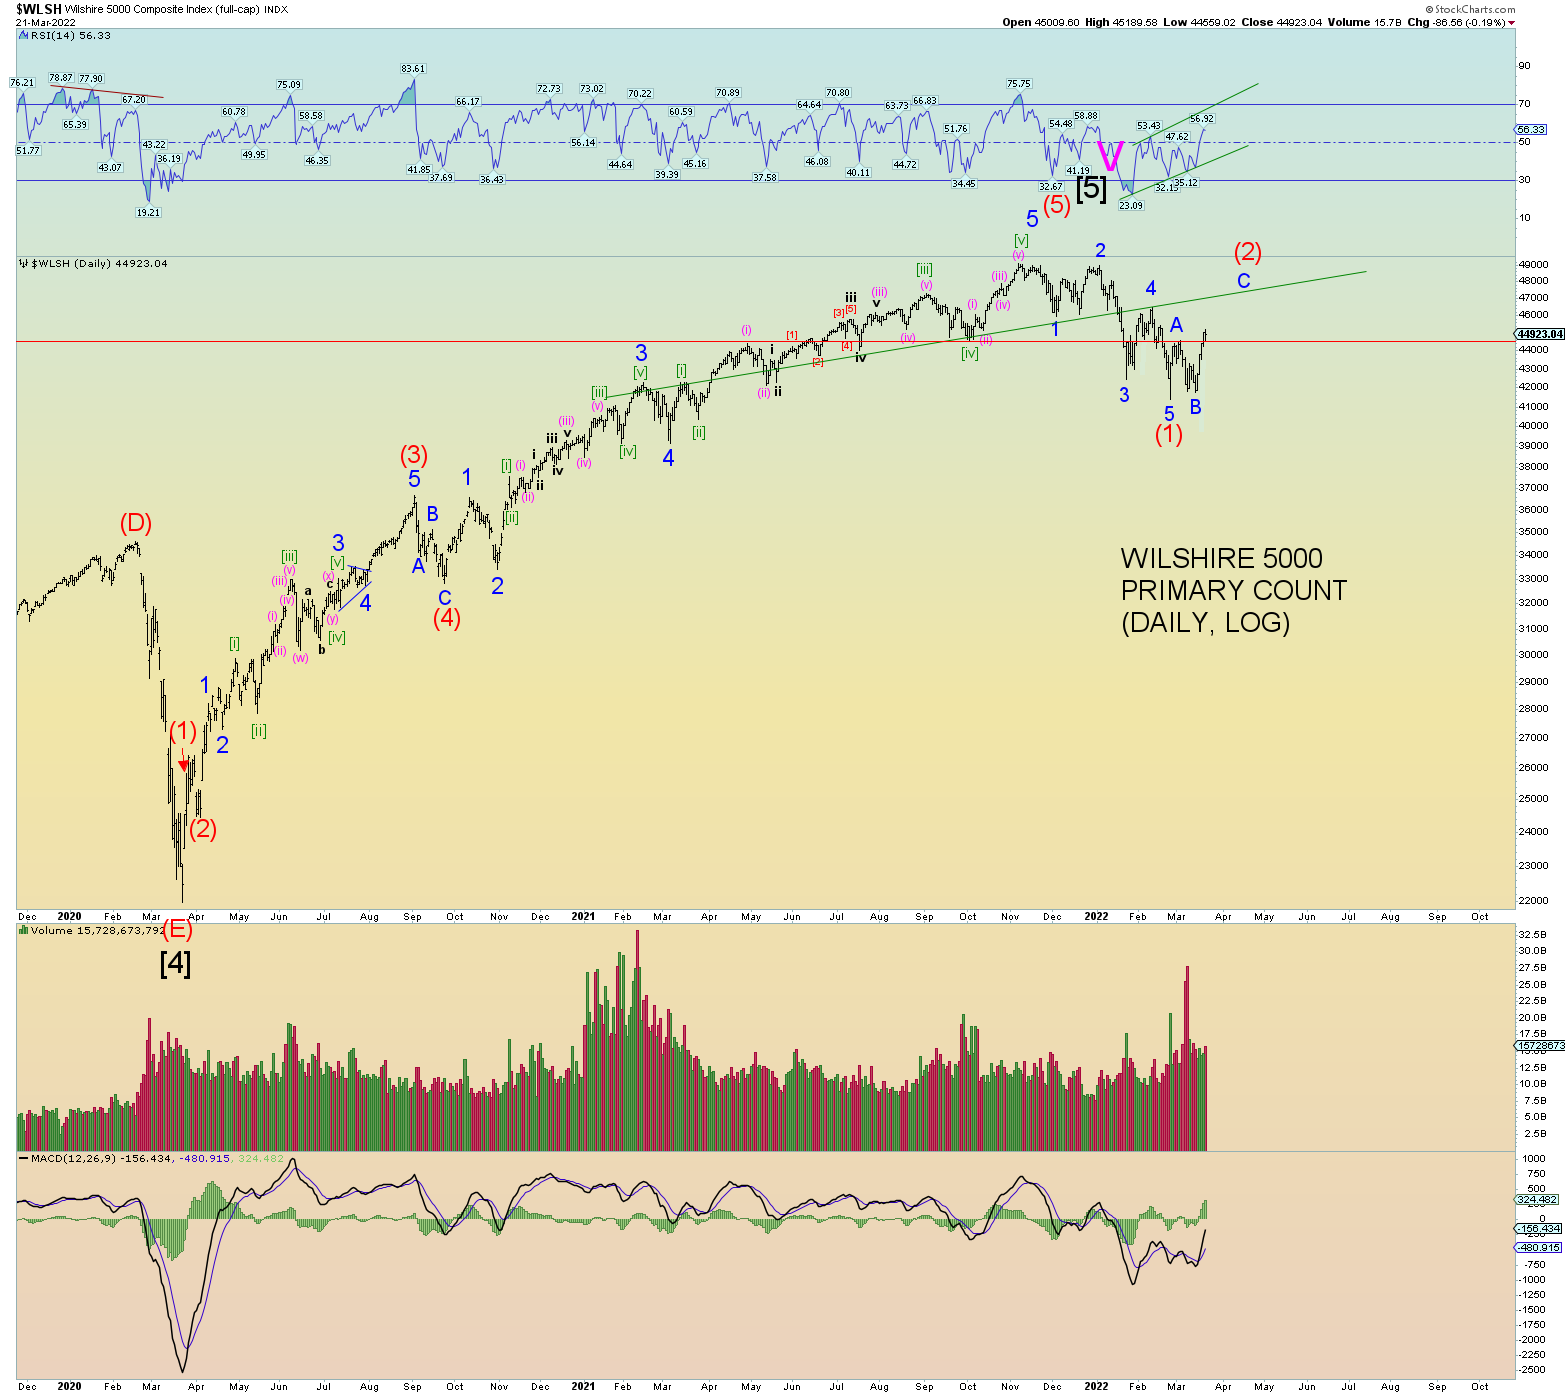
The preferred count:

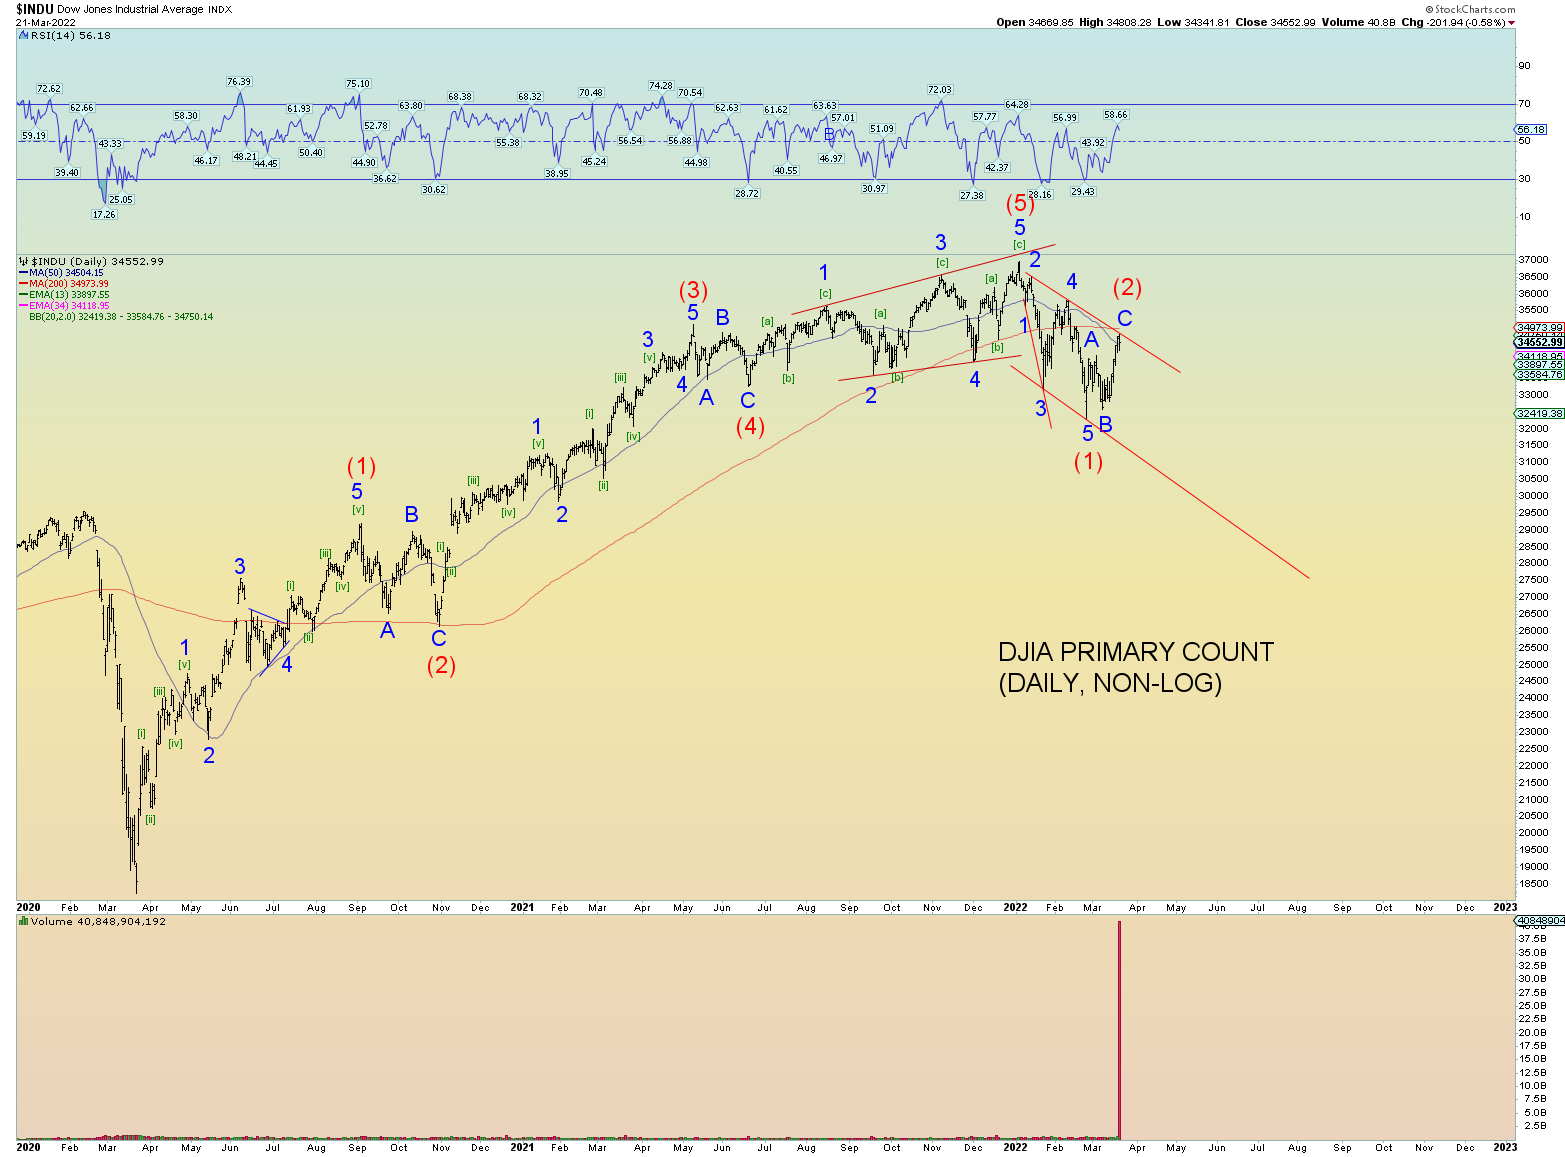
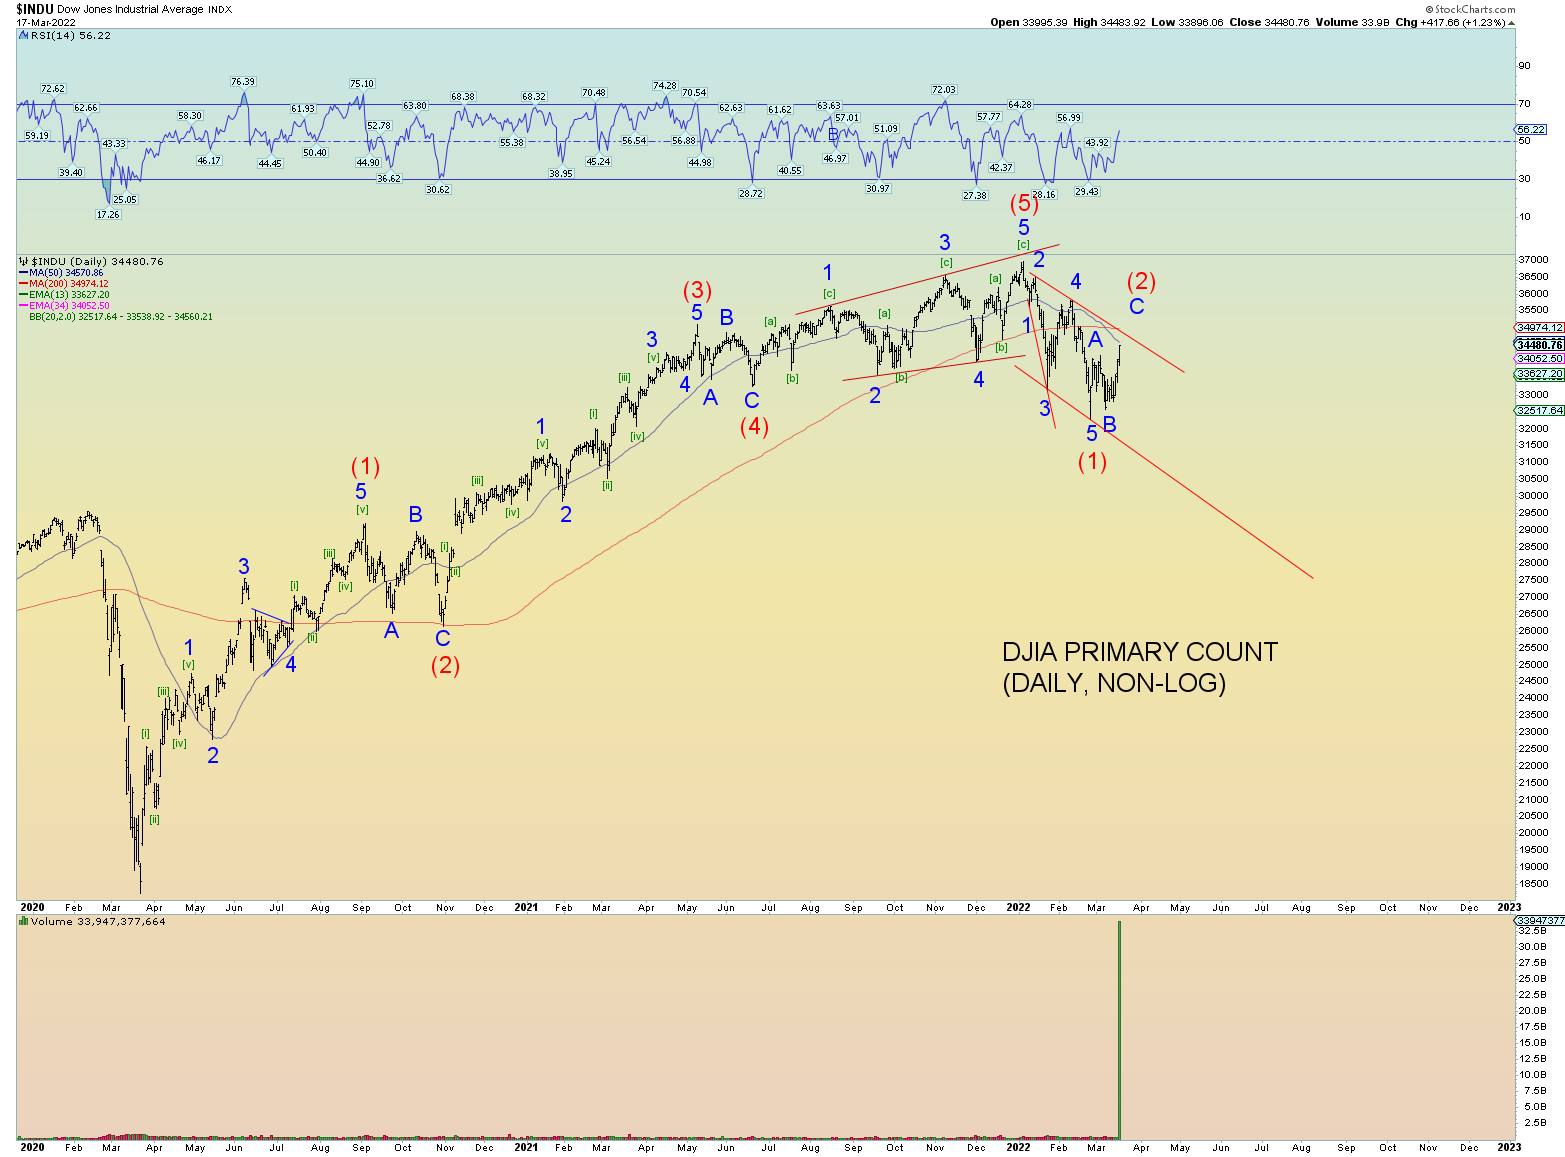
The DJIA back at the trendline.

Back all the way to the broken upper channel line/neckline?

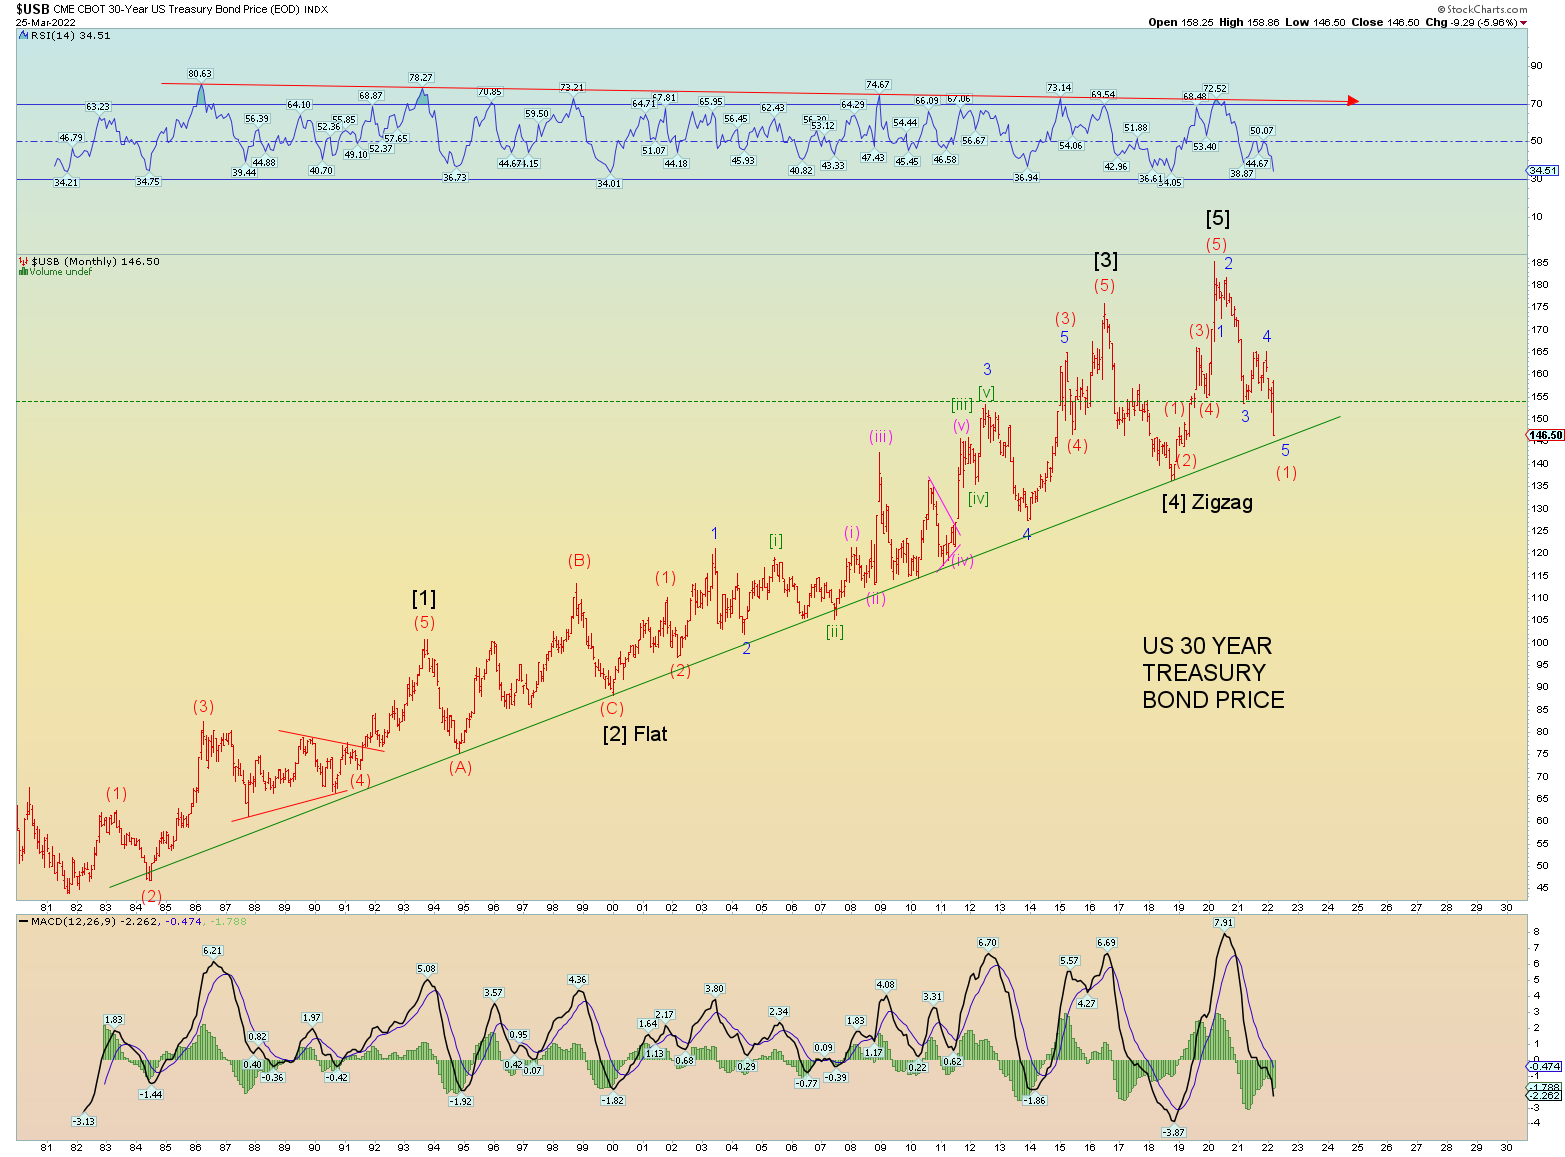
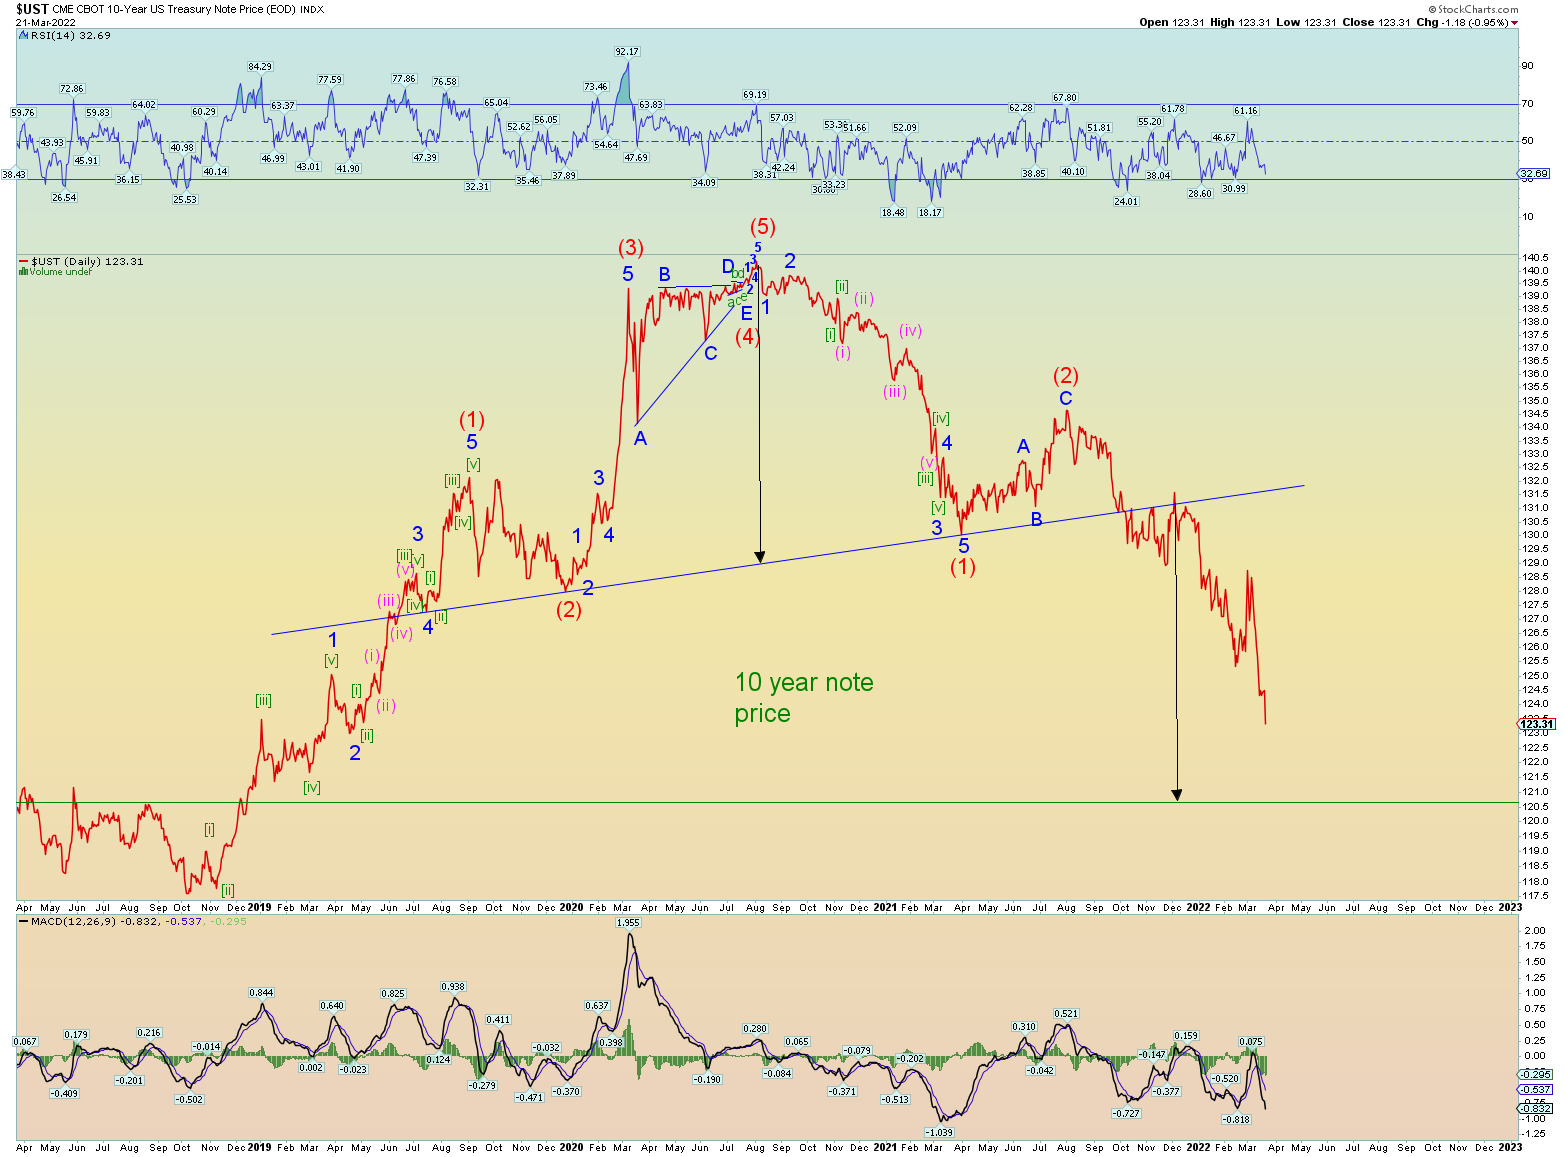
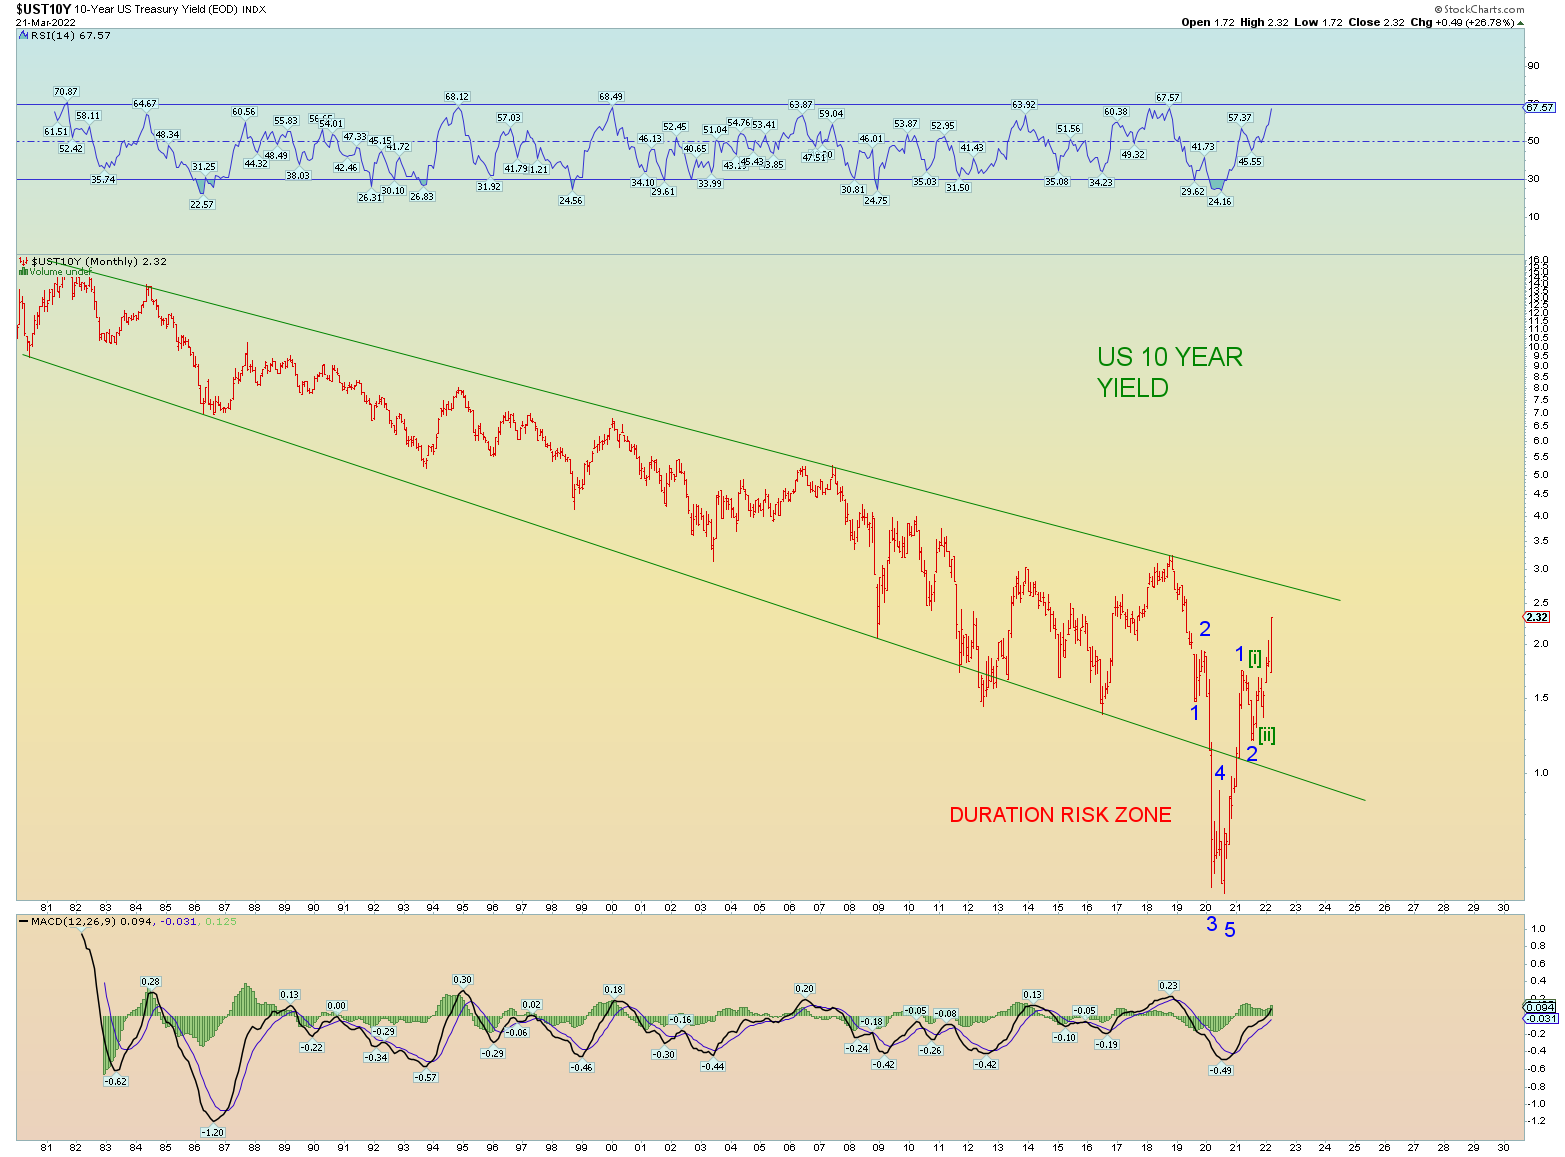
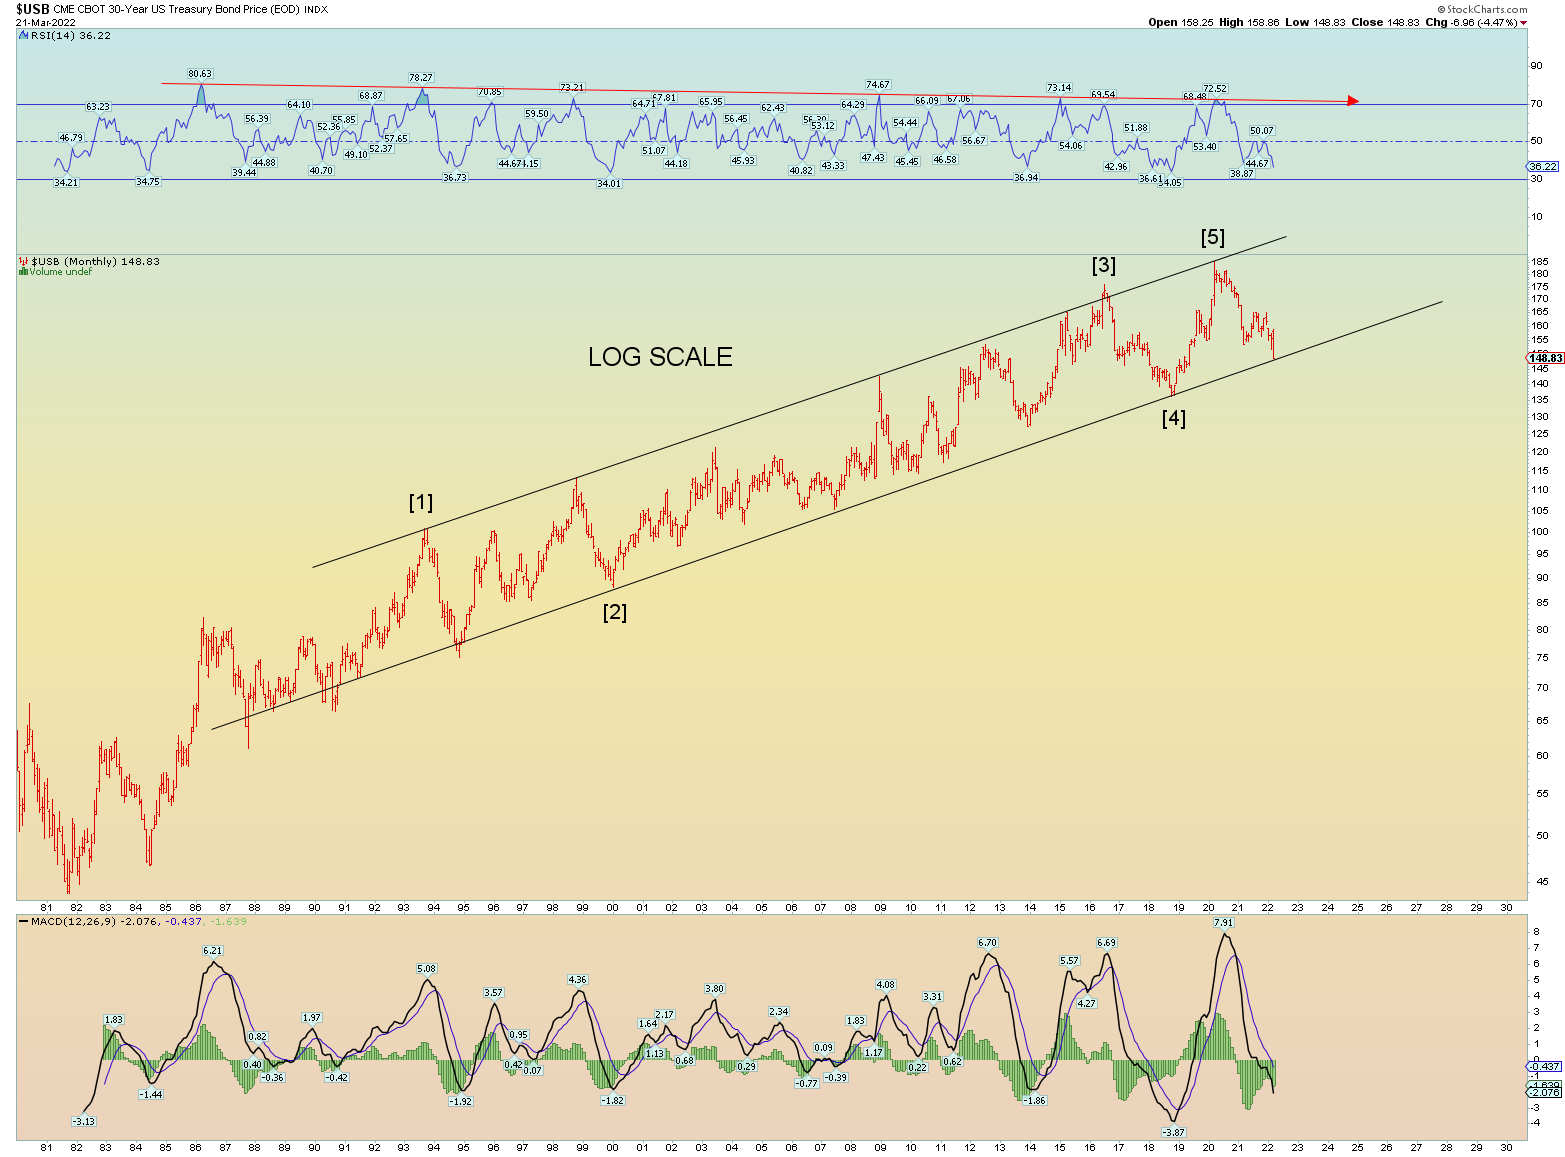
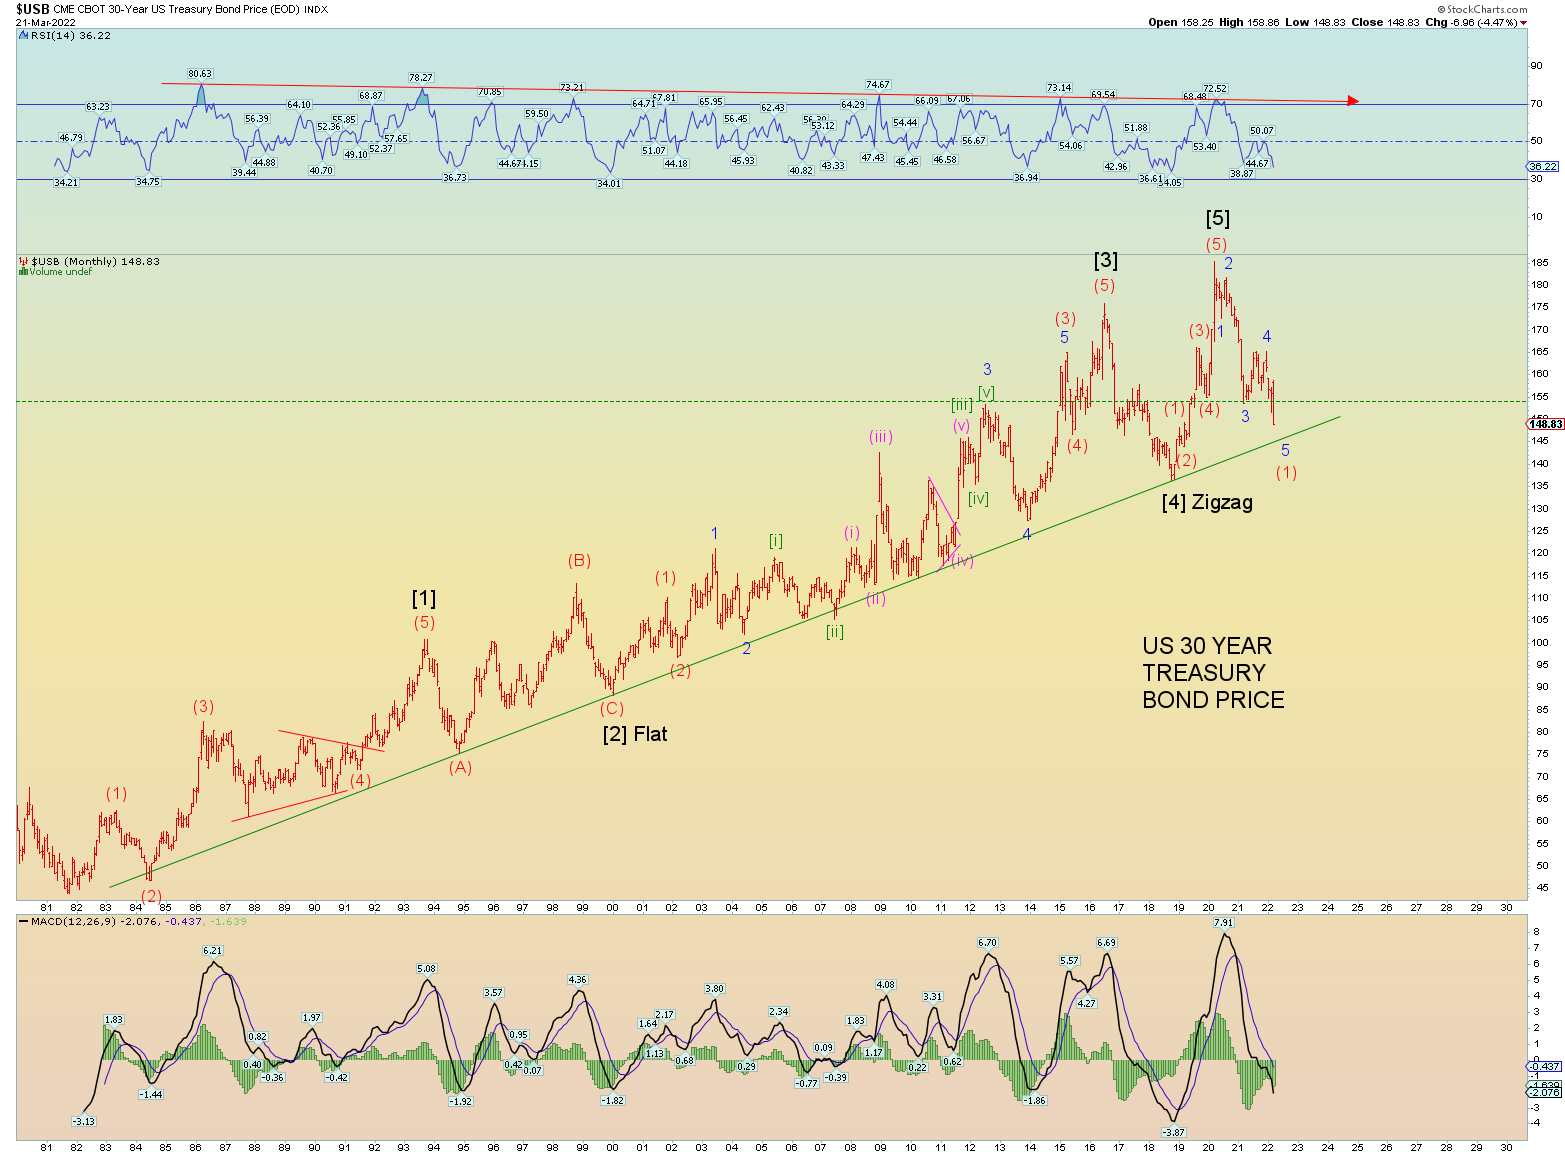
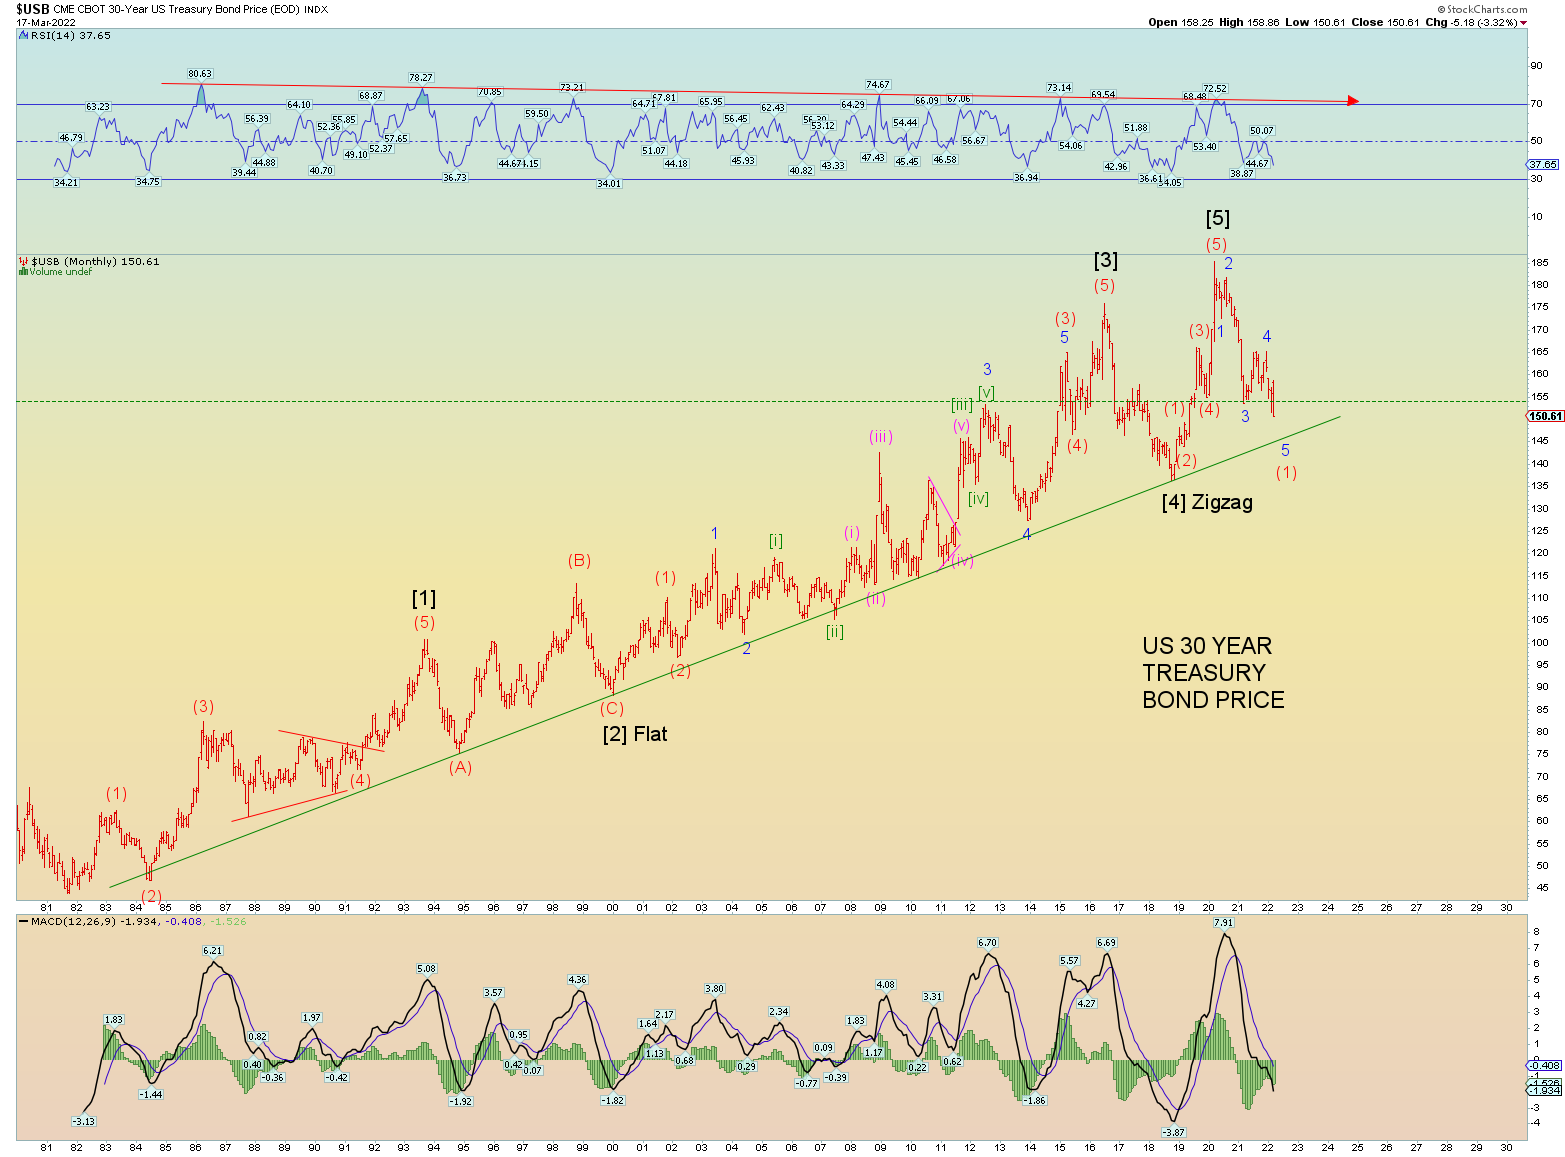
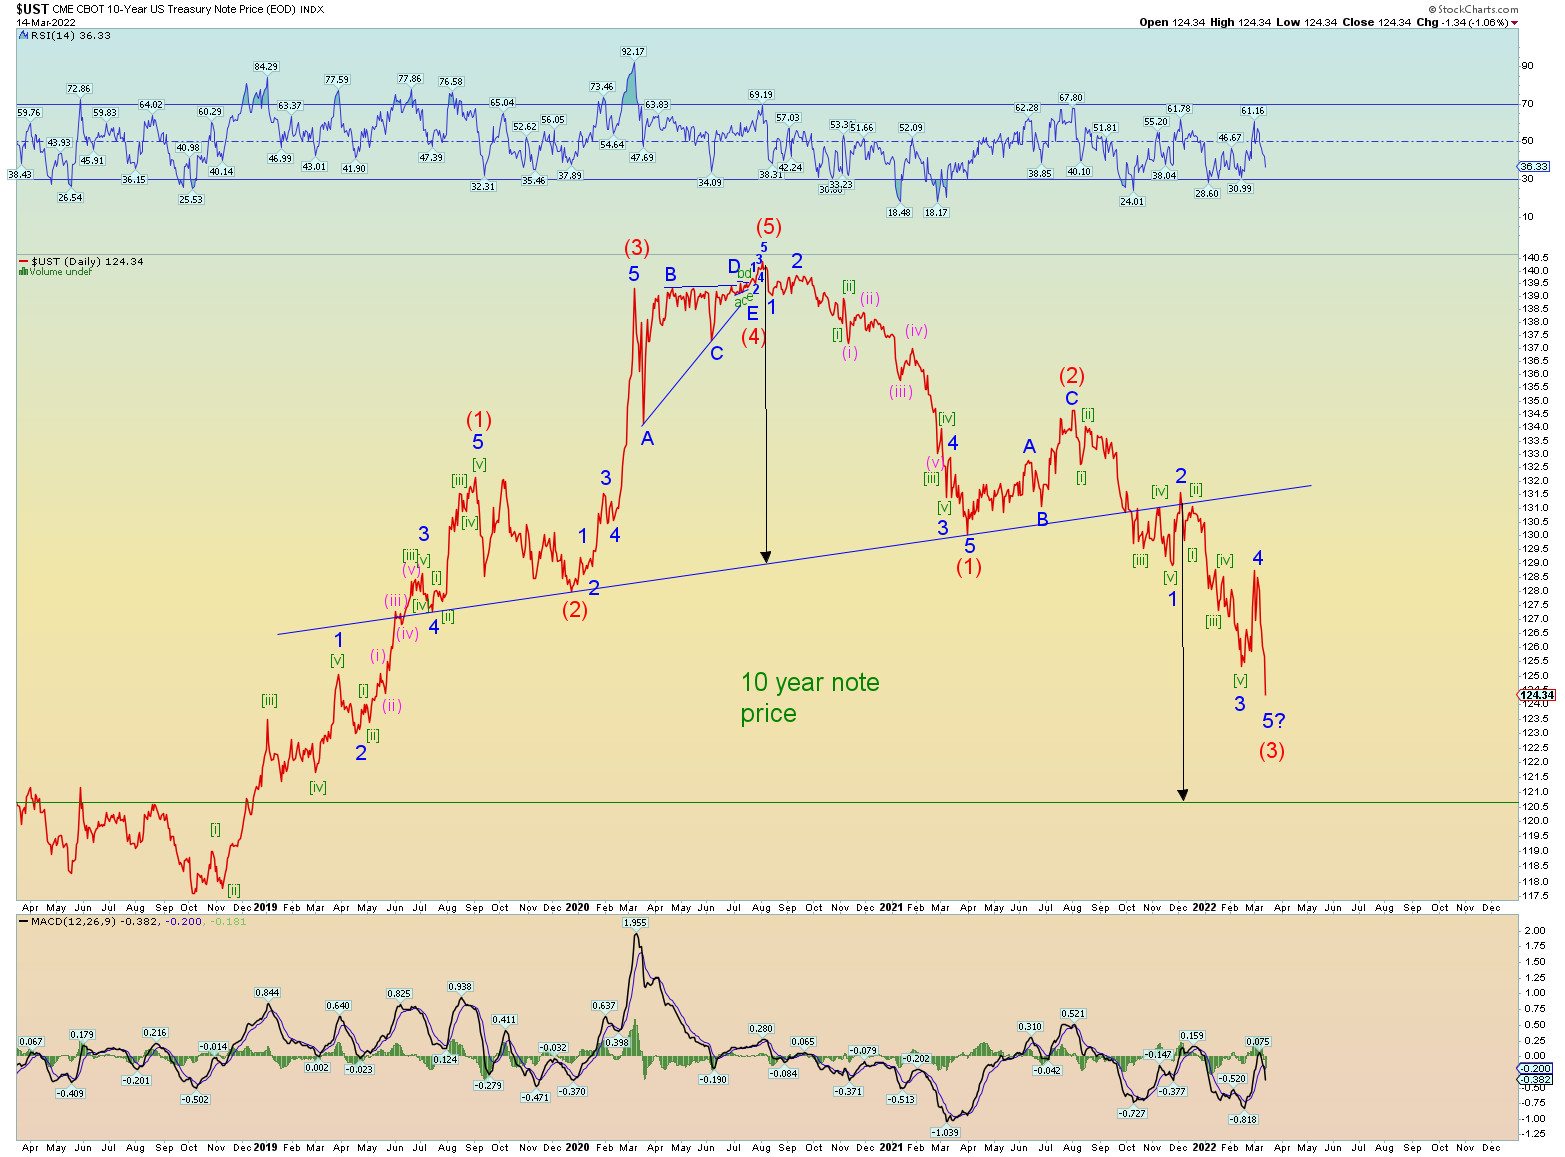
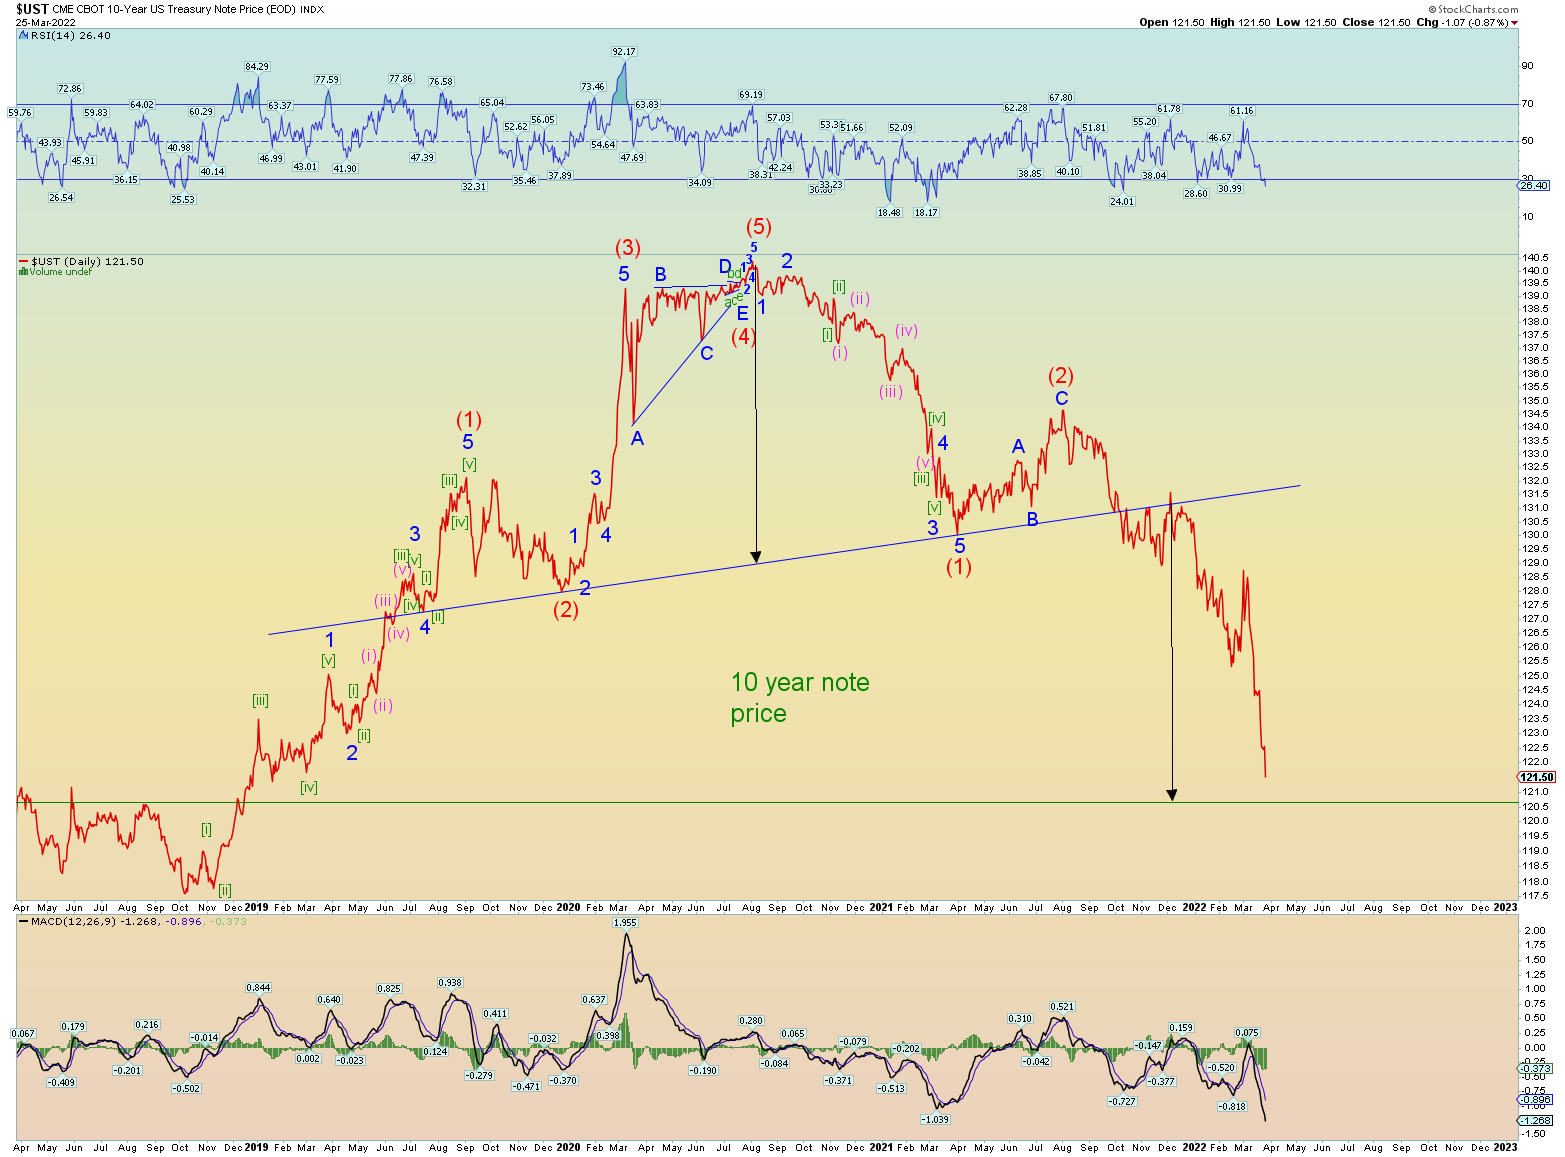
Bonds. Reaching for the head and shoulders target price.

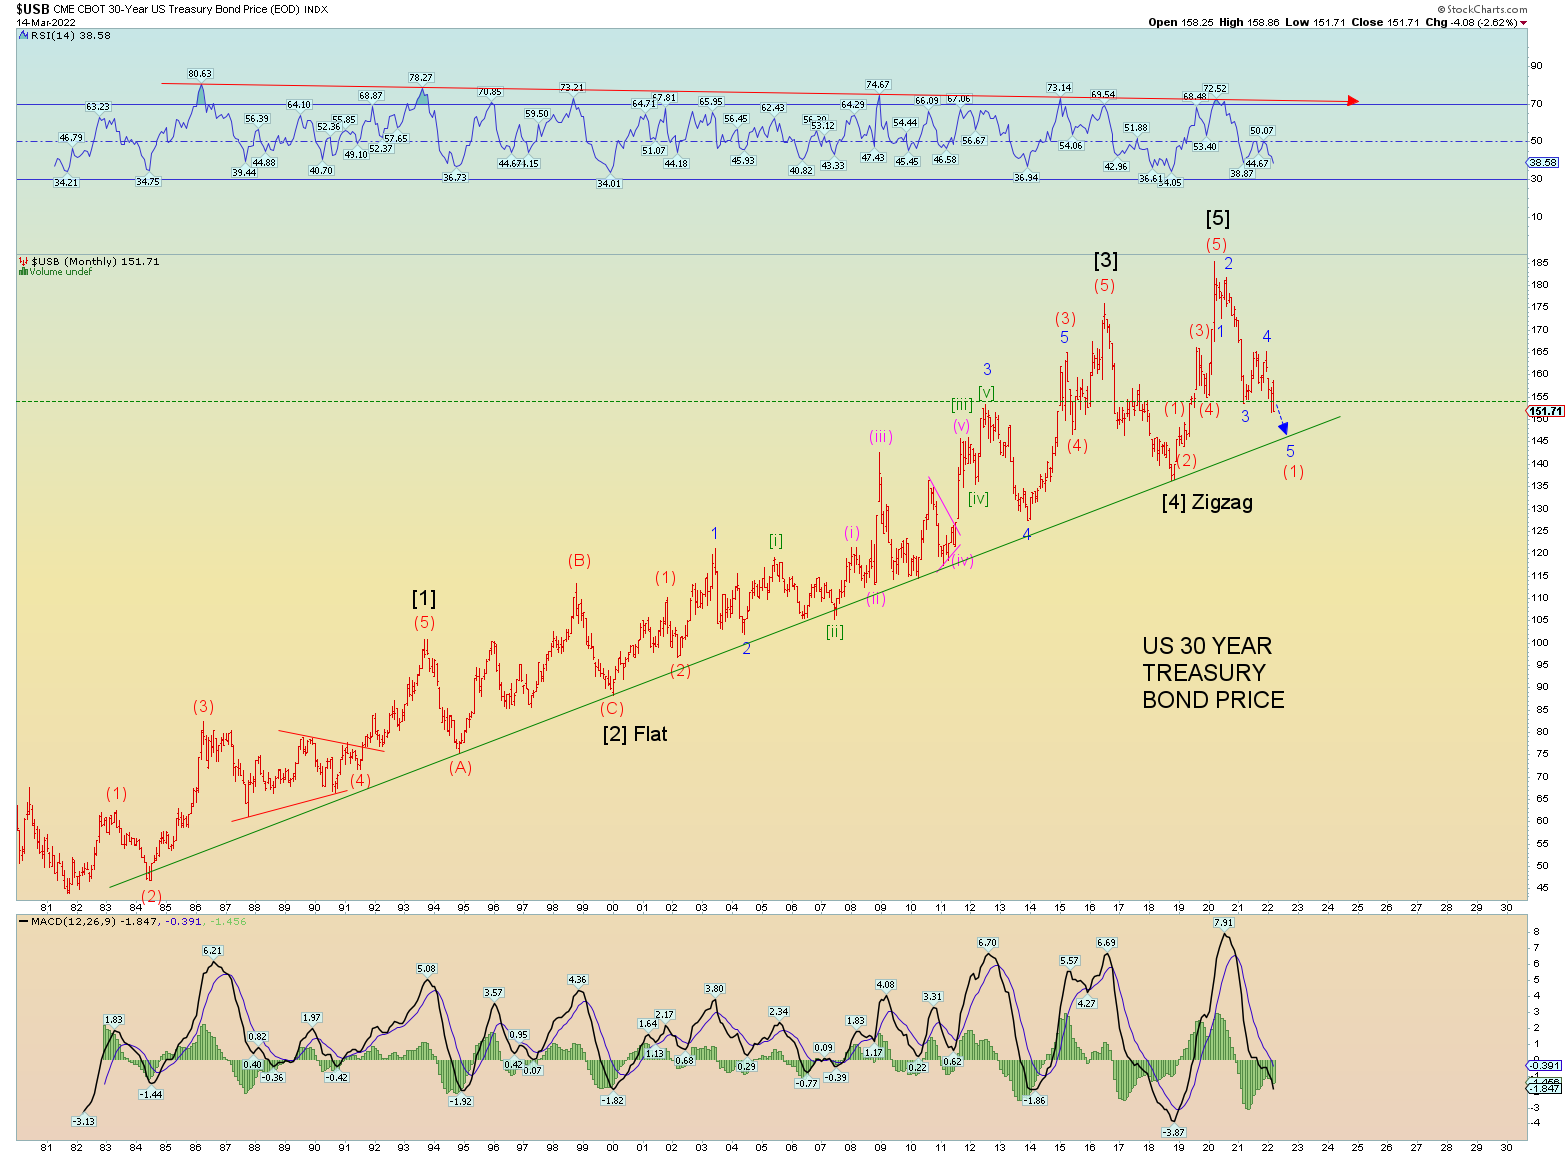
30-year bond price in log scale.

And in arithmetic scale.

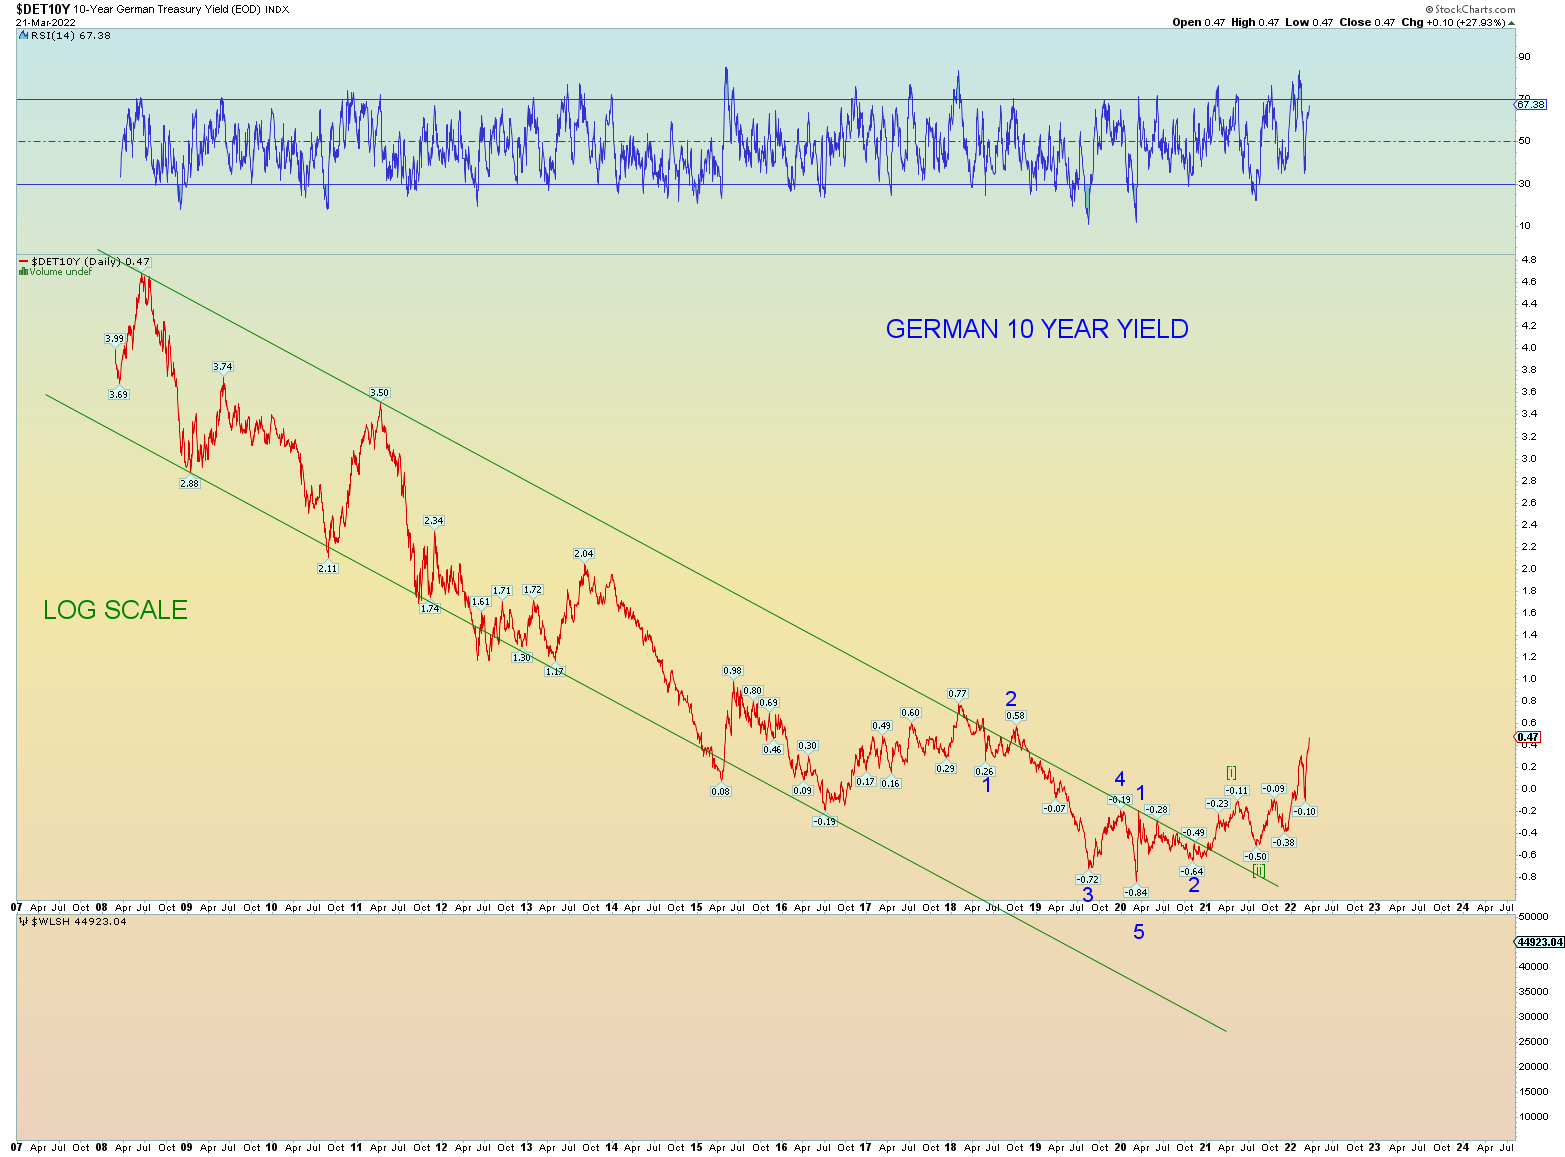
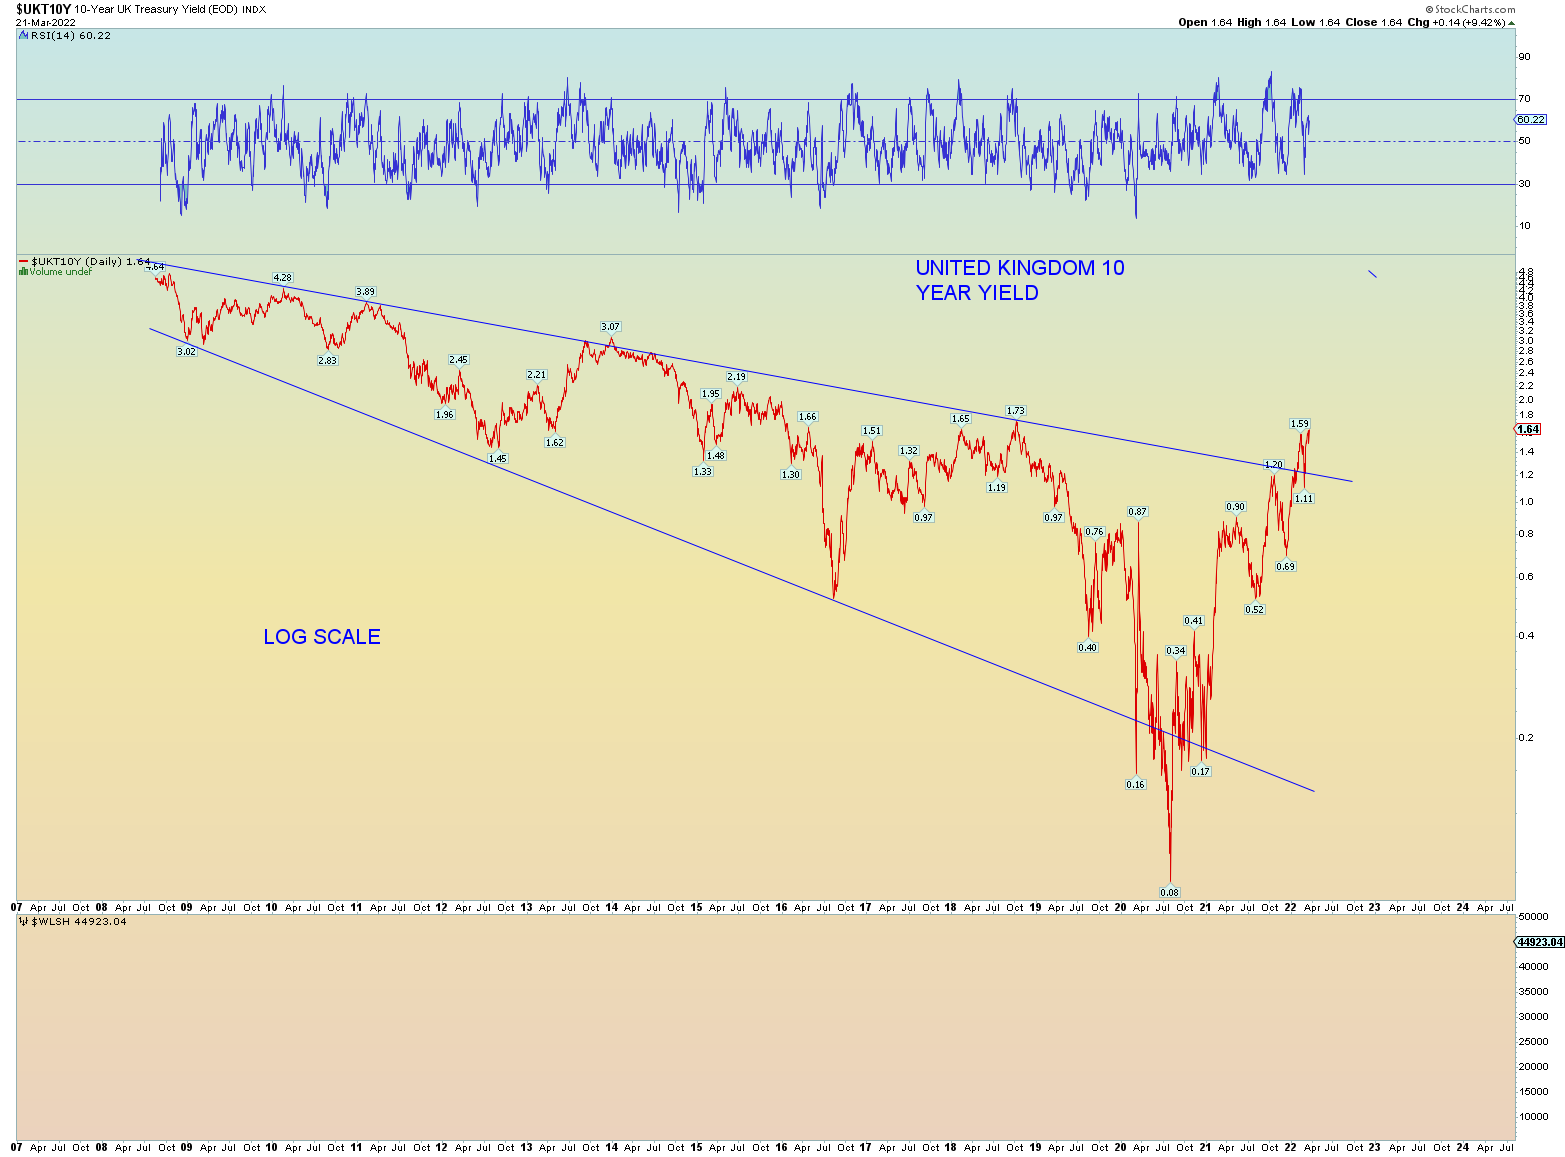
Germany. On the verge of massive impulse higher? I don’t see why not.

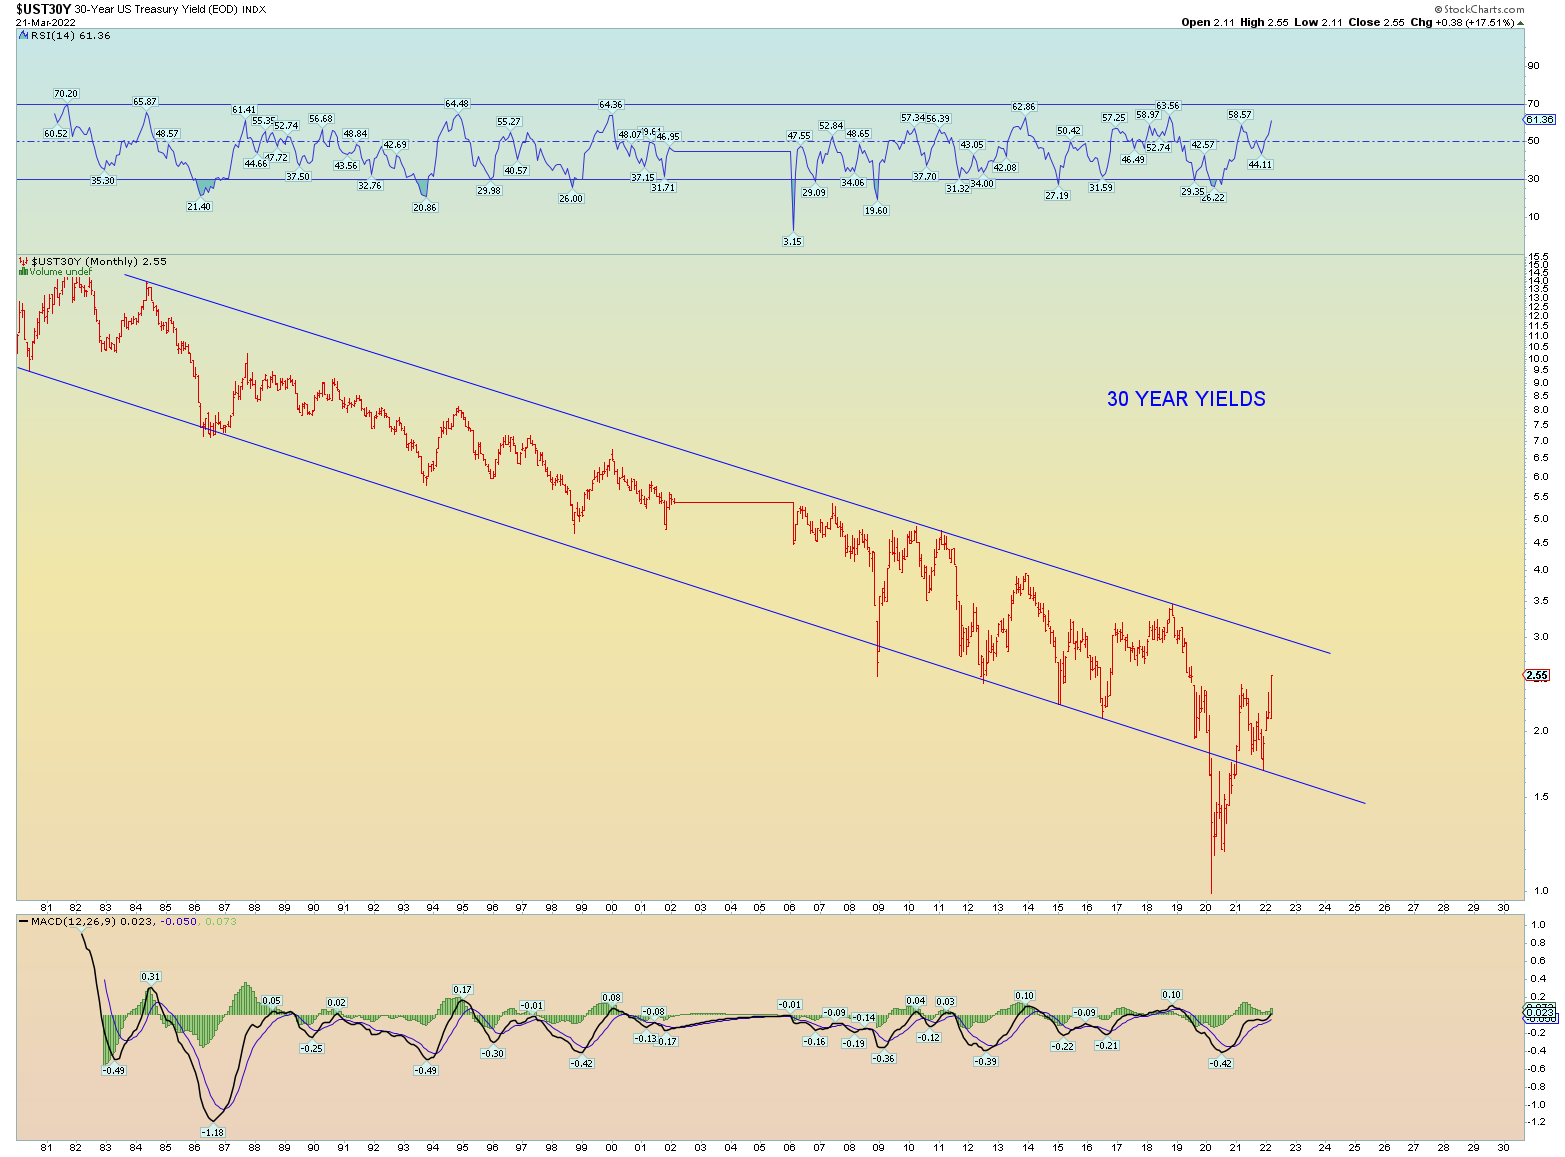
Fed emergency rate hike coming of another 1/4 point? Things are getting out of hand with both the 3 and 6 month yields.

LOL. I’m sure the market will take it all in stride….

Elliott Wave Update ~ 17 Mar 2022

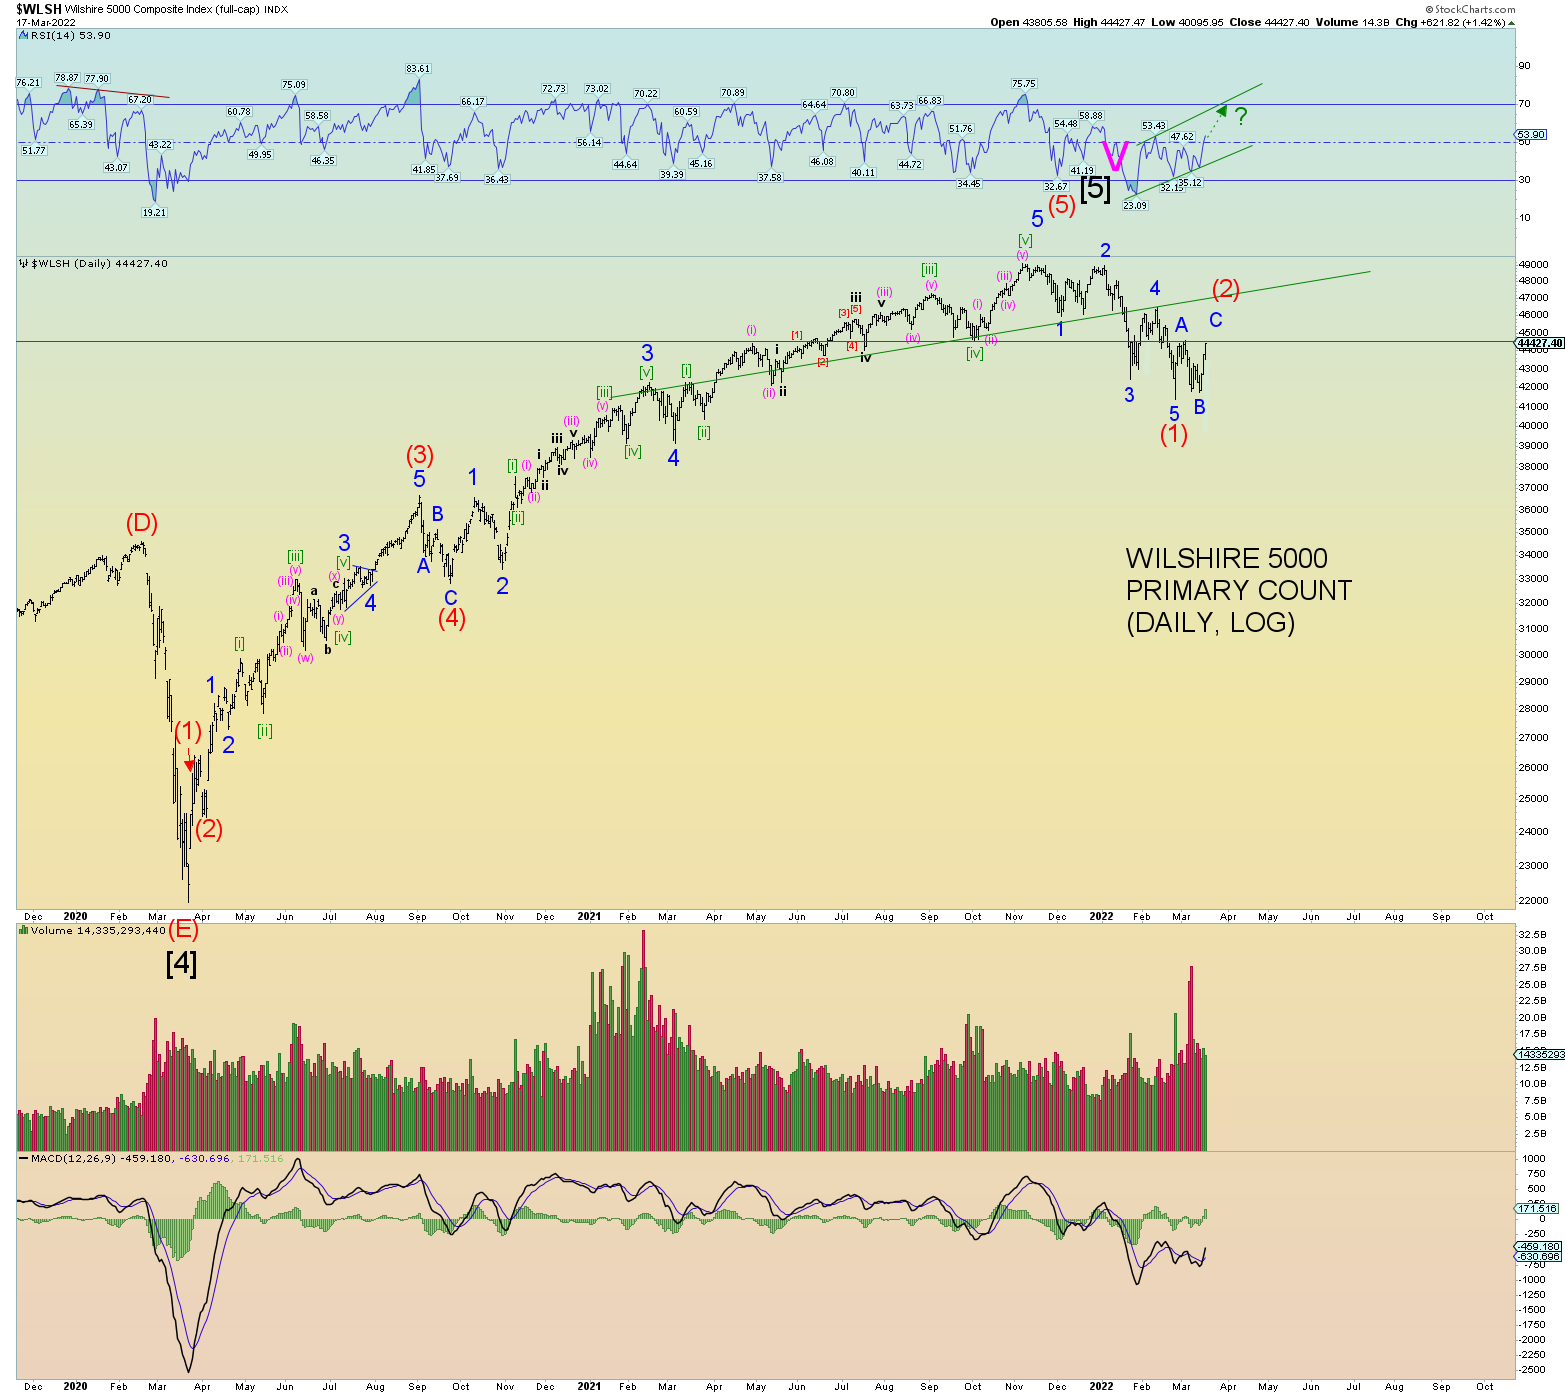
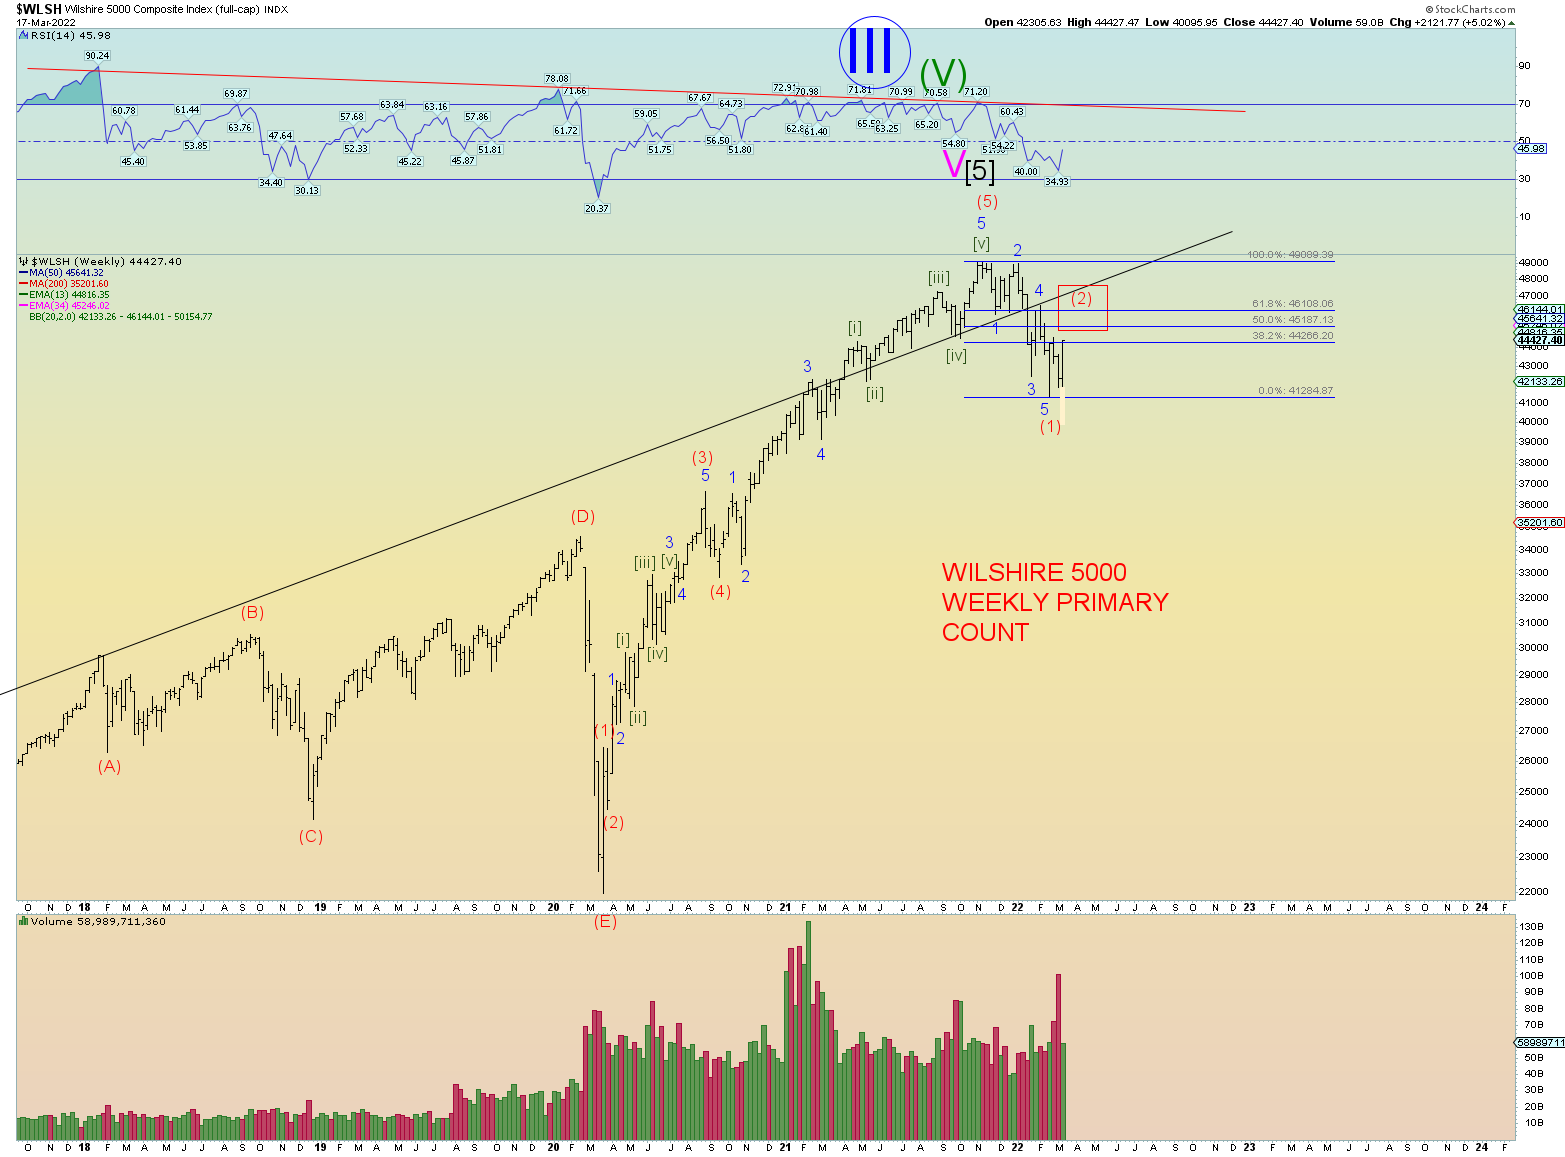
The Wilshire 5000 still has not violated the “lower highs” view of things although it is close. Regardless, it’s probably best that one views the current price action since Feb 24th low as an Intermediate wave (2) corrective up. The positive diverging RSI has now finished higher, and the price closing high of the Wilshire is the best since February 16th. This all points to probably wave (2) and we should keep things simple. The retrace has cleared the 38.2 % Fib and closed at about 40% retrace in total so far.

Wave (1) took 75 trading days; one could expect wave (2) to take between 30 – 40 trading days to resolve itself. Today was trading day 17 since the 24th of Feb low. However, it is not the case on the DJIA or SPX because their highs occurred in early January. Therefore, ideally wave (2) would be resolved at about 30 day’s trading which would be about April 6th. And wave (2) peak would ideally occur on “good news”. Bad news marked the low, good news should mark the high of (2).

Prices are back at major horizontal resistance. If this resistance can be cleared, prices can retrace perhaps to the upper multi-year channel line (also the head and shoulders neckline) which would be quite deep. In other words, at about or just above Minor 4 of (1).

46,368 is Fibonacci sequence #24 would be ideal for a stopping point for (2) if prices can clear near term resistance.

Elliott Wave Update ~ 16 Mar 2022

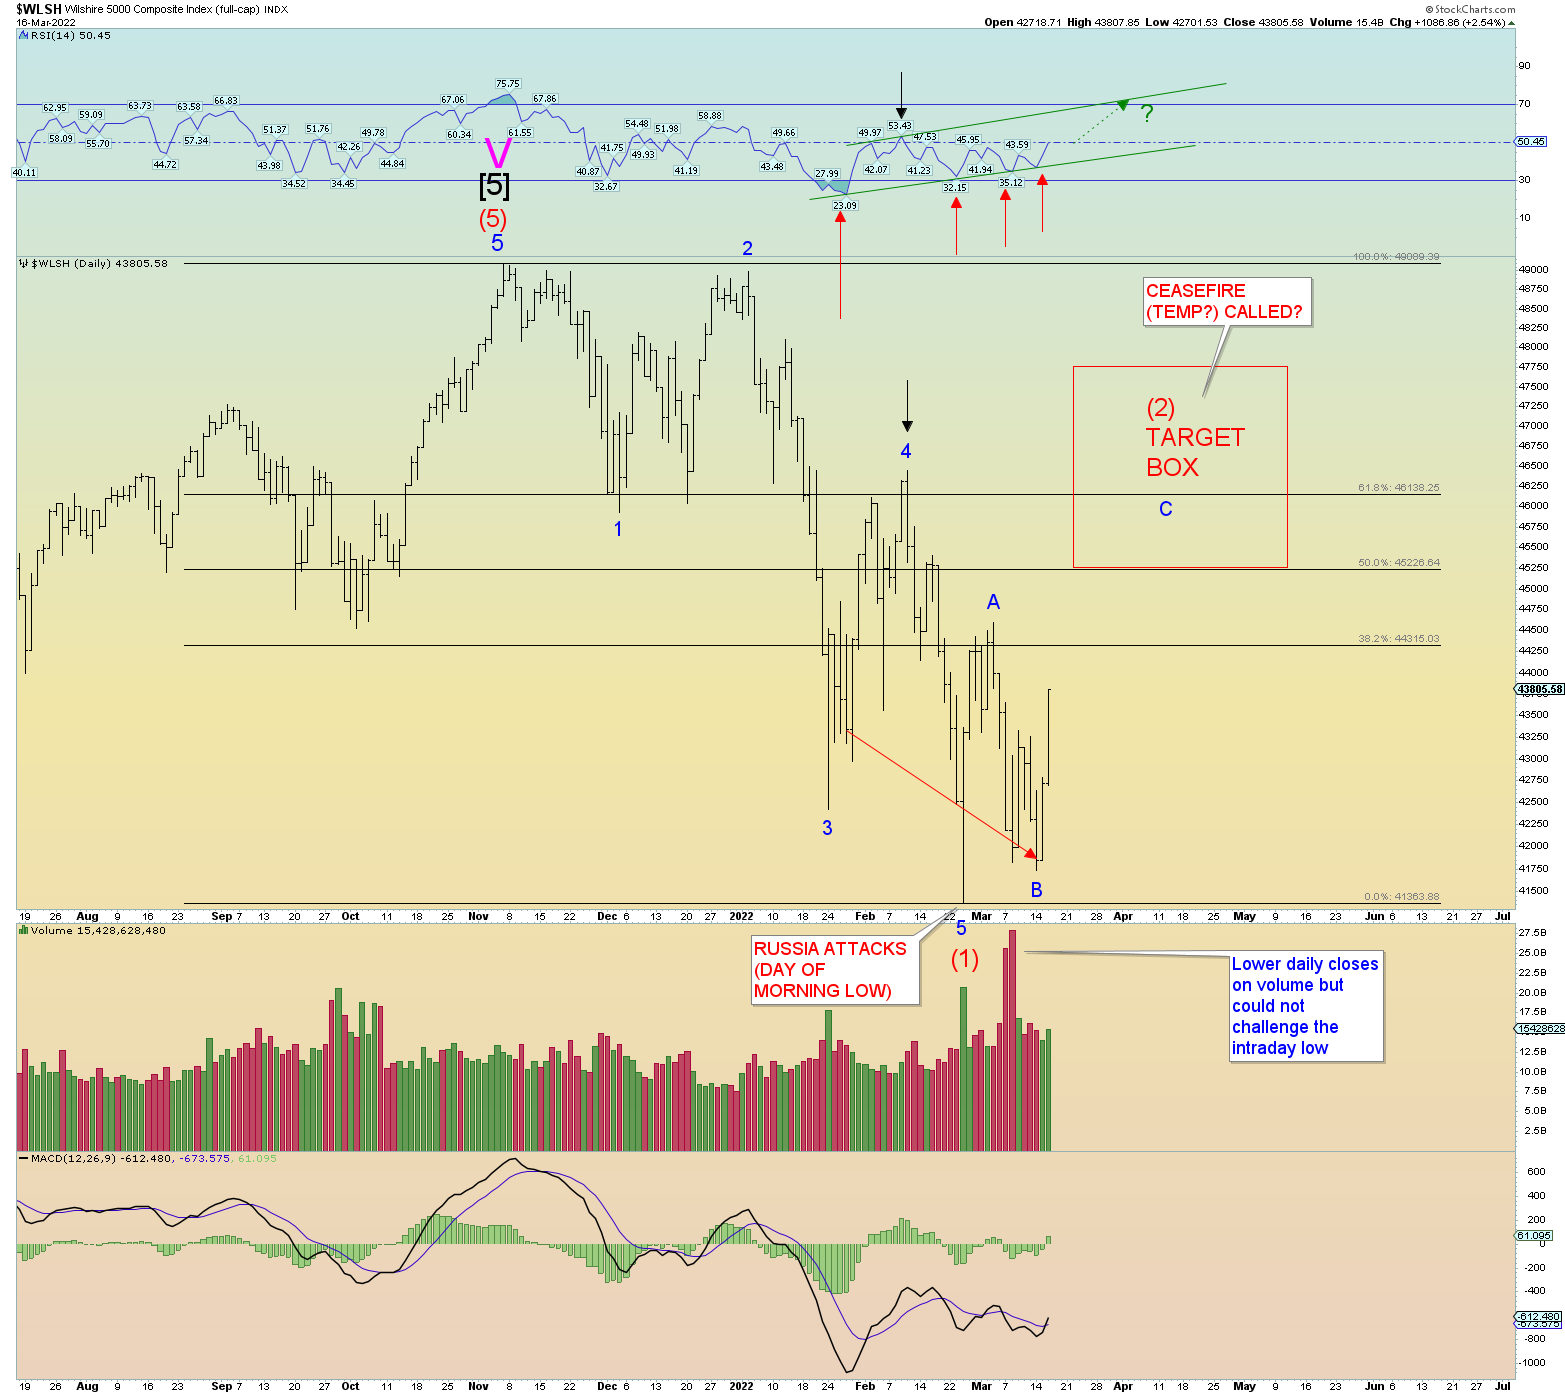
Let’s talk price action, technicals, and other market stuff. Back on the day Russia invaded Ukraine, my market commentary was simple. I stated the following:

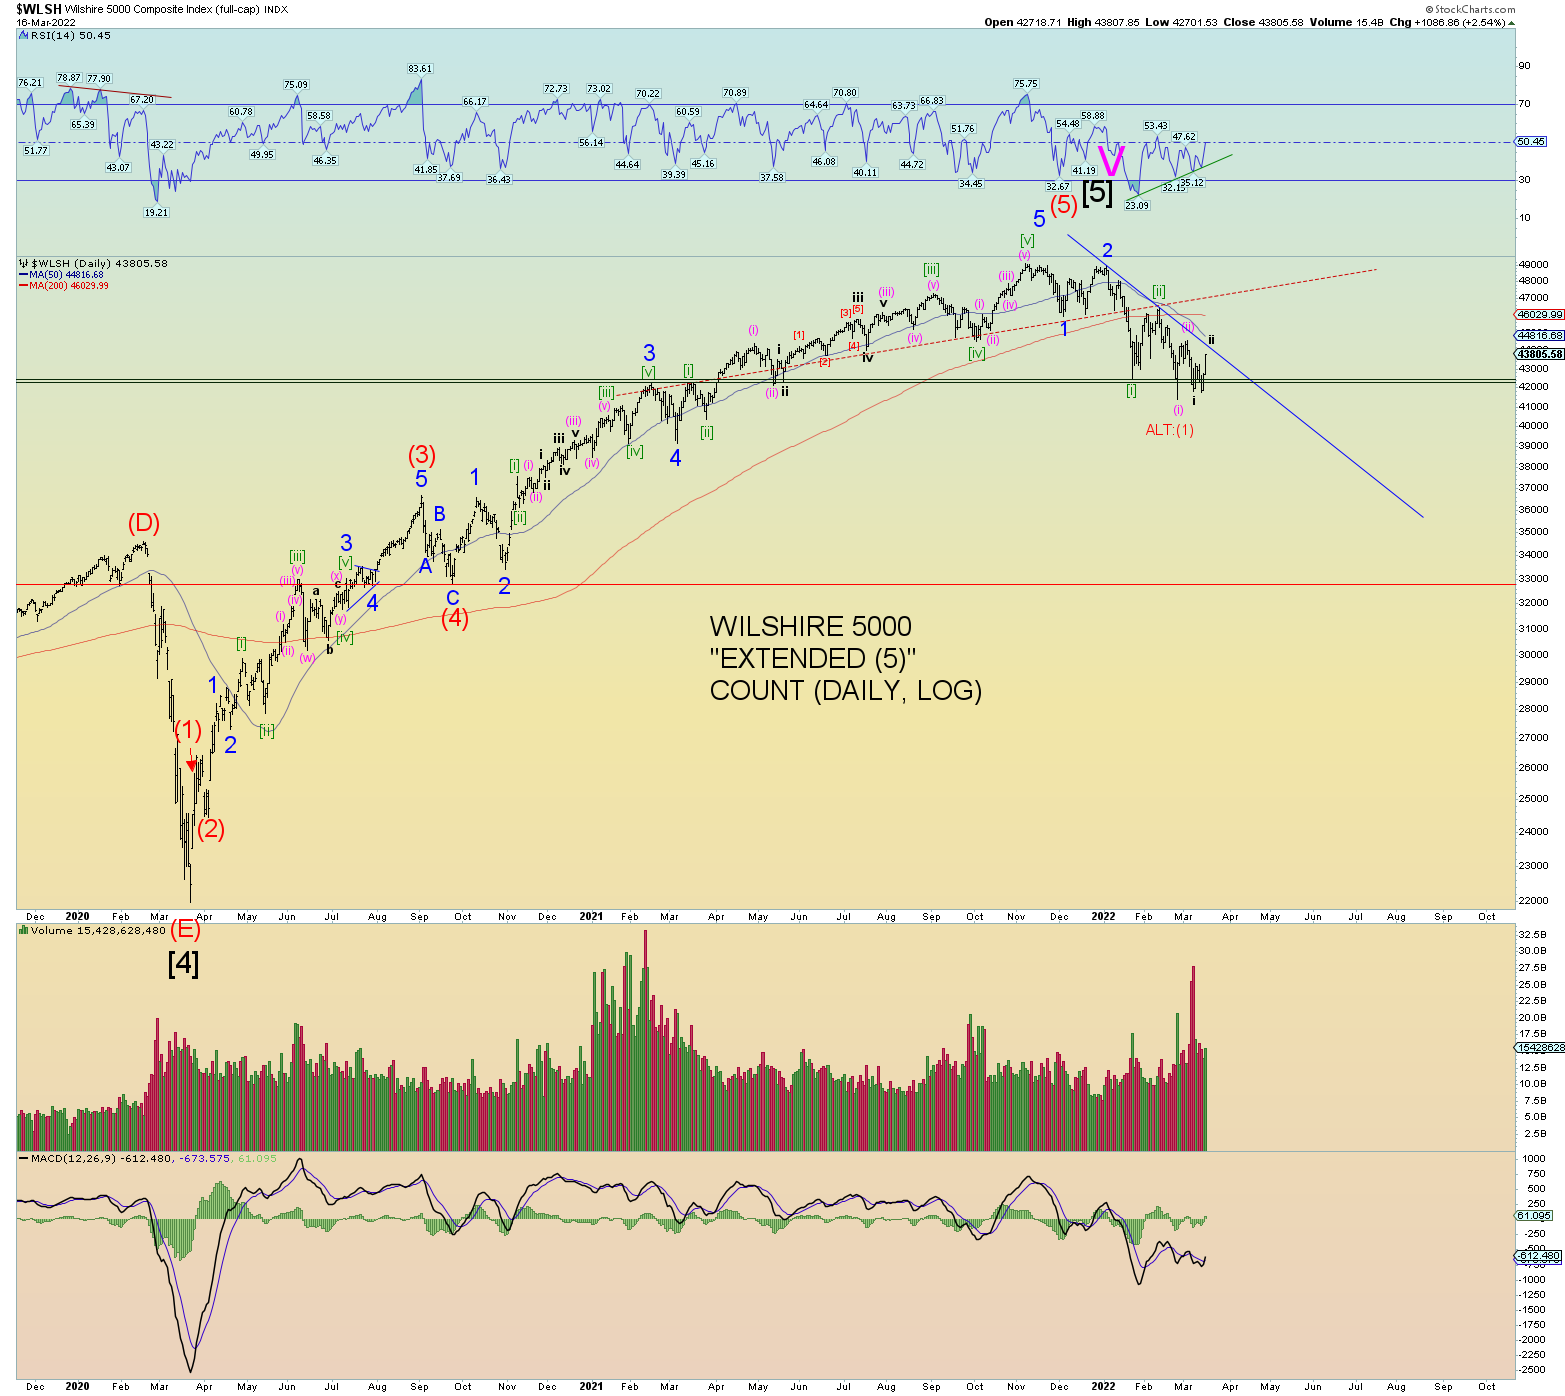
I was going to get very detailed in the market action analysis today. But I’ll make it simple. We have 5 waves down on both the Wilshire 5000 and Composite. Perhaps this is simply telling us this is the end of wave (1) down.

So far that morning price low of the day of invasion has held in the Wilshire 5000, DJIA, and SPX. You know what the saying goes…”sell the rumor (in this case war), buy the news (actual war)”. And so, the market has held up technically and the Wilshire has strong positive technical divergence on the RSI. Lower price closes and higher RSI strength. We may simply be in Intermediate wave (2) as was suggested back on the 24th of February.

If that is the case, I would expect – at minimum – a 50% retrace of the price drop from the early November peak.

Again, sell the rumor is the opposite of buying the news. Horrible things have happened since the 24th and the world markets are in distress. Yet, China bounced hard yesterday as did the US markets which now have a very strong 2-day run backed by numerous technical positive divergences.

All this to say is that if this is Intermediate (2), we are likely on the back-end wave C of (2). We had about 3 1/2 months from peak with diverging peaks in the SPX and DJIA so things are a bit disjointed at the Grand Supercycle top which one could expect.

The high red daily volume bars I point out in the chart below seems, at the moment, like a washout. Forced market action lower yet the intraday pivot low was not challenged. I expected a continued rise in heavy volume down pushing prices lower but that hasn’t happened – yet. Advantage: bulls.

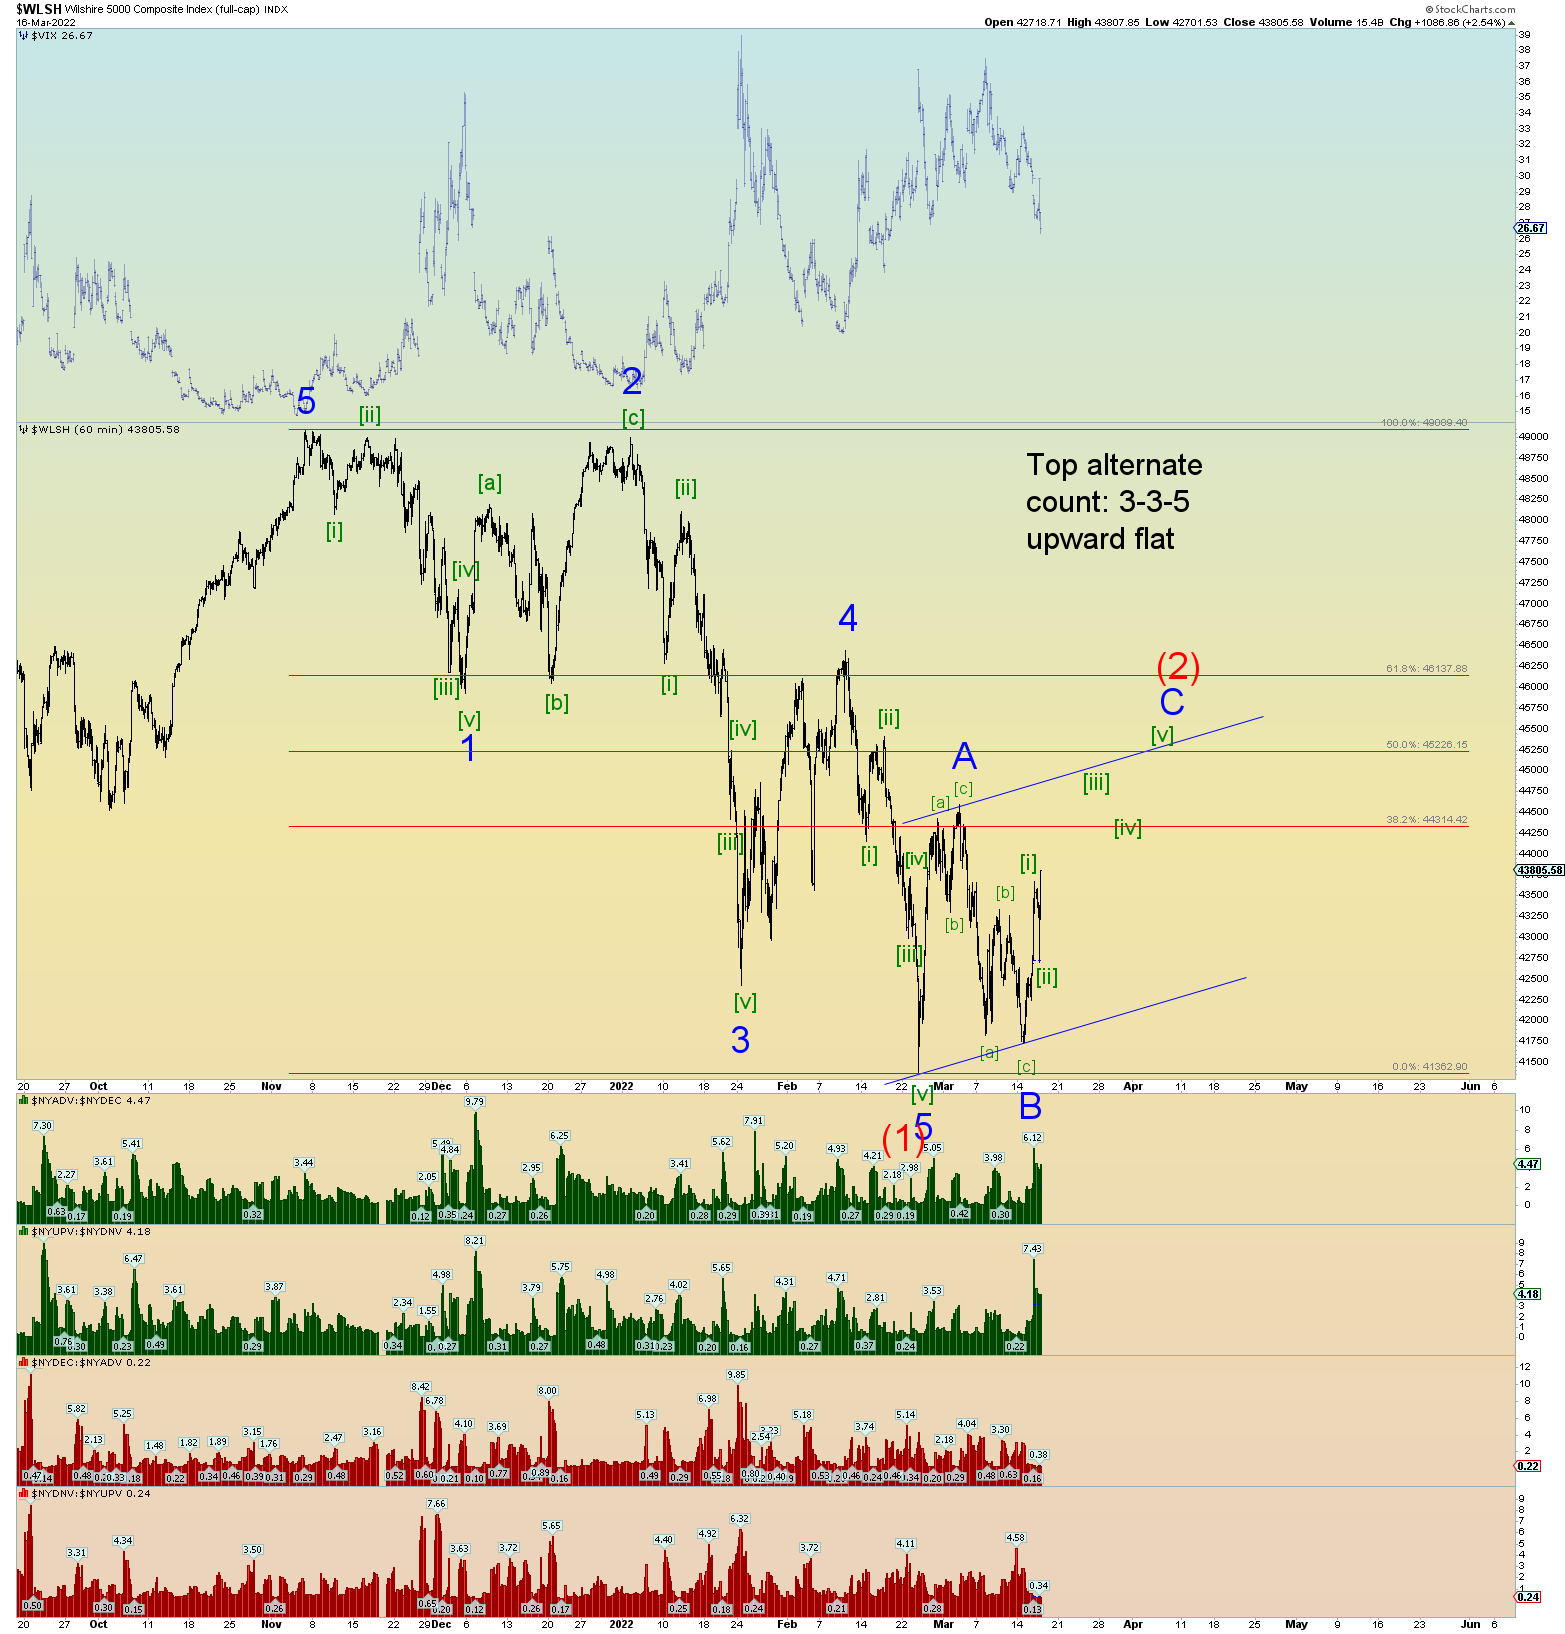
A possible squiggle count of (2) using the hourly. Would result in about a 50% retrace perhaps a bit more muted than was suggested with the daily chart above.

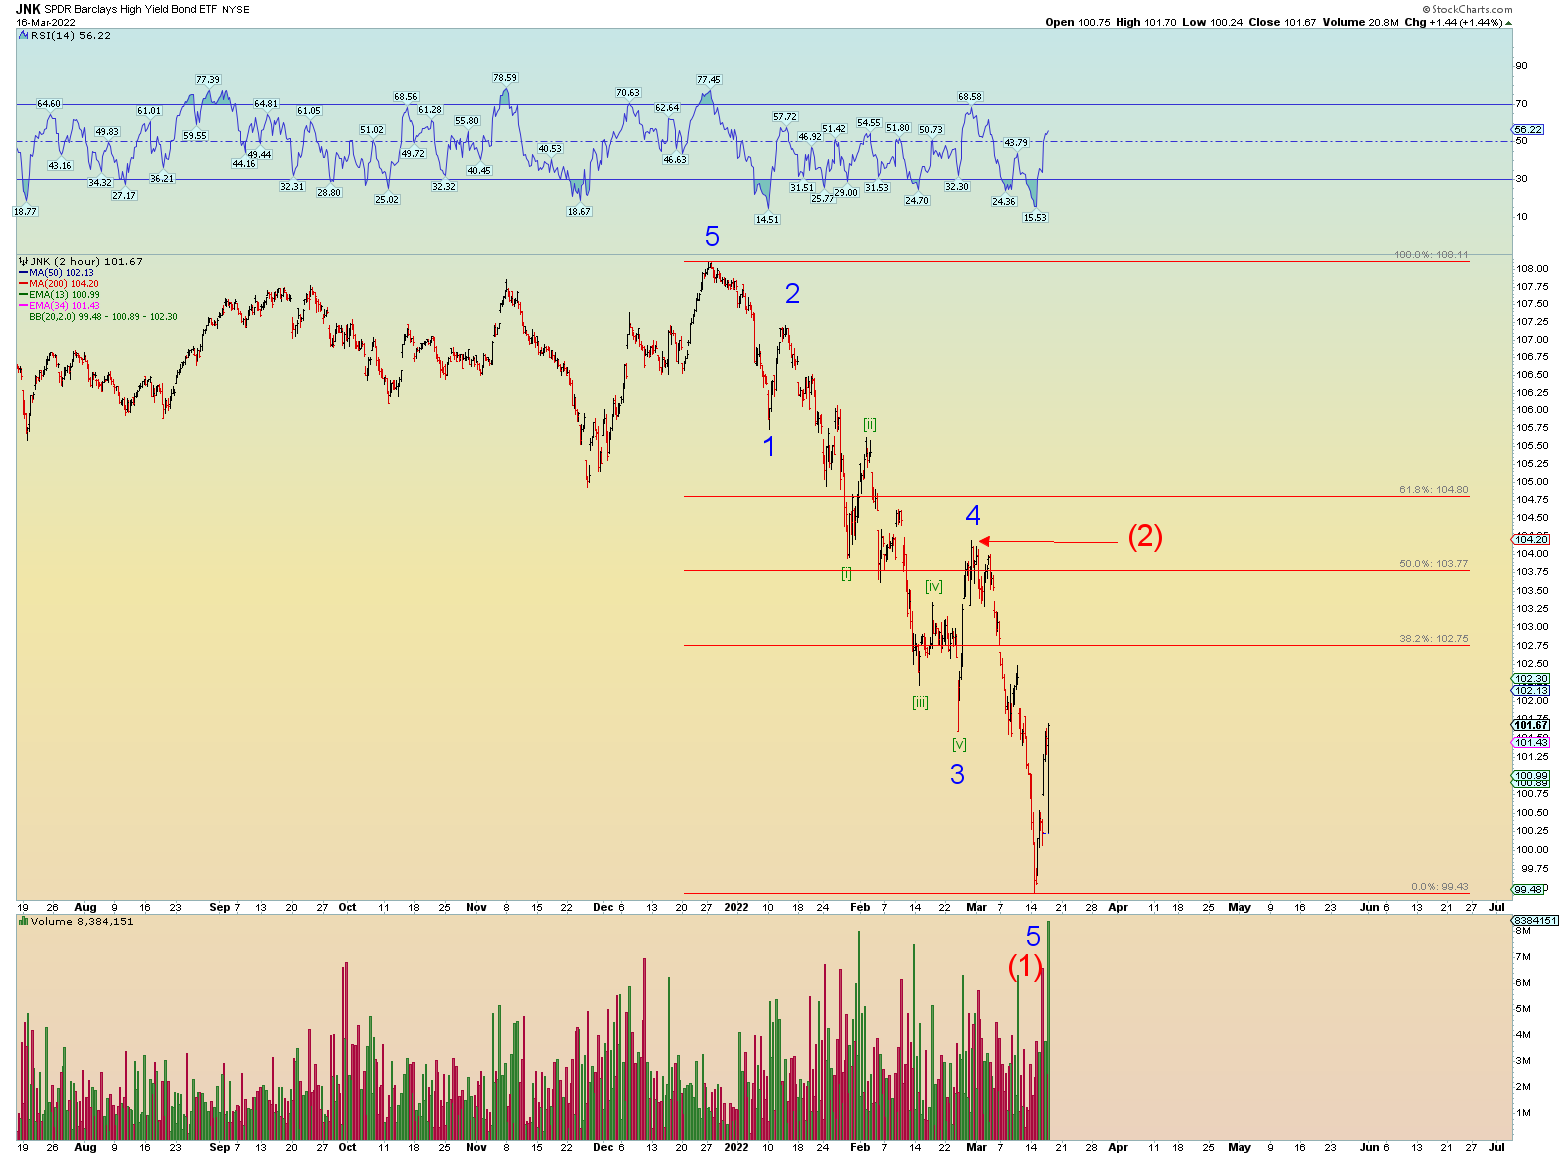
Junk perhaps bottomed in its own wave (1) down. This is important because if credit tries to repair itself a bit (nothing ever goes straight down!) the overall market should do the same. But ultimately it will fail. Like the Titanic, the fatal blow has already been dealt and many just do not realize it yet.

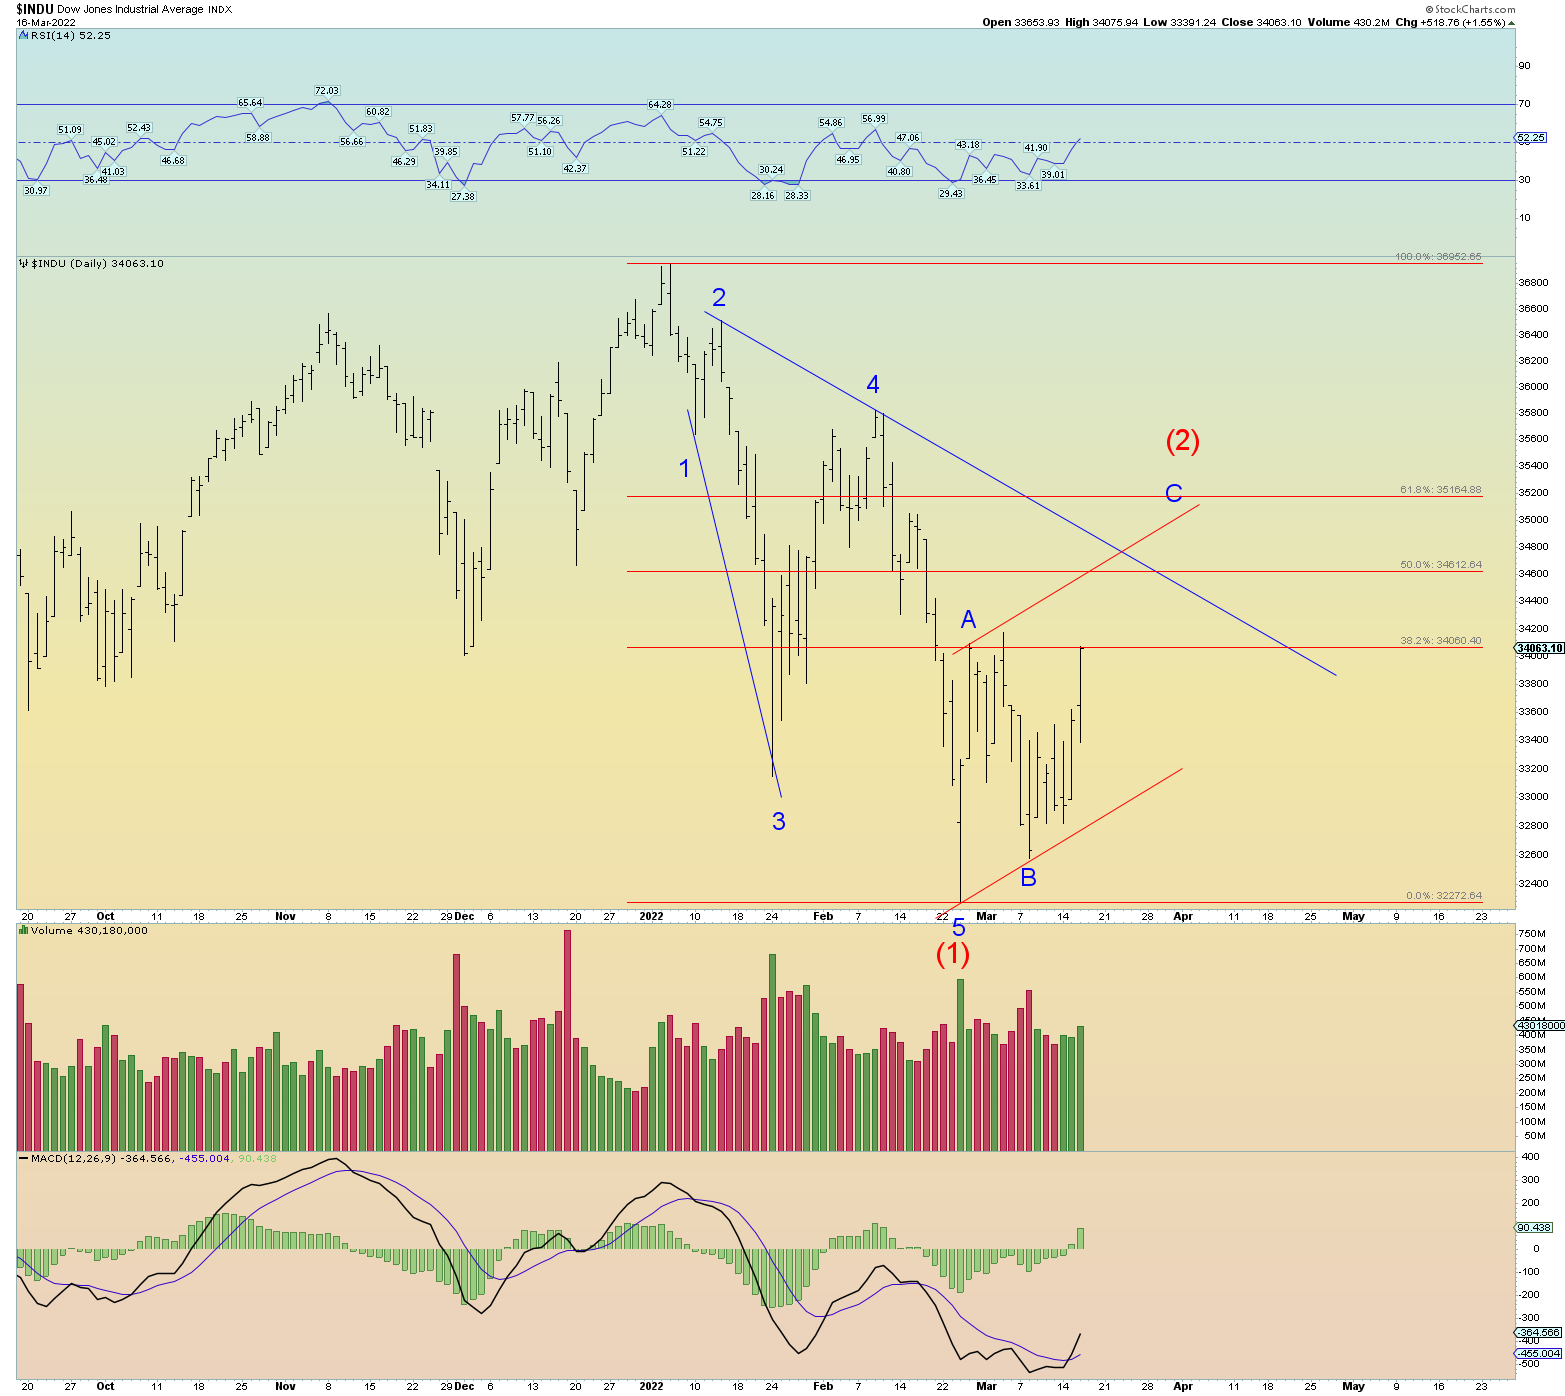
So, what would the DJIA and SPX look like if the 24th was the wave (1) actual low? Leading diagonal triangle. It works ok on the dailys at least.

Remember, at a Grand Supercycle top, the waves are going to be in a state of transition going to the top and rolling over. Just look at the way the DJIA counts to its top. Also, a diagonal triangle.

On the DJIA chart below, it could be as simple as prices need to reach back toward the downward red trendline before resuming down in wave (3). As I said, if this is wave (2) we are likely on the tail end of things which being wave three – C – is the strongest and will get everyone excited about the market again before pulling the rug out. This is why the “news” is to be ignored in wave counting. The Ukraine War has demanded that equity prices keep going lower but so far they have not since the opening war salvo. This is the contrarian nature of markets.

But contrarian markets aside, a Ponzi scheme is just that – worth zero. Once a Ponzi scheme is identified it goes (correctly) toward zero despite 100% negative sentiment. There is no “contrarian” saving play. I propose that one day in the future the markets will practically do the same despite negative sentiment for they are mostly all a Ponzi scheme also.

The ultimate price rise would be a backtest of the upper channel line shown on the weekly. That would take prices above Minor 4 of (1) down.

Ok now that we got that count scenario out of the way, let’s look at what we currently actually have as waves. We have a series of one-twos so far and nothing more. Therefore, despite all my fancy market projections stated above, it would really be easy to just rollover and die in an earth-shattering “middle of the third” wave lower. The market is not to be trusted at this point. Roller-coaster waves of 2-3 % swings overnight into the daily sessions is exhausting. A high steady VIX could explode (capitulate) much higher. And although many think that certain markets have already capitulated, the overall US market has not. There has been nothing close to a”90%” downside across-the-board day just yet.

So, despite all the above I’m still bearish until proven otherwise. BUT, if this count is correct, it has run out of options. The market needs to go lower immediately for the bearish count to bear fruit.

A price push to the down trendline would still keep prices below pink (ii). This is still the primary count because until proven otherwise, we have not broken the rule of “lower highs” just yet. “Selling the rip”.

CONCLUSION

Good market technicals and certain wave counts in other indexes suggests we are in wave C of (2) and it has a bit further to play out. YET even so, I primarily count the Wilshire 5000 and until pink wave (ii) as shown on the above chart gets taken out along with the down trendline, the more bearish count remains as primary. I felt I need to address the other option more vocally than I have been.

It comes down to this: a price rise above pink (ii) likely means the Wilshire 5000 is in Intermediate (2). So, despite the positive technicals and what not, until and unless the series of “lower highs” is nullified, the more bearish count remains as primary.

Elliott Wave Update ~ 14 Mar 2022

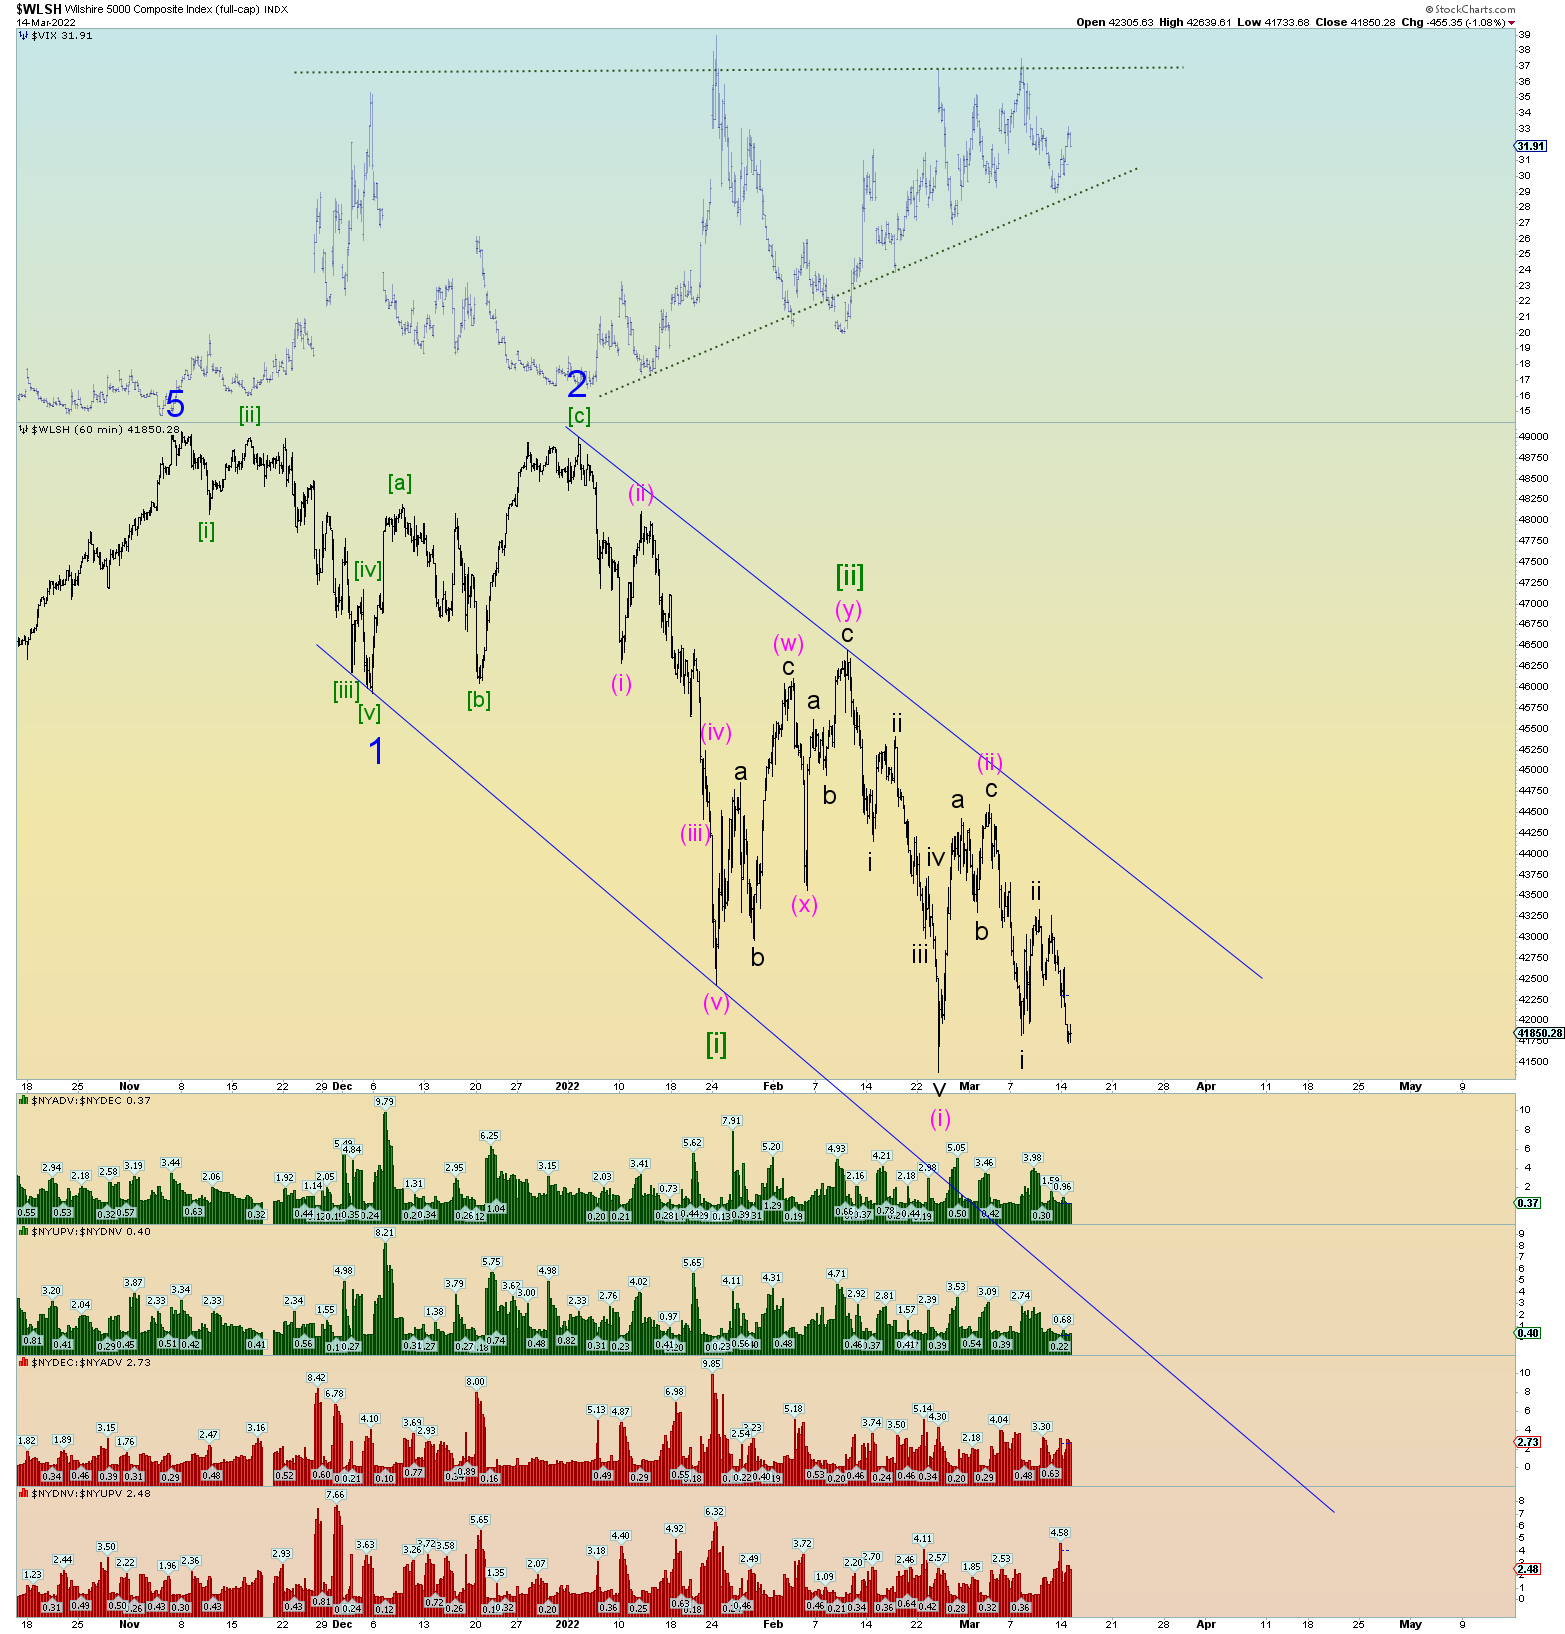
Working its way lower.

Closed beneath significant support.

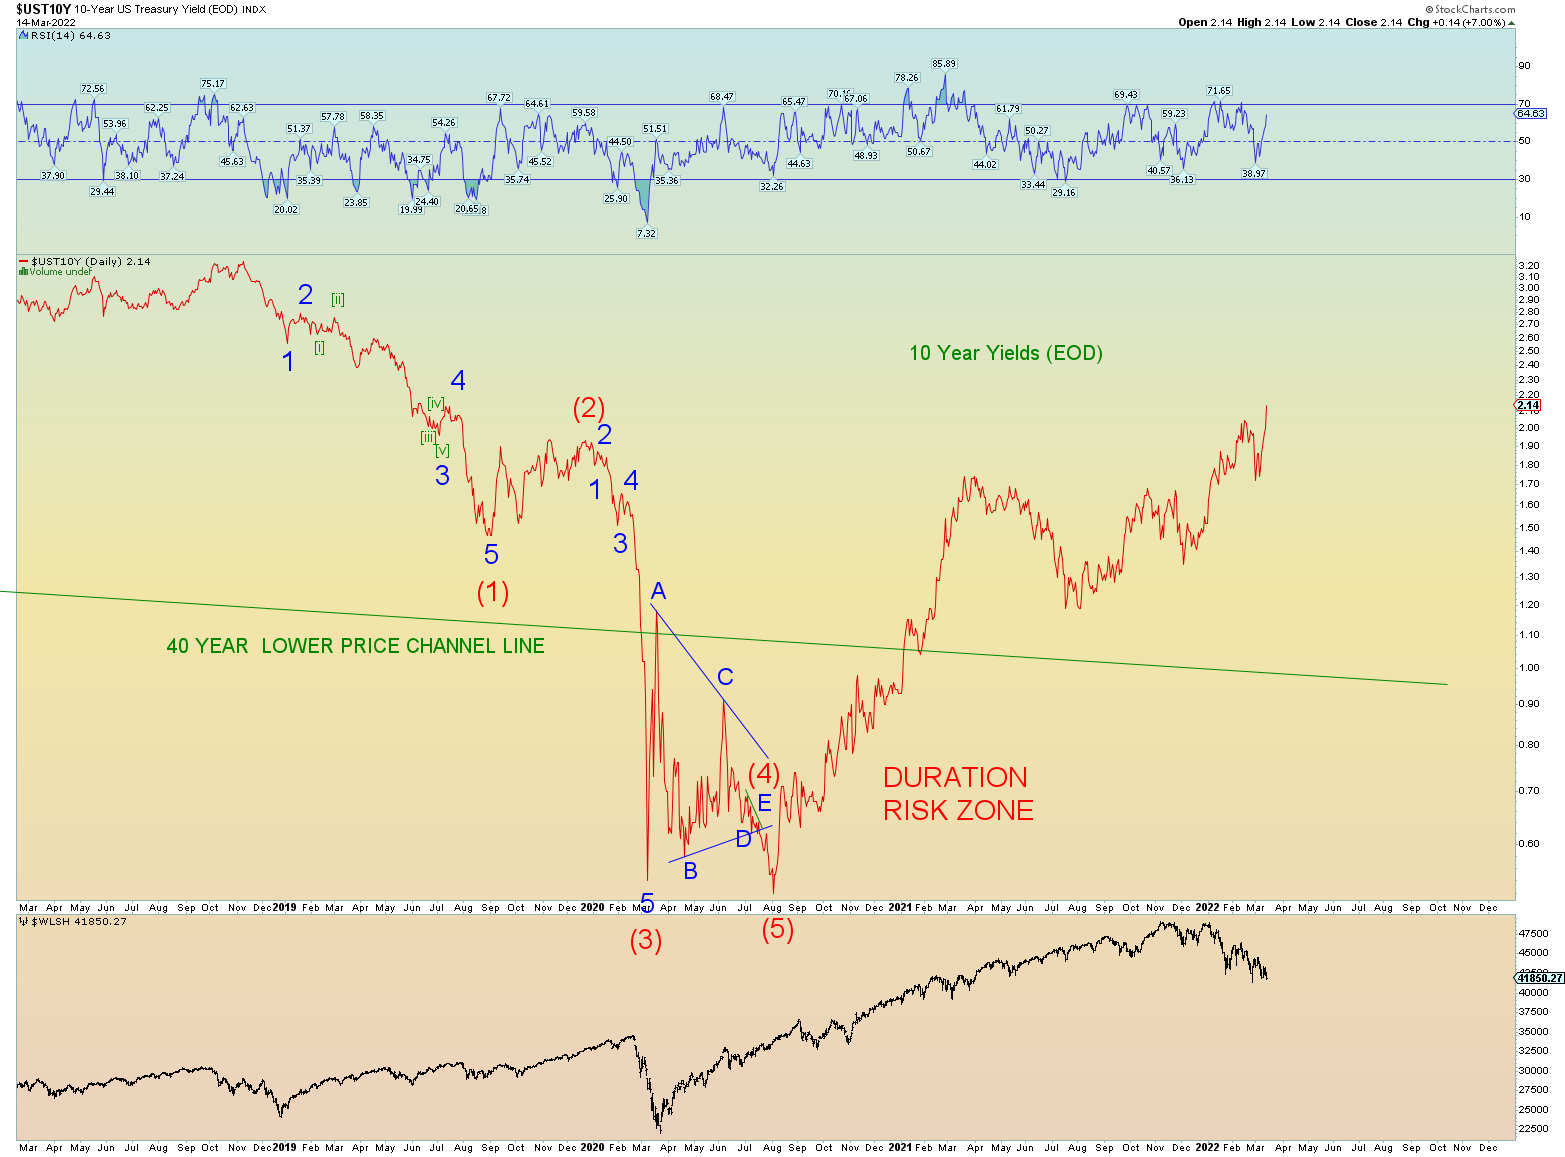
Yields surging.

LOL, 2 days left until the Fed’s decision on rates. If this is wave three up, they may have to hike a full 1/2 point which would catch the market by surprise.

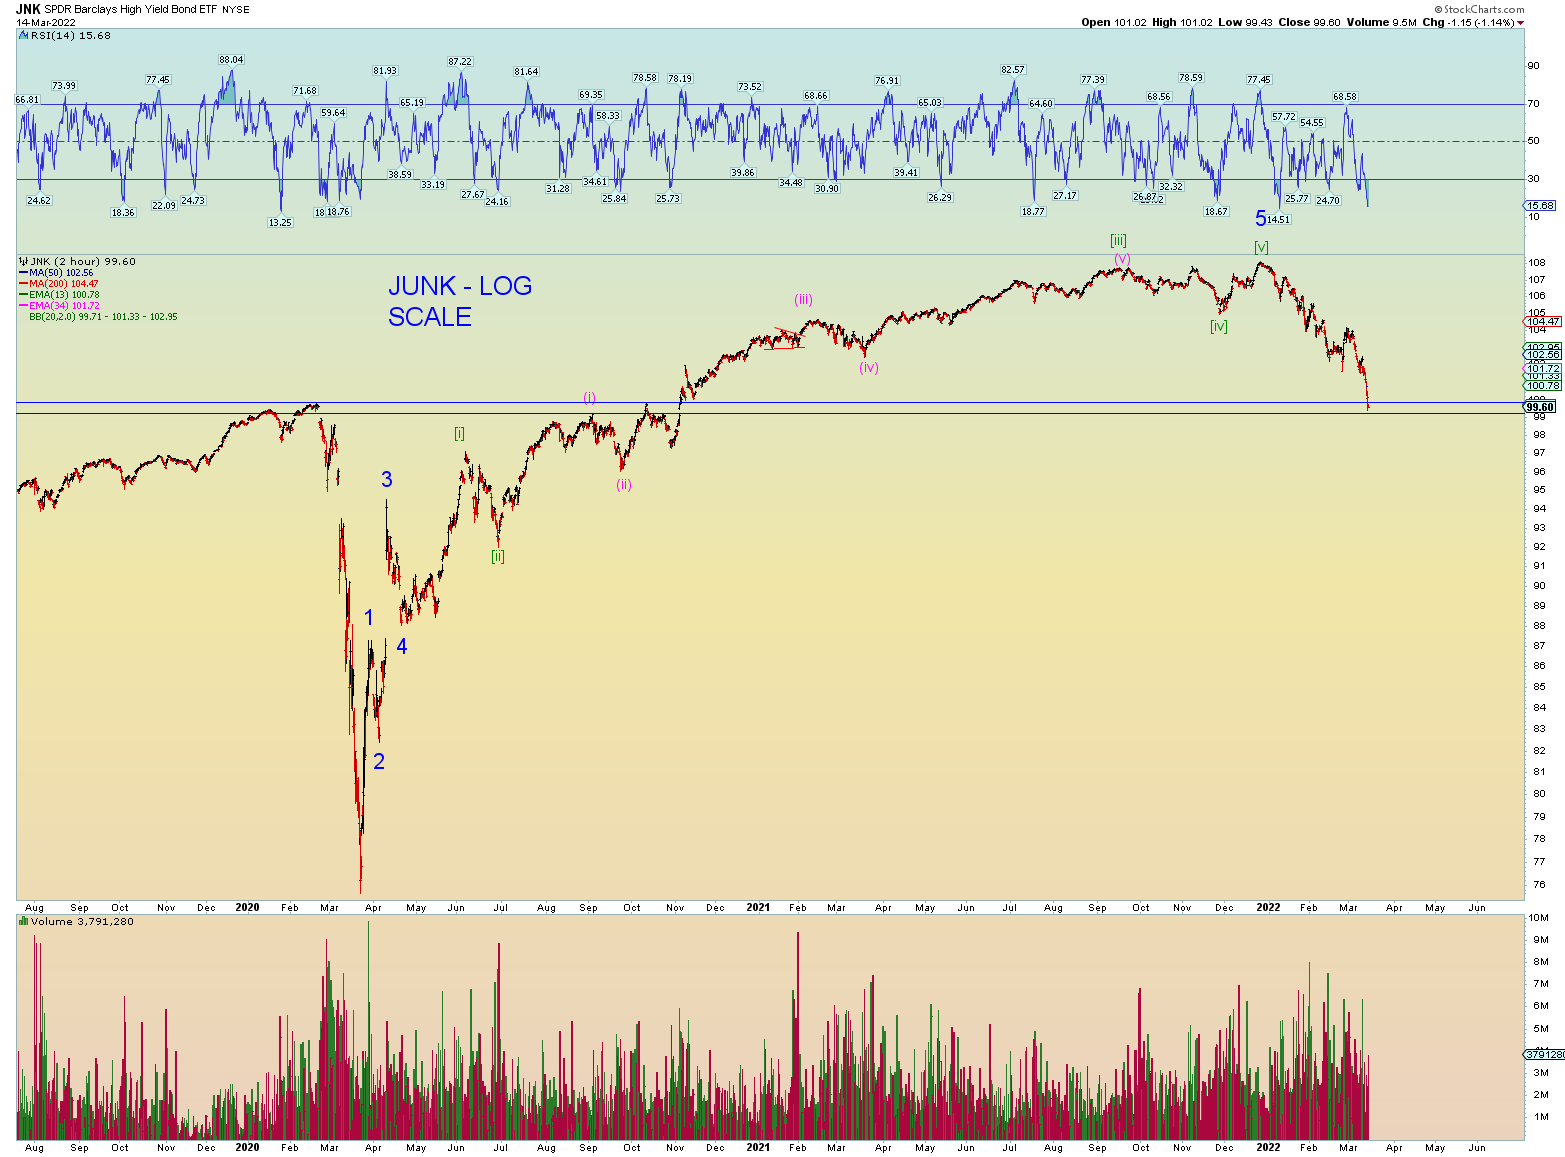
Junk debt leading the way.

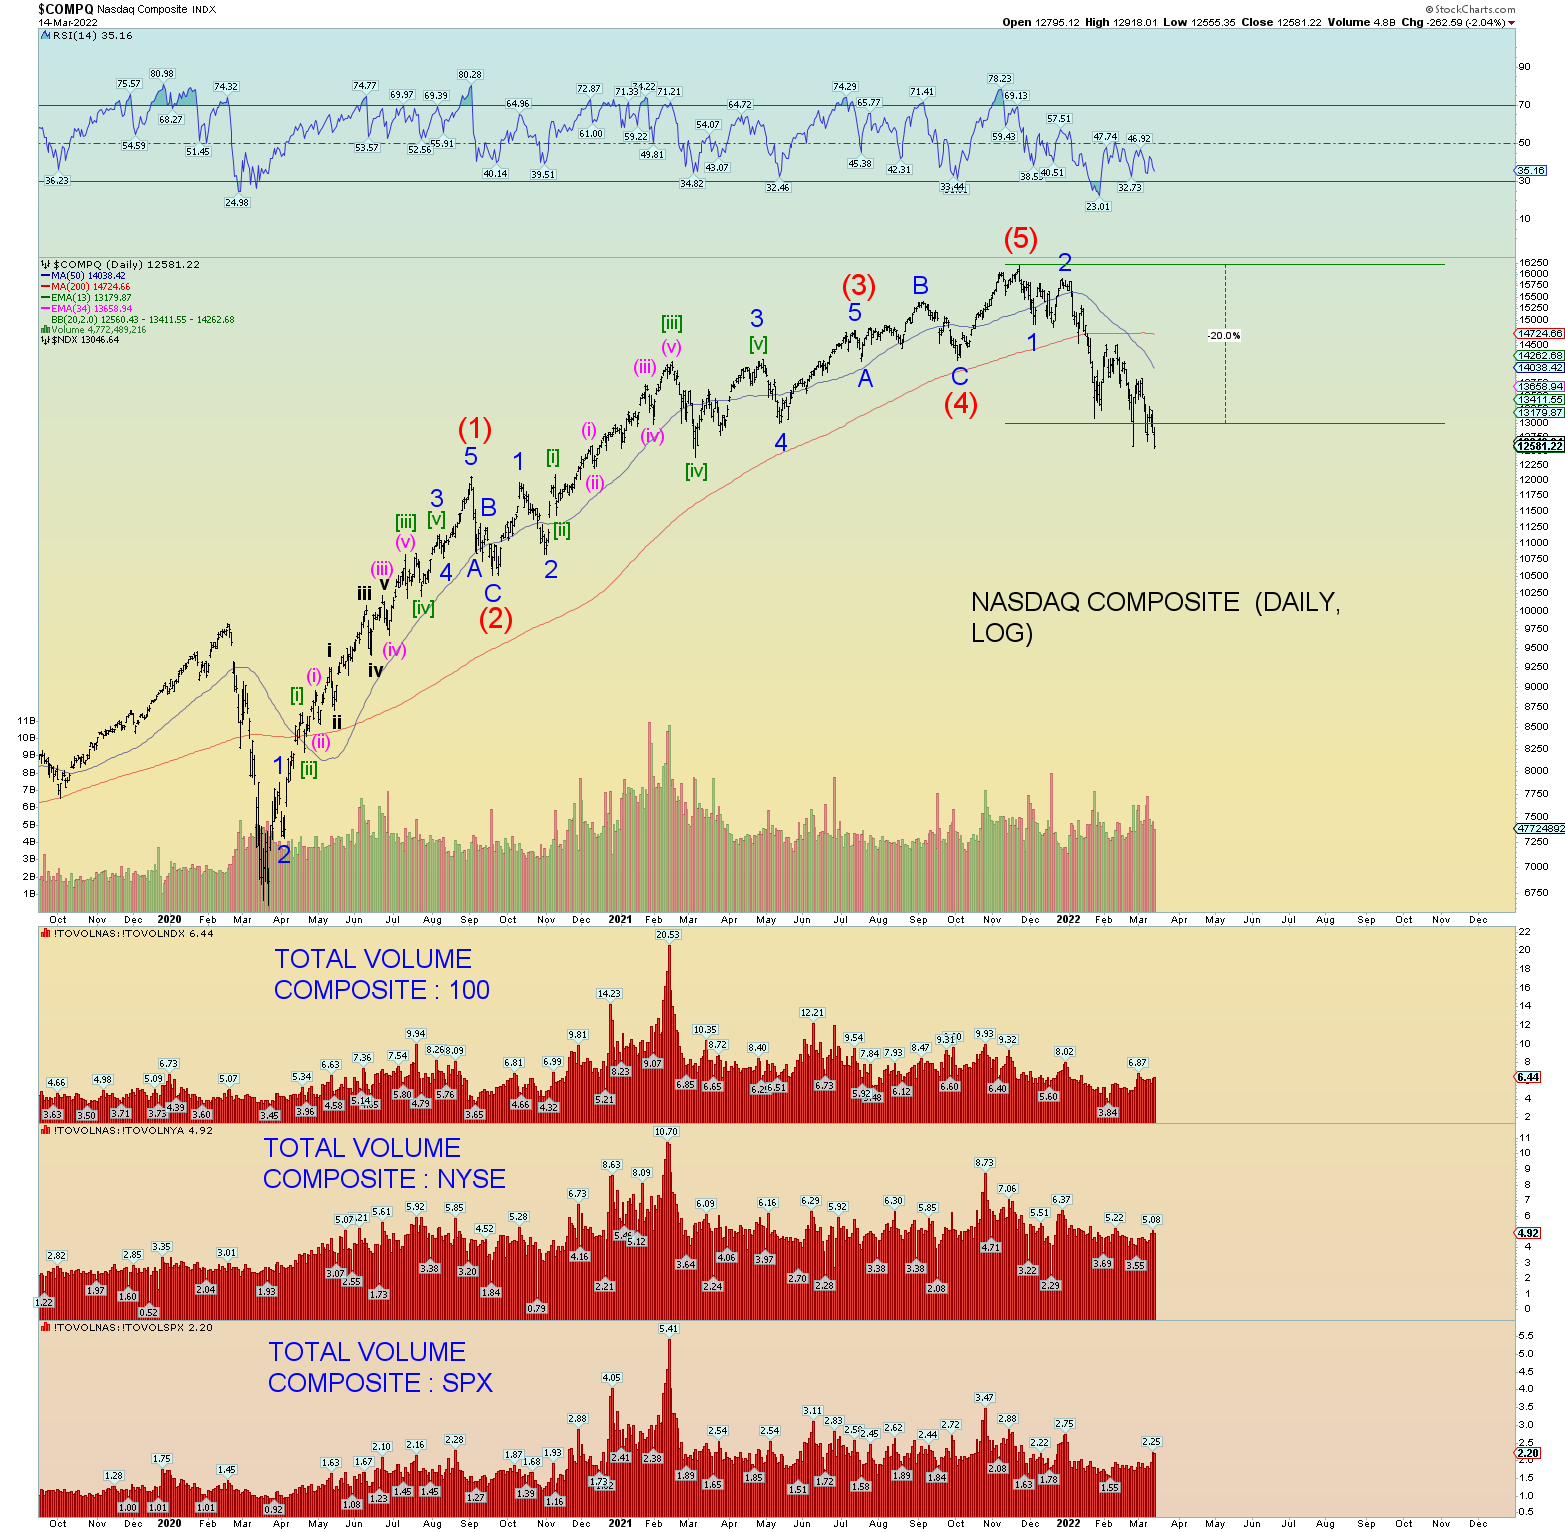
Composite another close well below bear market territory.