Ultimately giving the market the benefit of the doubt because our ideal target ranges have not been met yet. Prices are approaching the down sloping 50 DMAs in most indexes.
Market still charging upwards. At least a .50 hike and even that will be behind the curve.
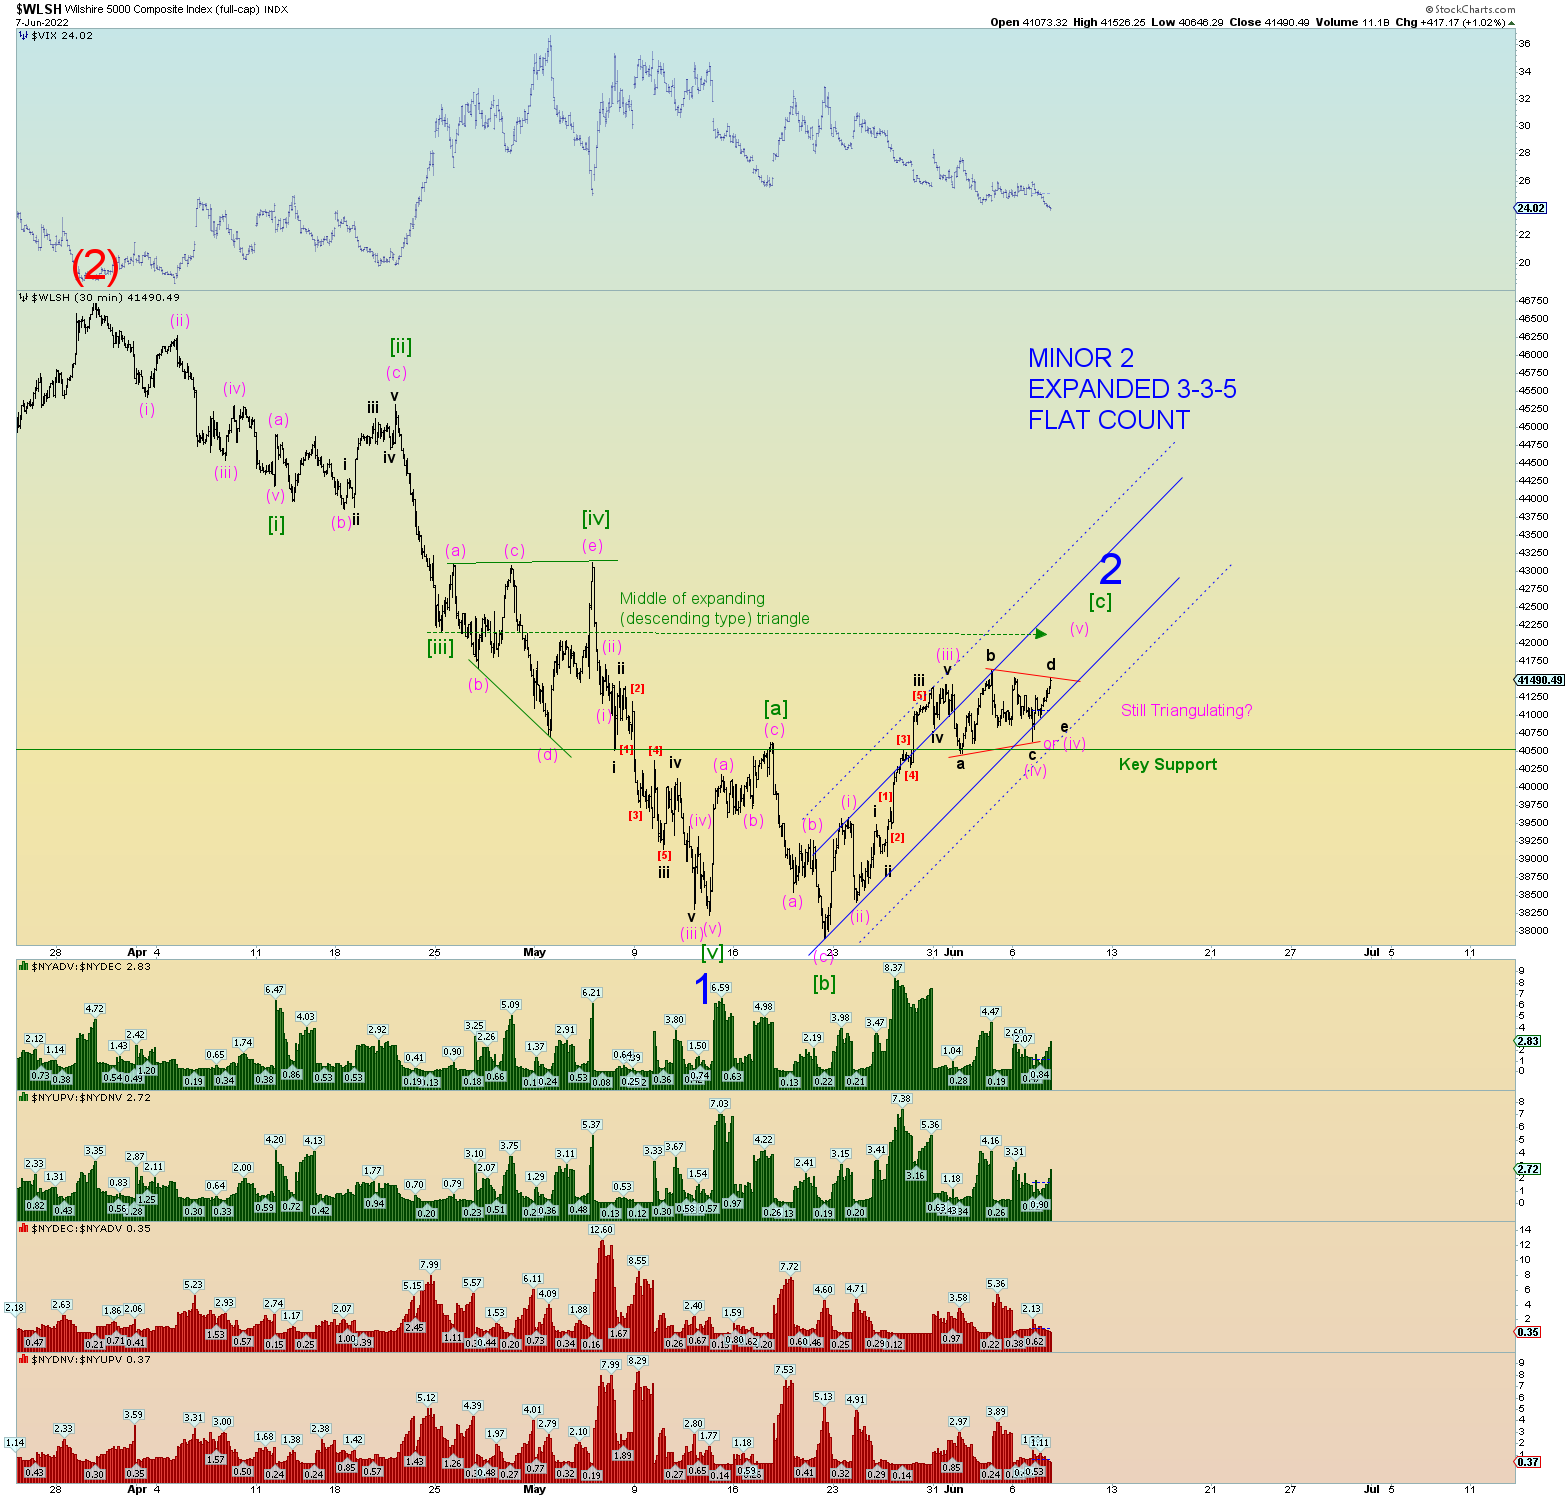
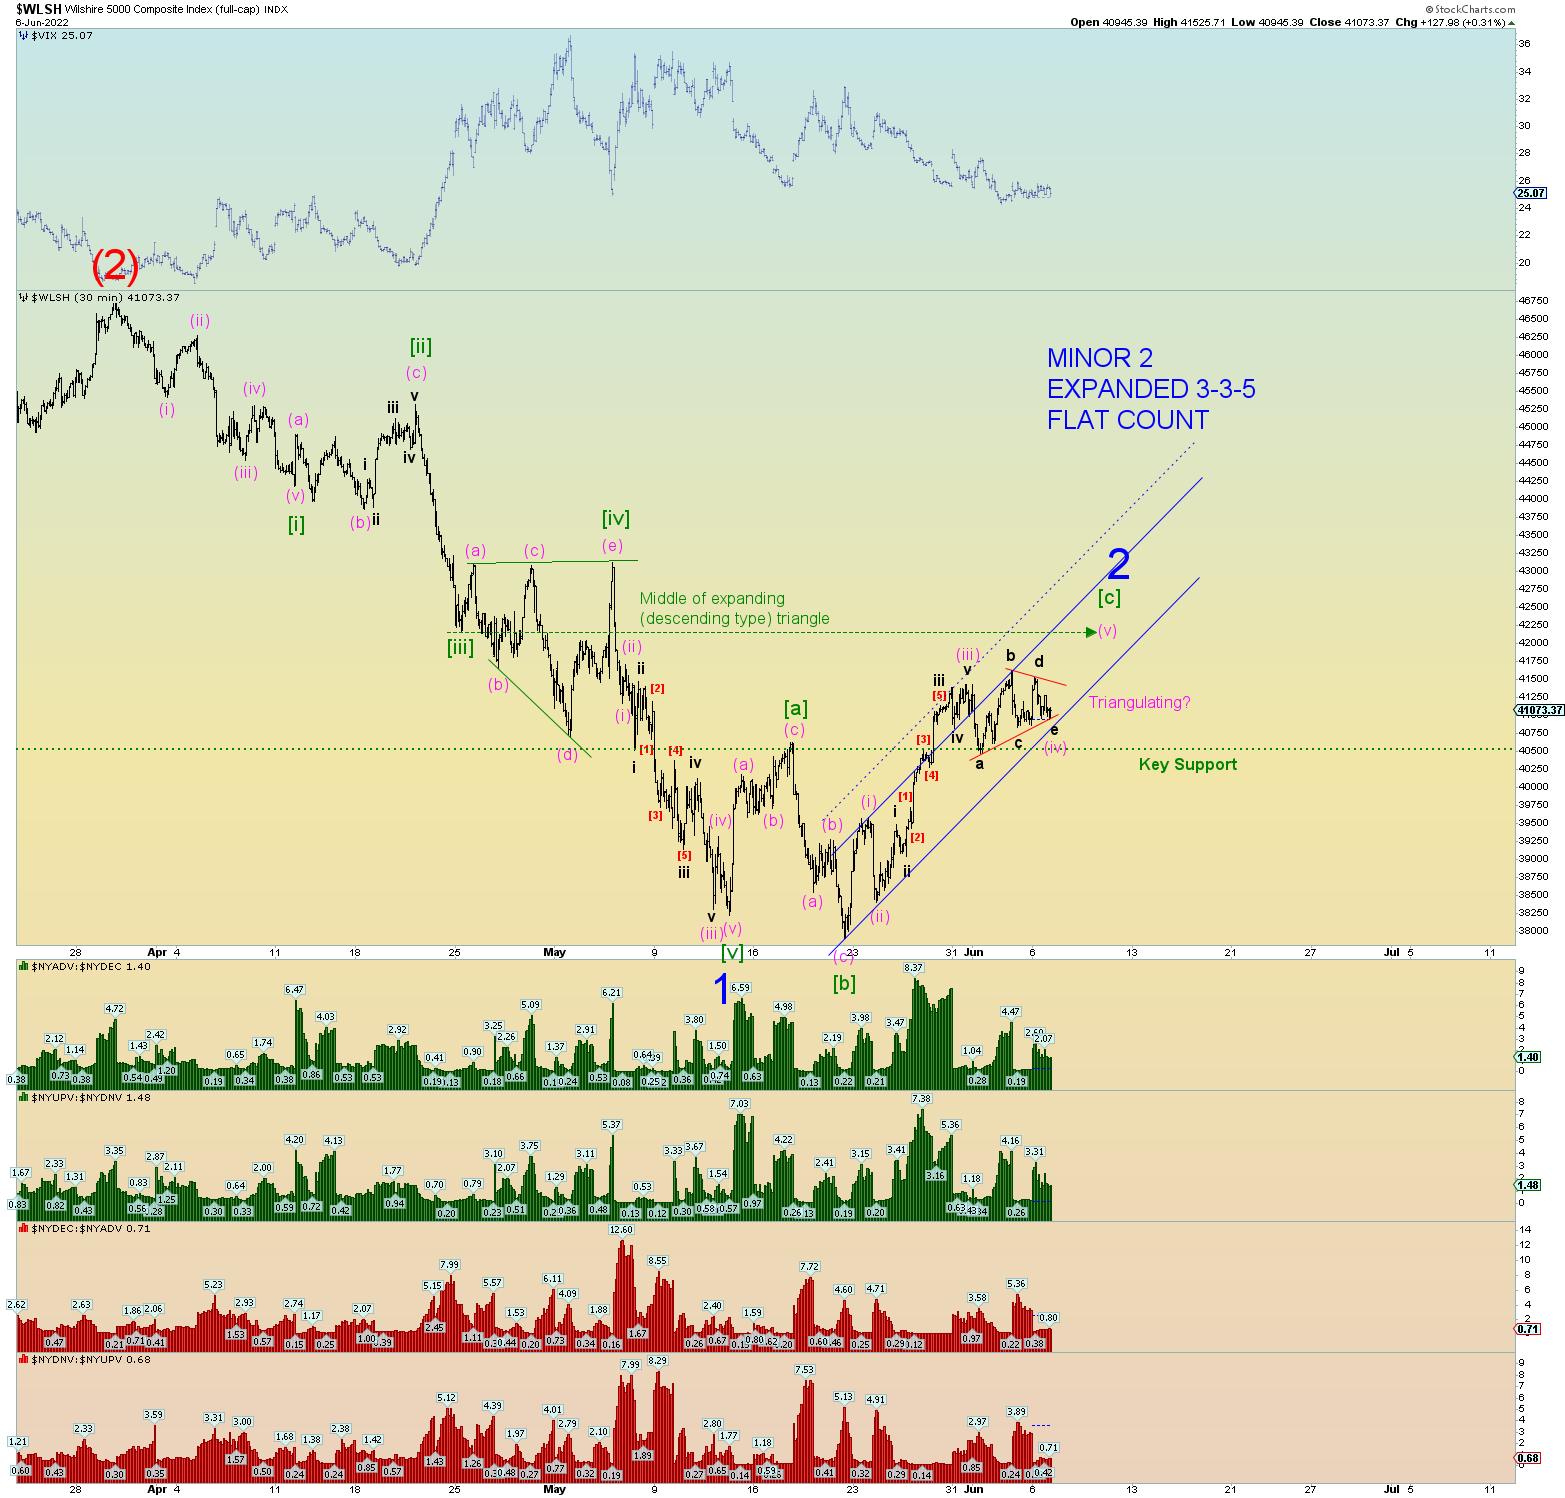
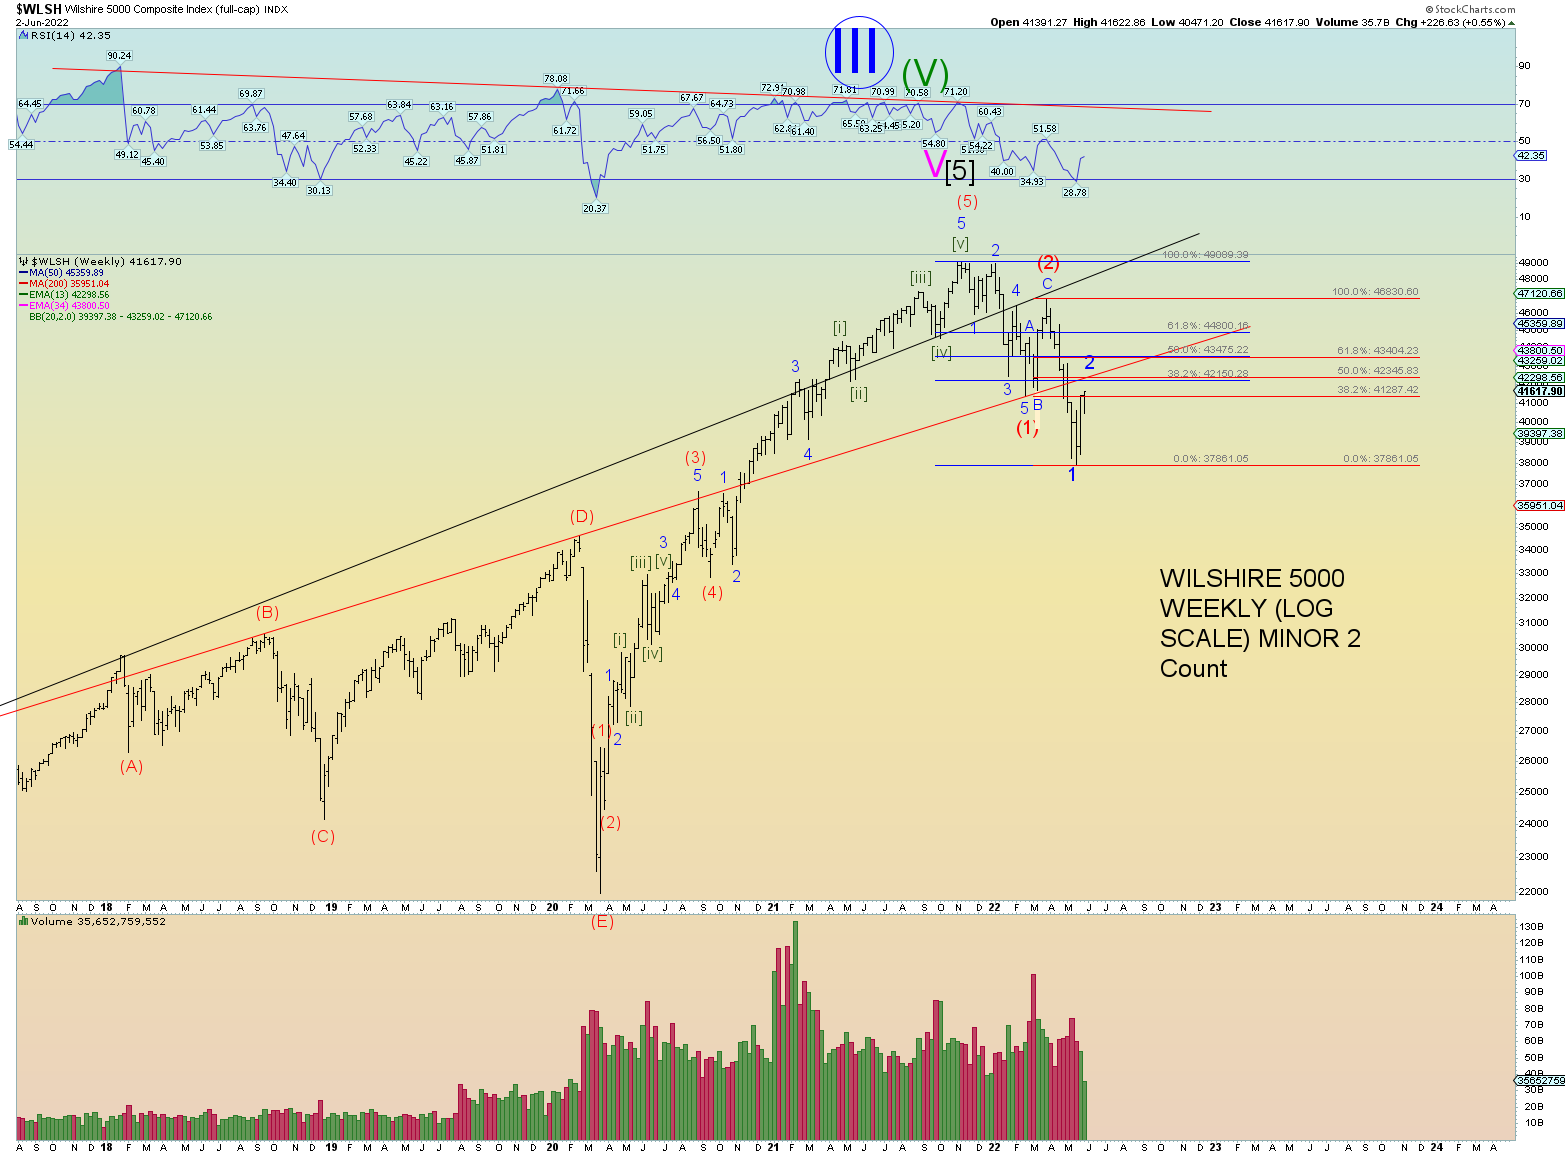
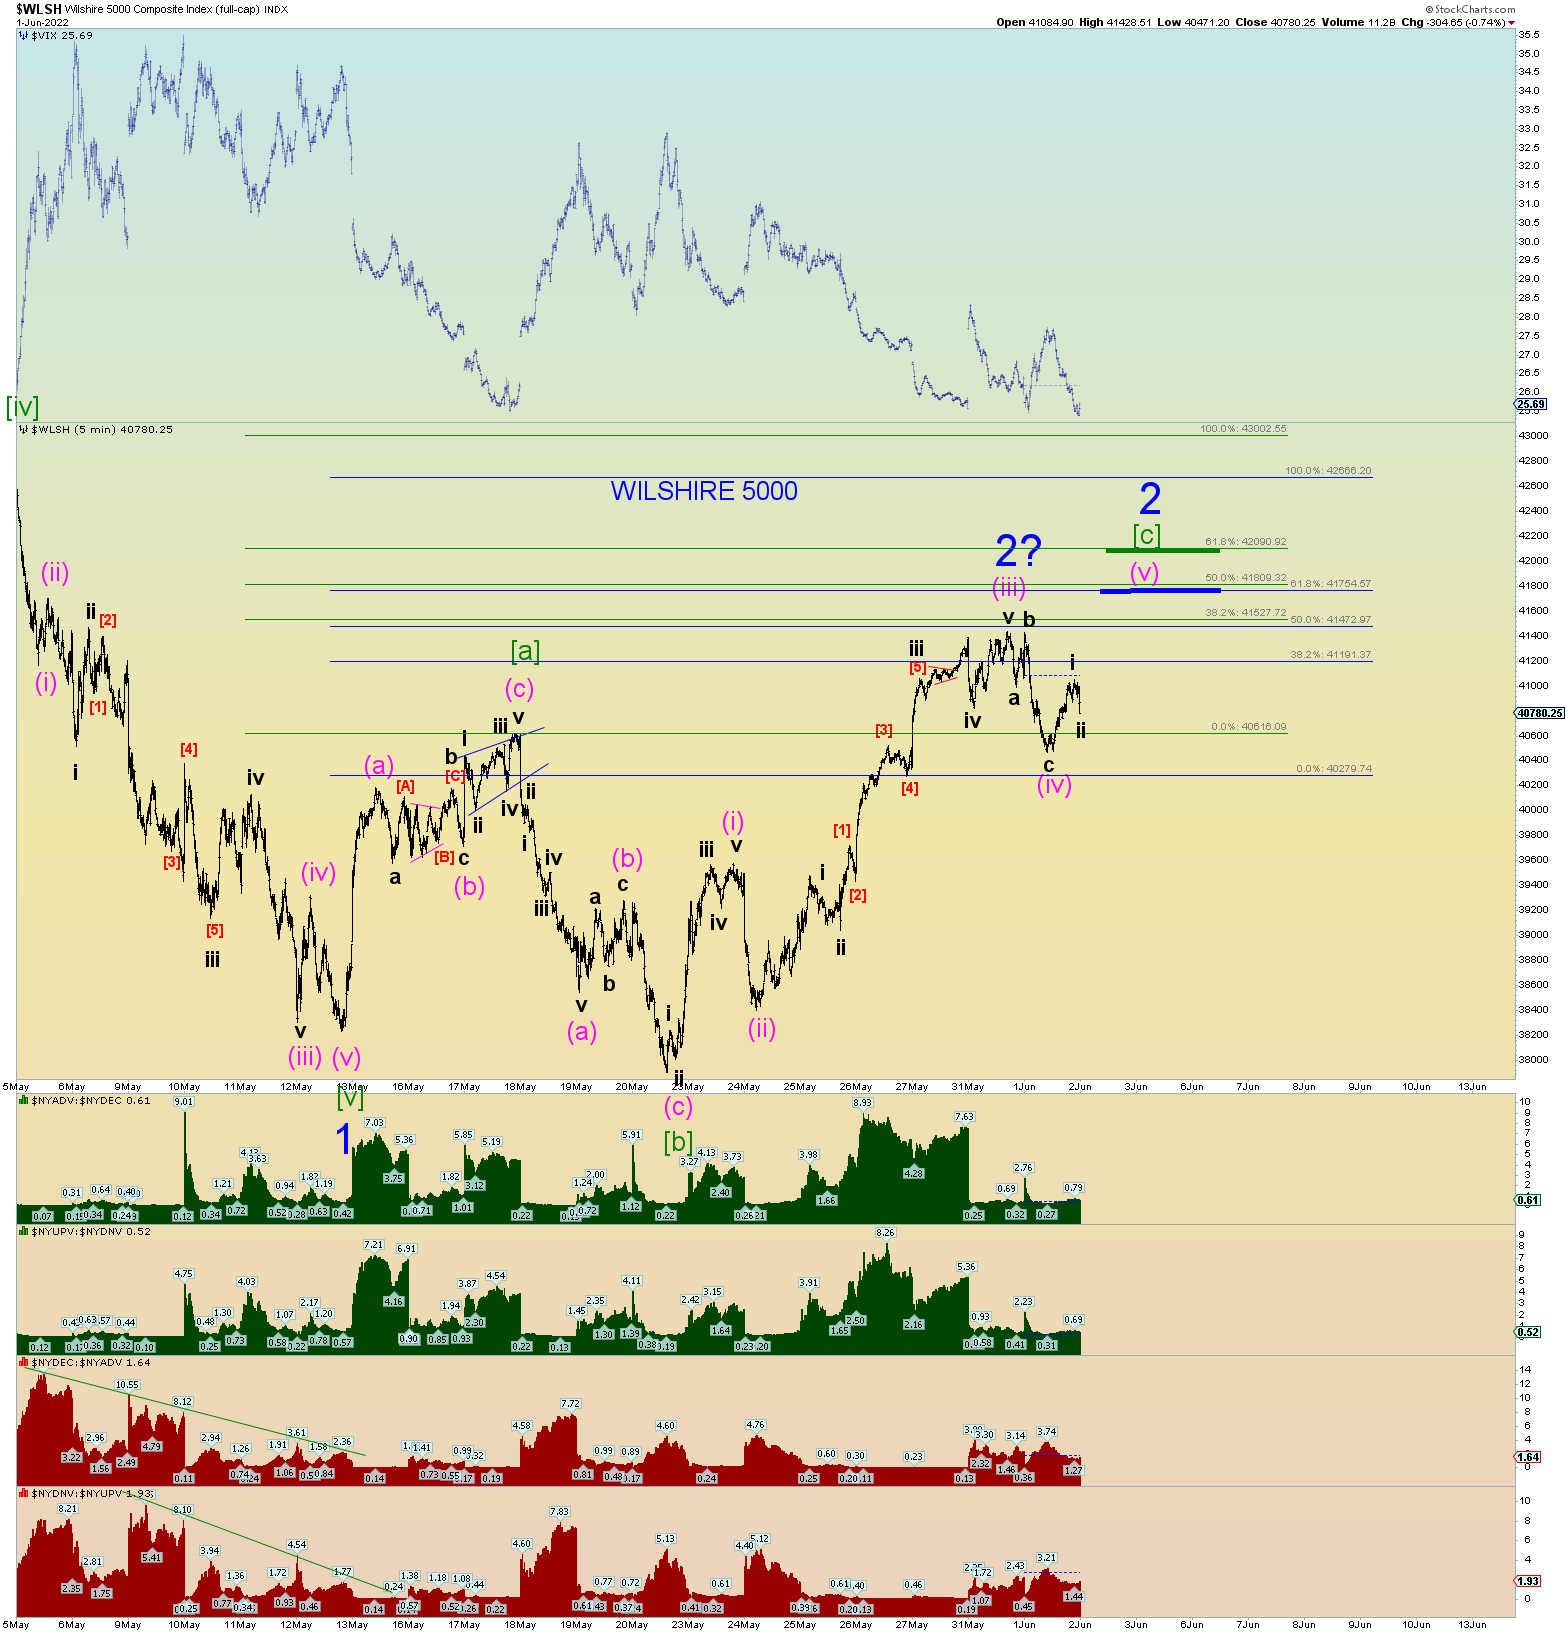
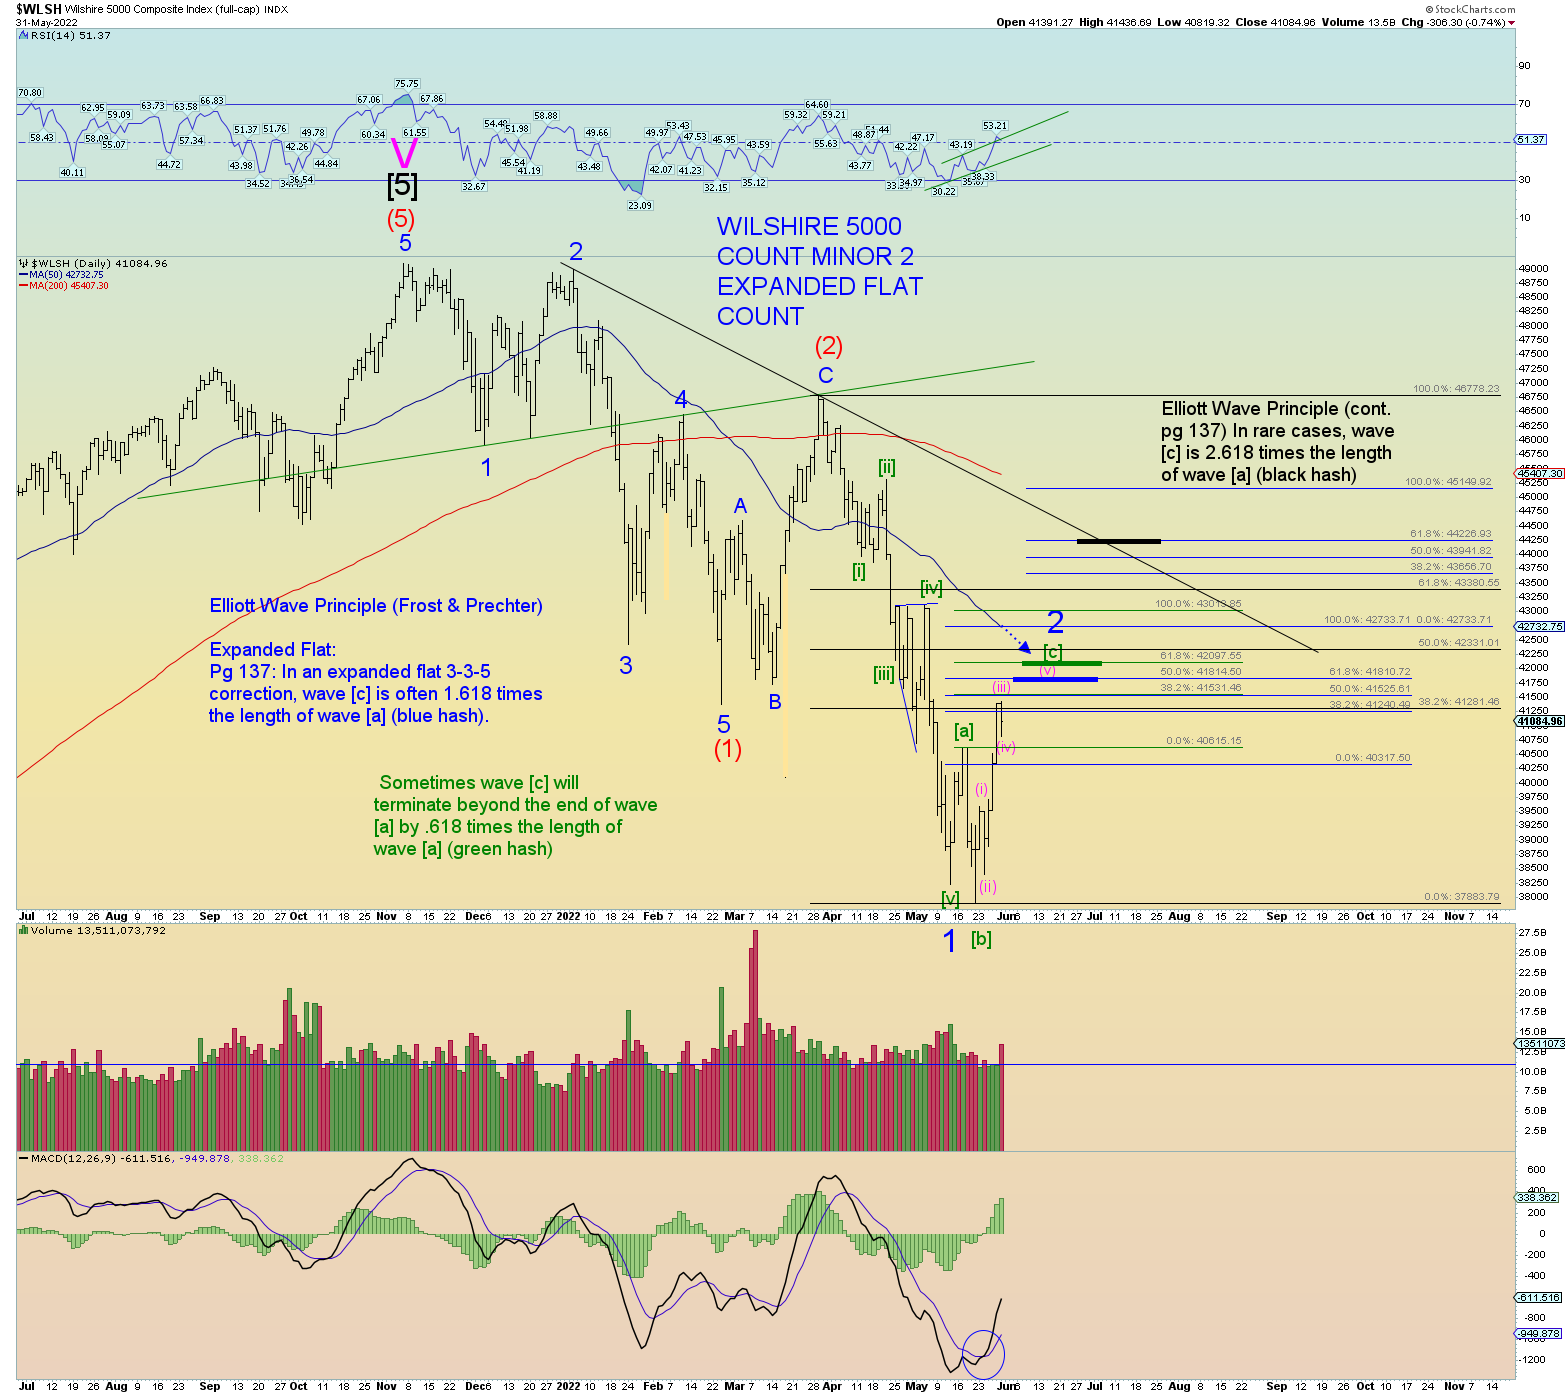
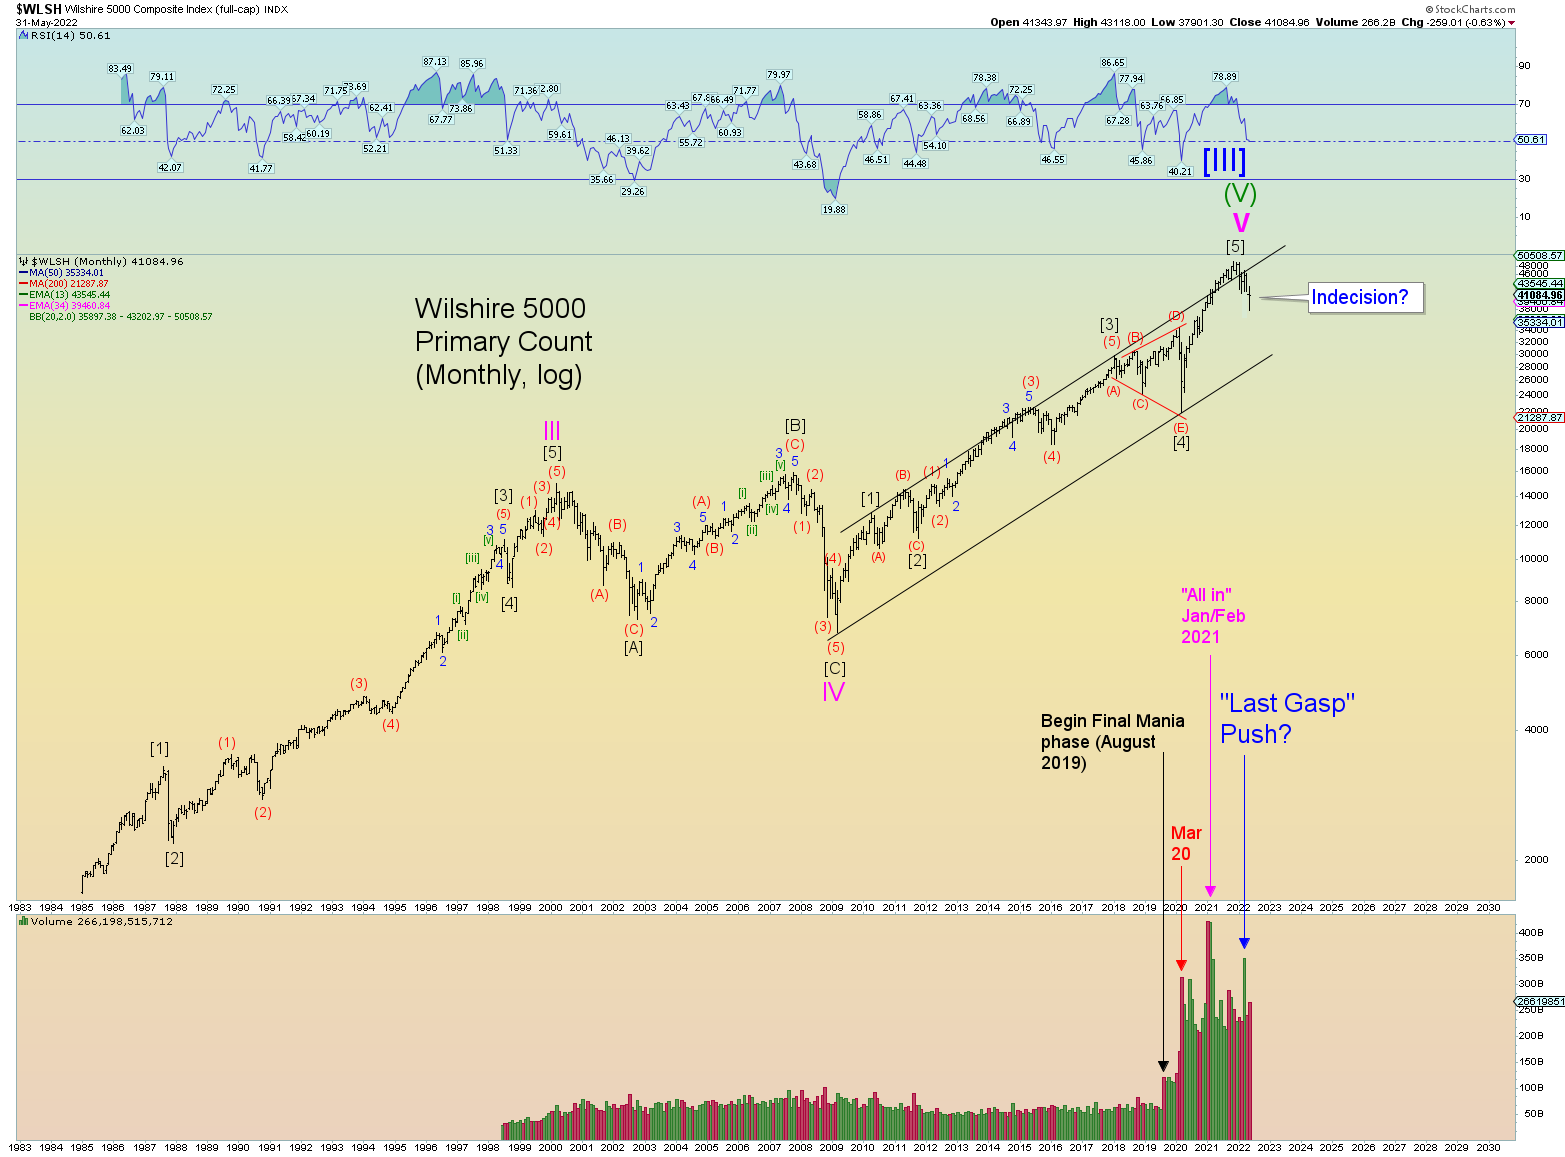
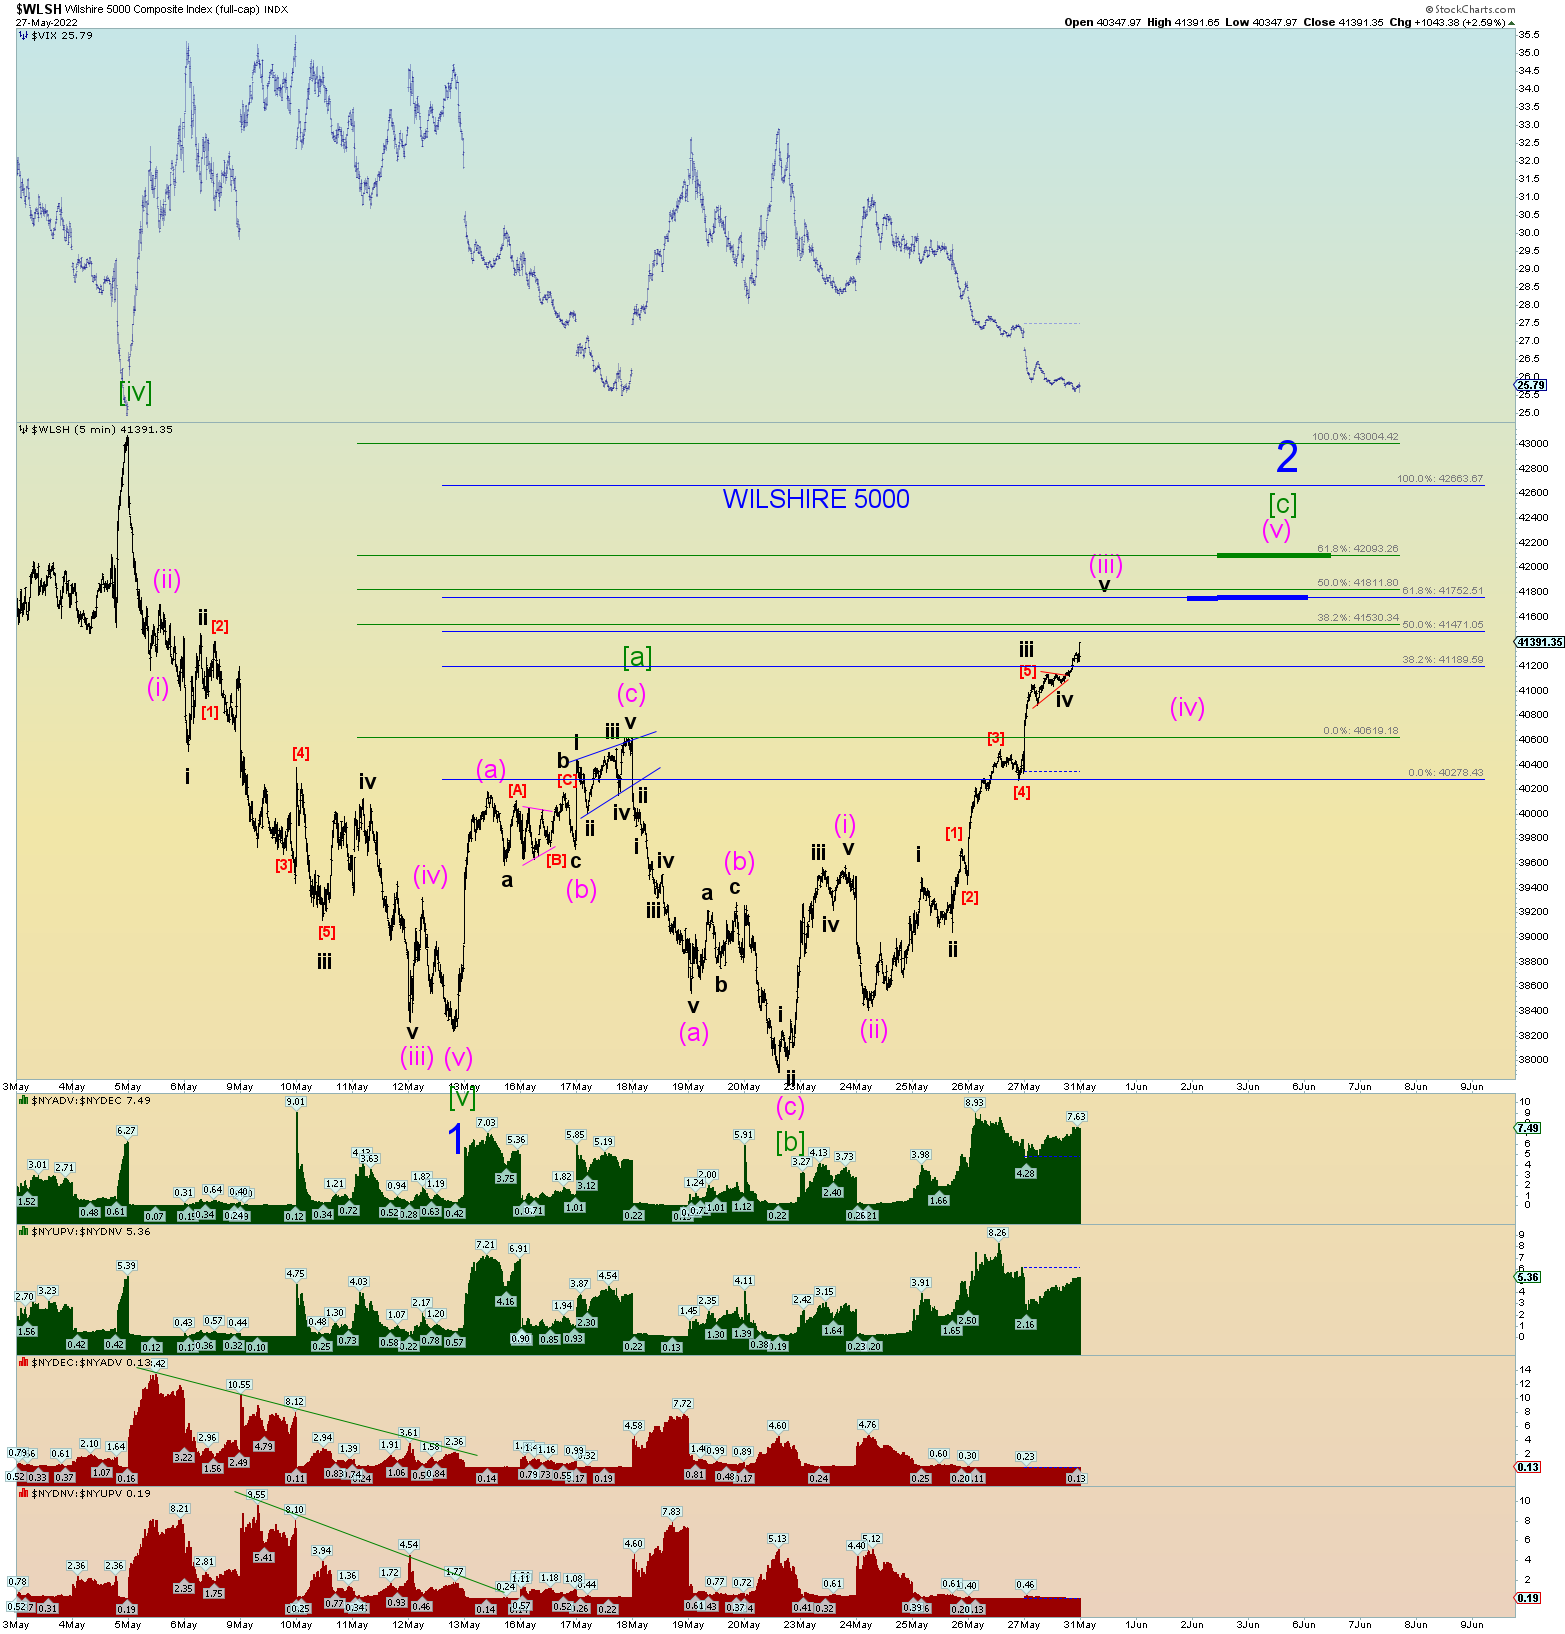
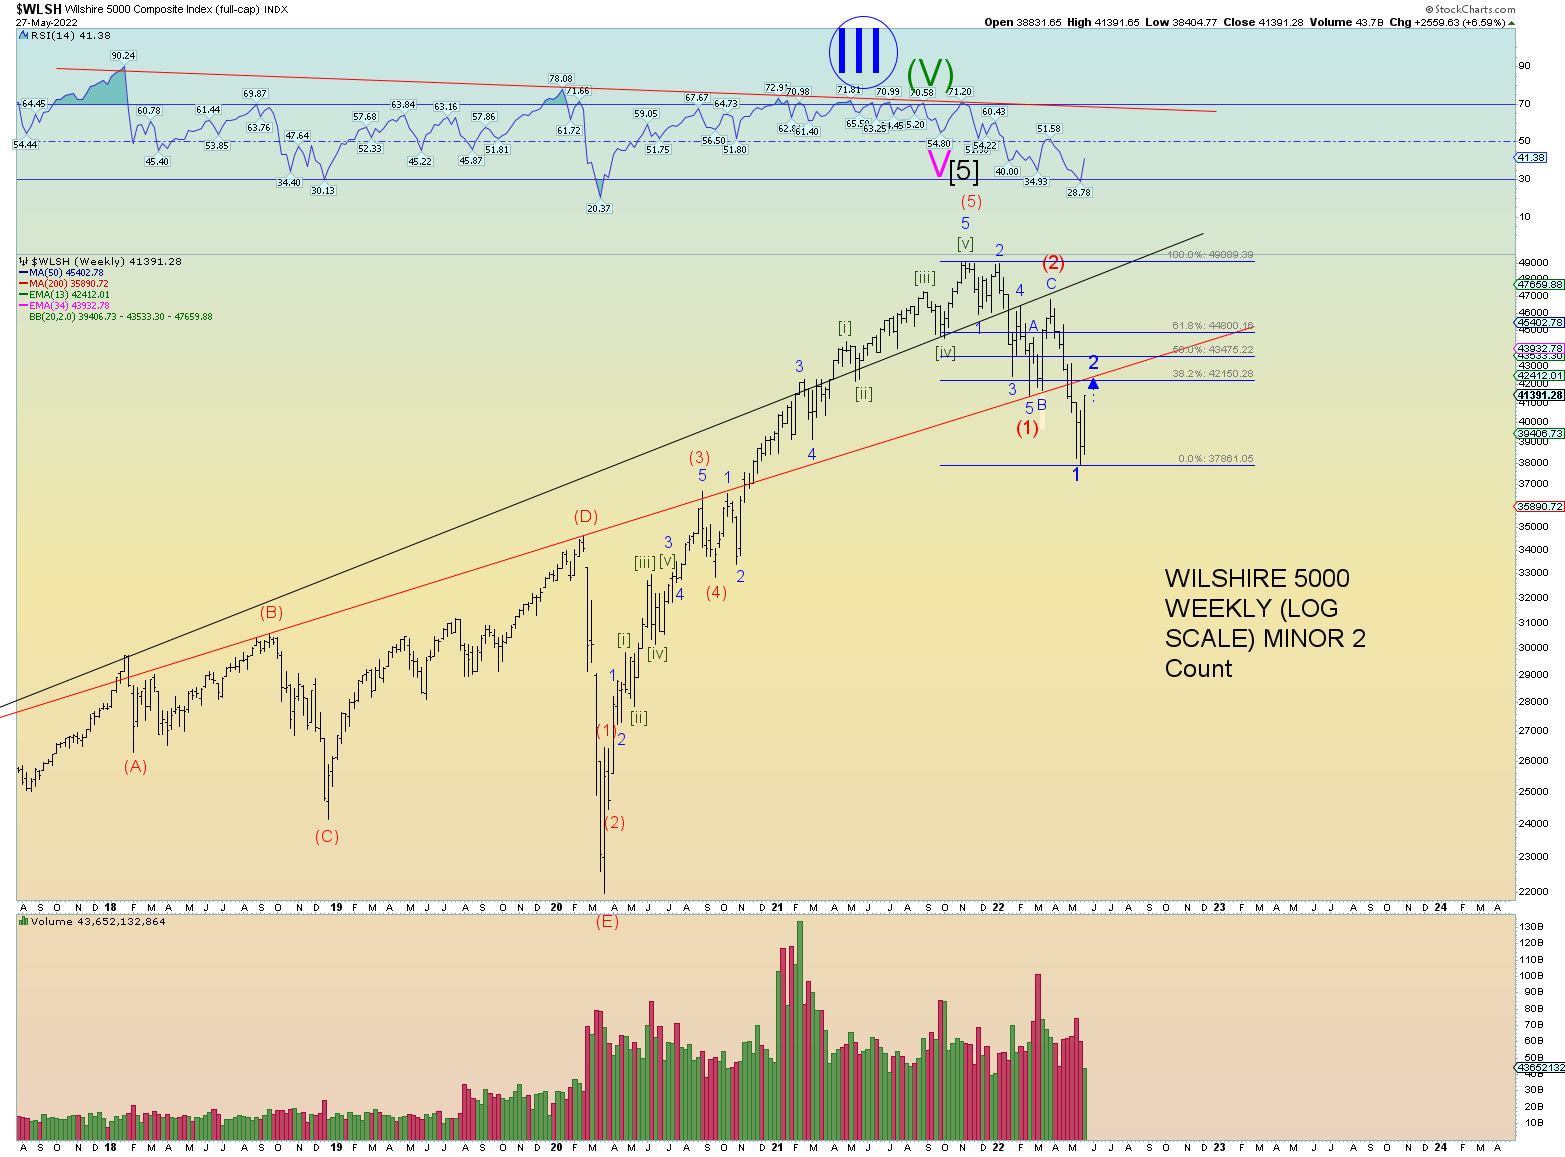
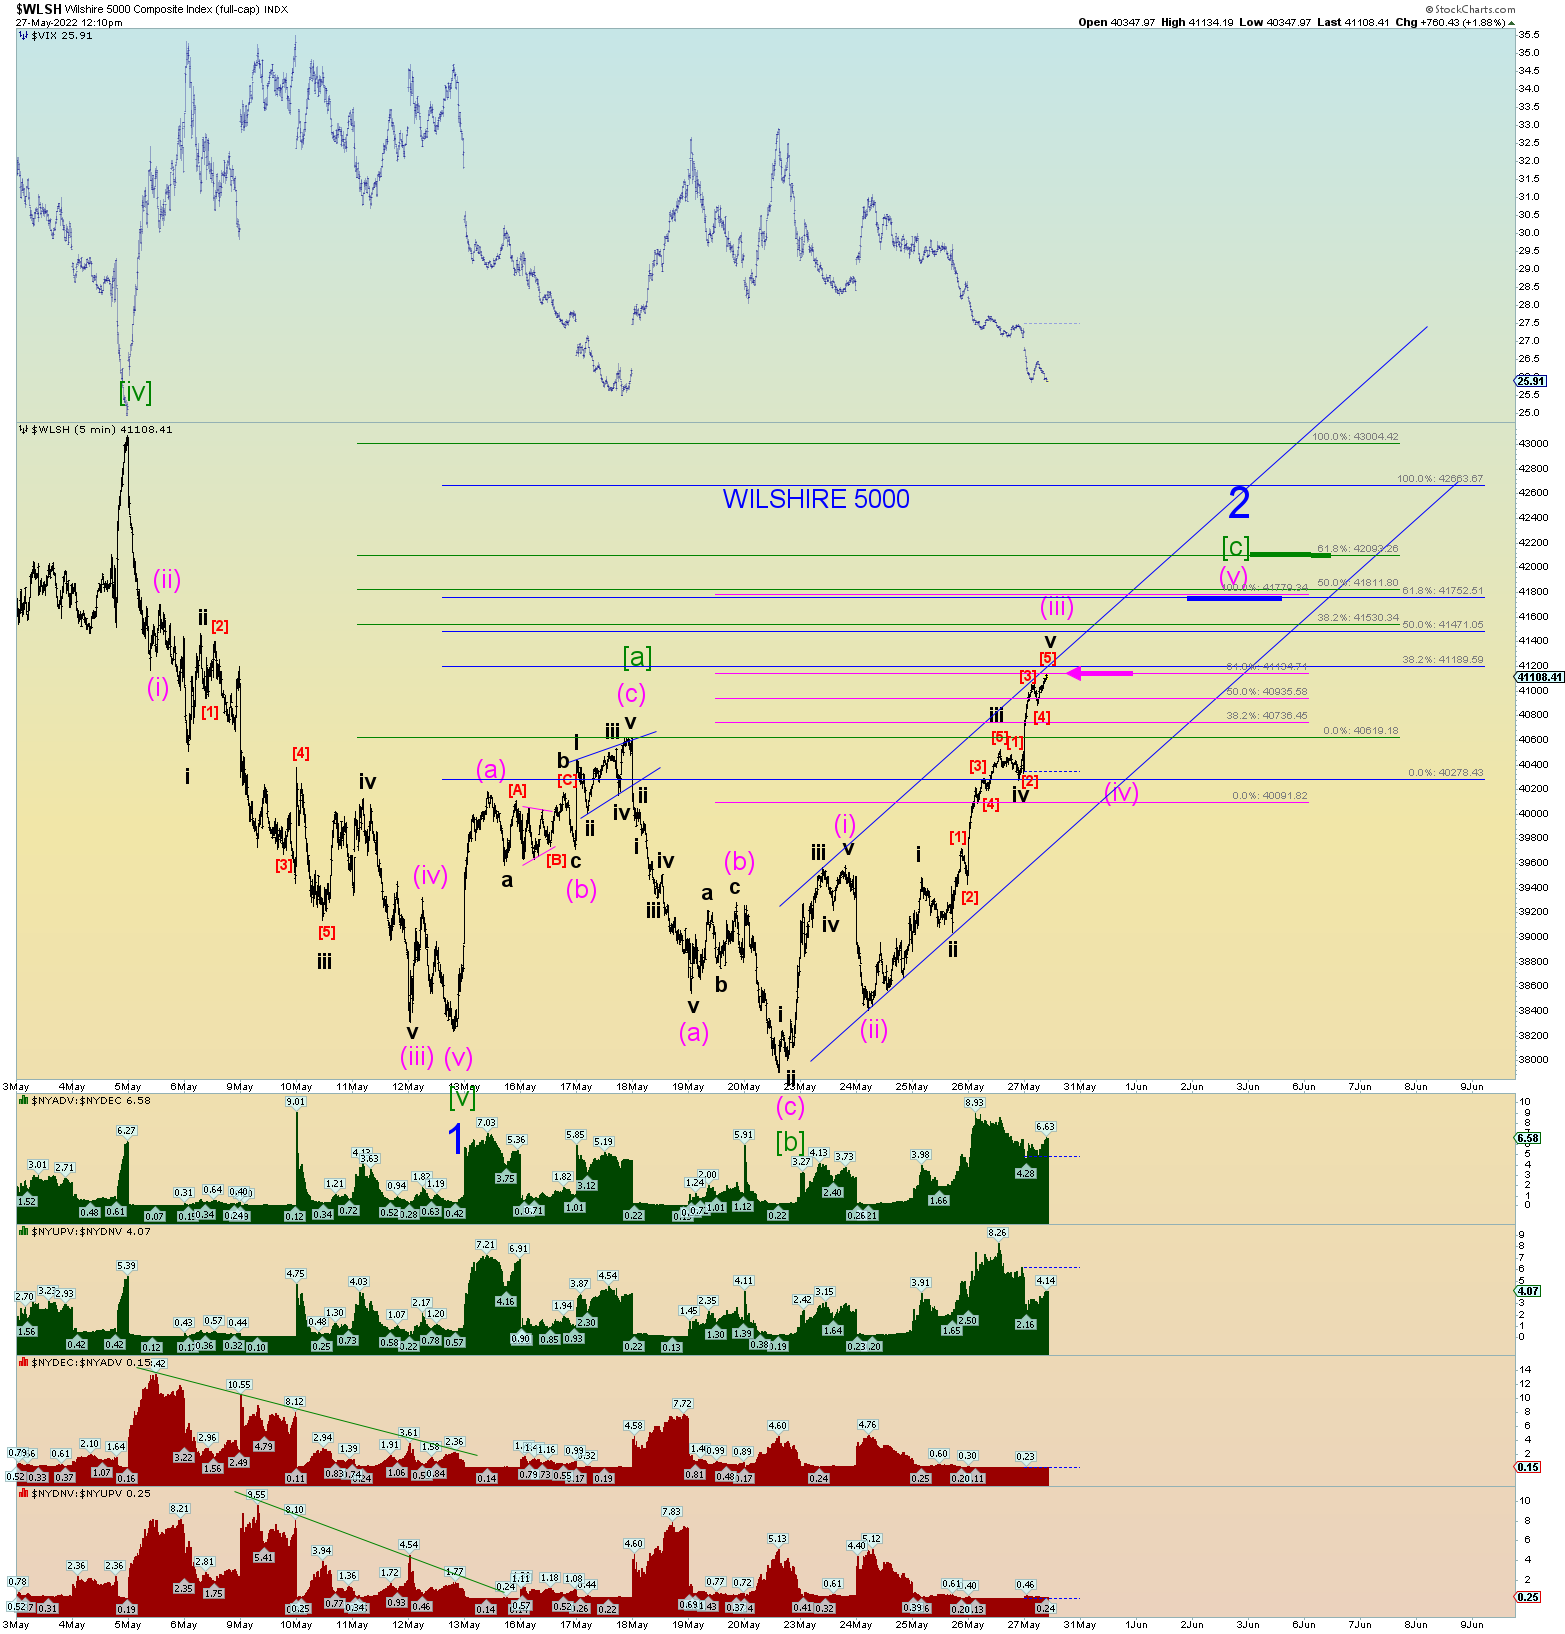
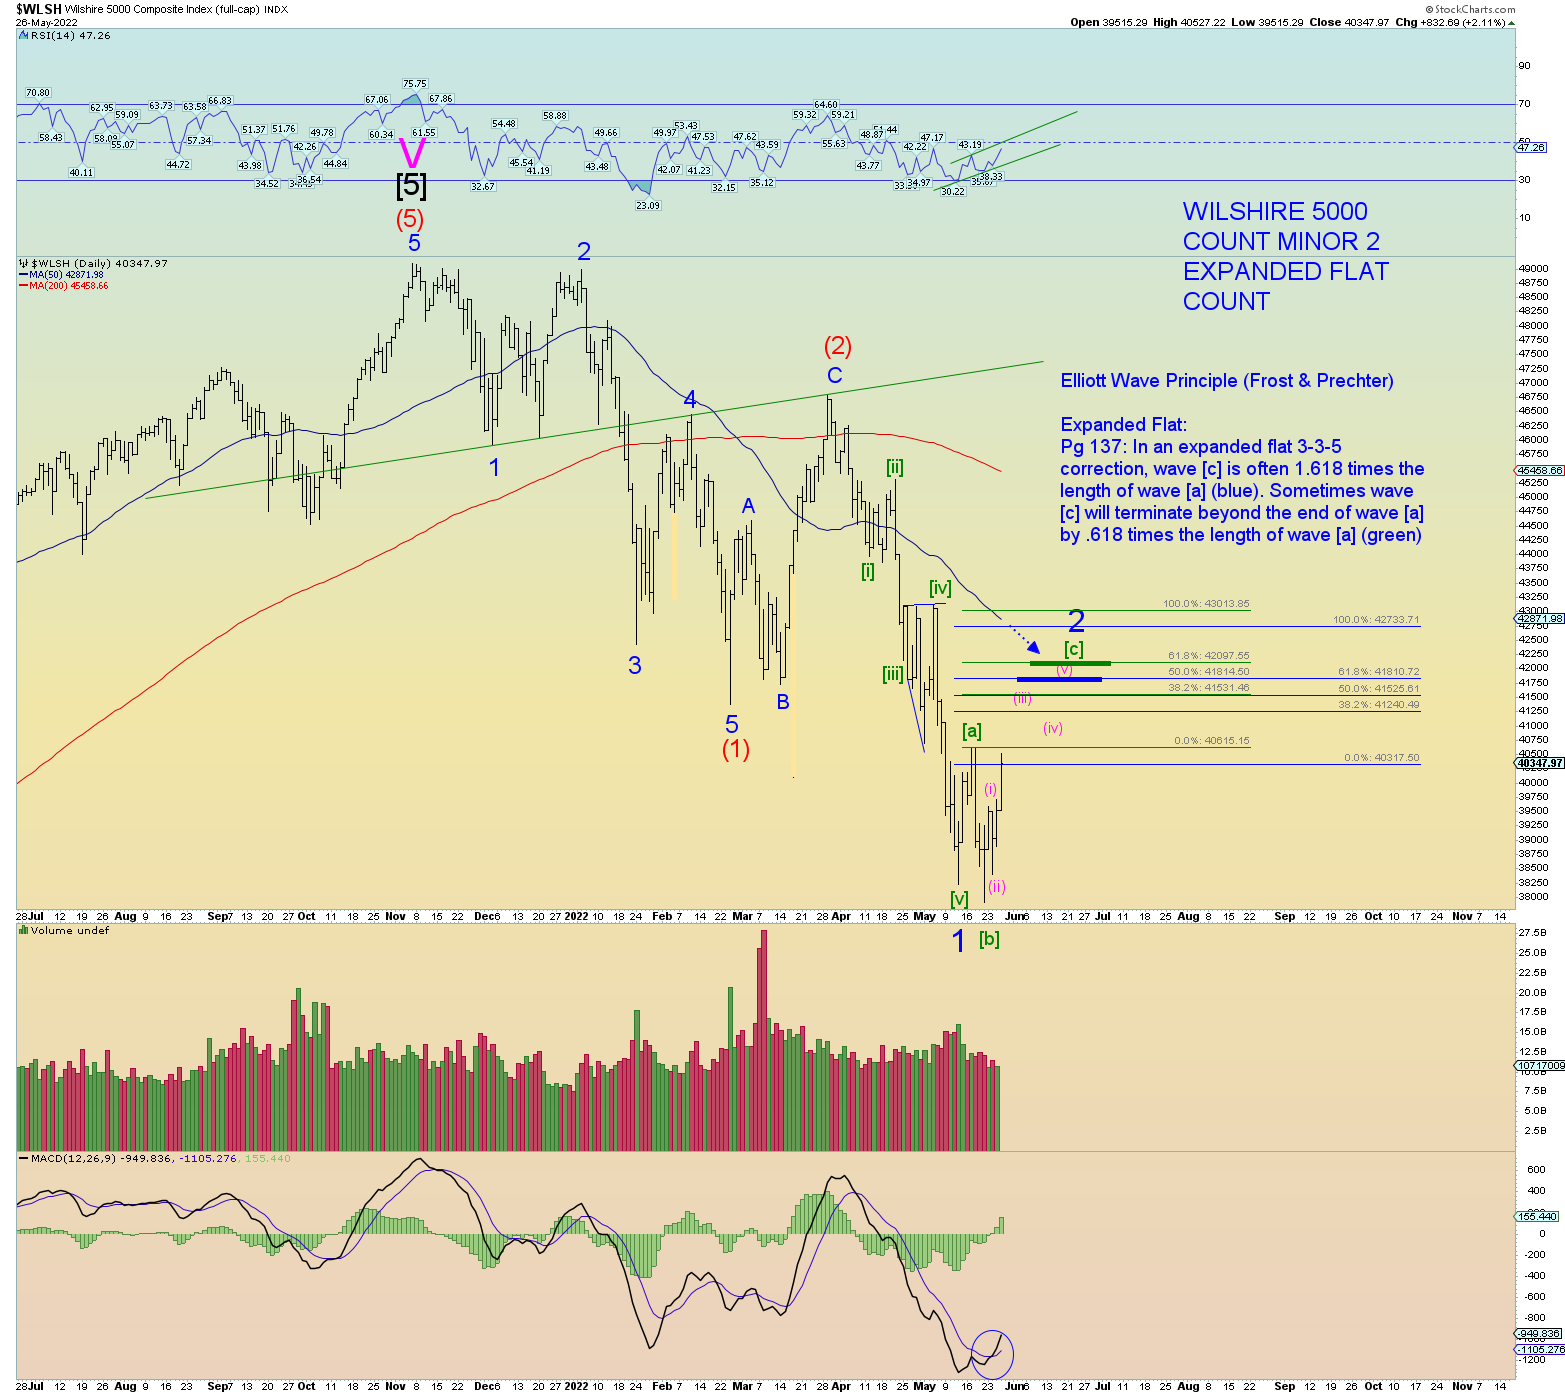
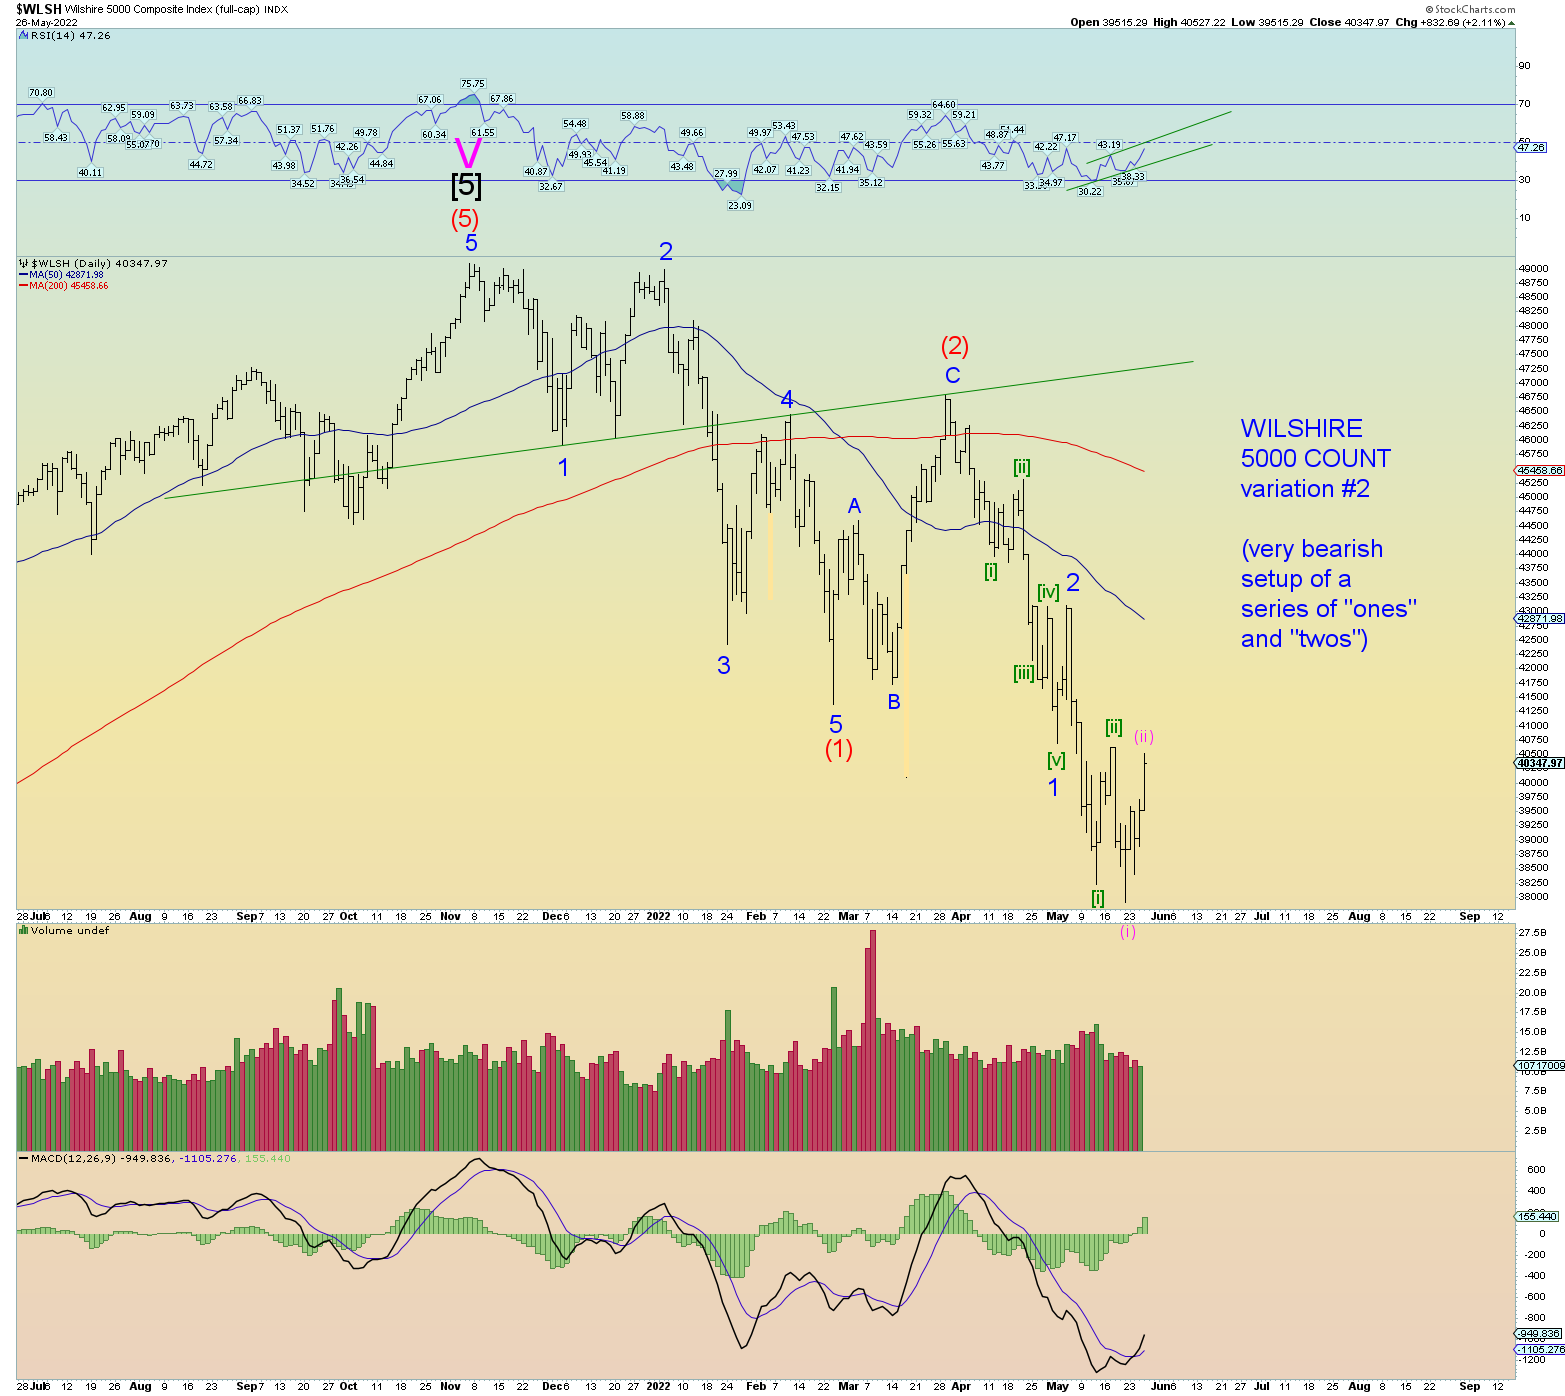
This one chart of the Wilshire 5000 tells the squiggle story at the moment. The previous numerous posts on other longer-term charts and projections show the potential of both the near term bullish and bearish cases so there is no need to repeat everything tonight.
The main point tonight is the main horizontal support line of the peak of Minute [a] of Minor 2 is what the “algos’ are looking at. And as always, the overnight futures having thin liquidity, pushing prices sharply one way or another.
Yes, they can manipulate the market, however, in the long run, they cannot. Social mood will take long term prices to where they go one way or another. You can have a Ponzi scheme for many years, but one way or another it will be found out. You can cheat God one way or another but some day you will reap what you have sown and pay the price of stealing from your future generations to come. That much is certain.
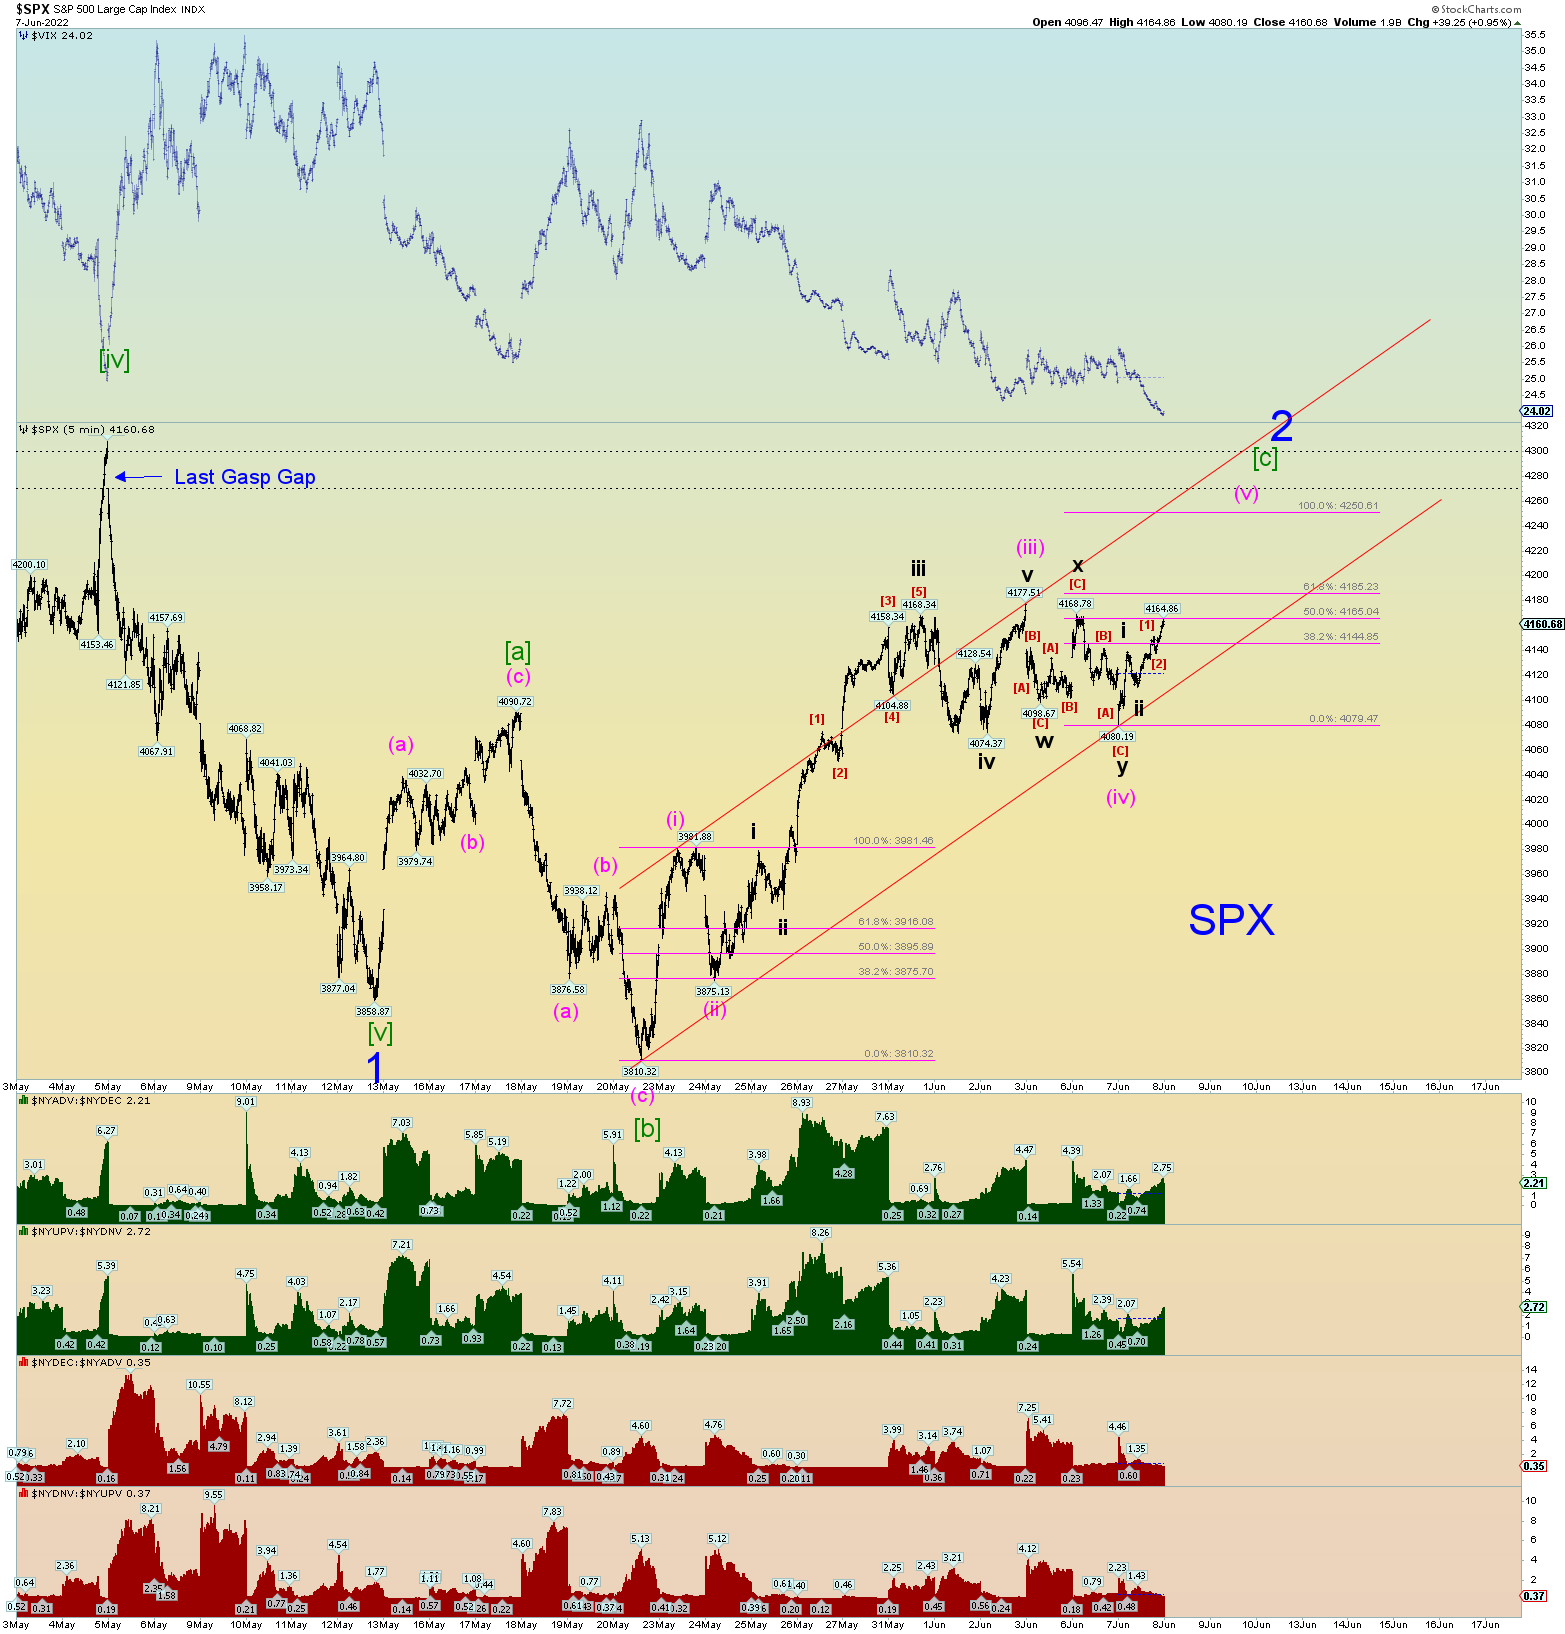
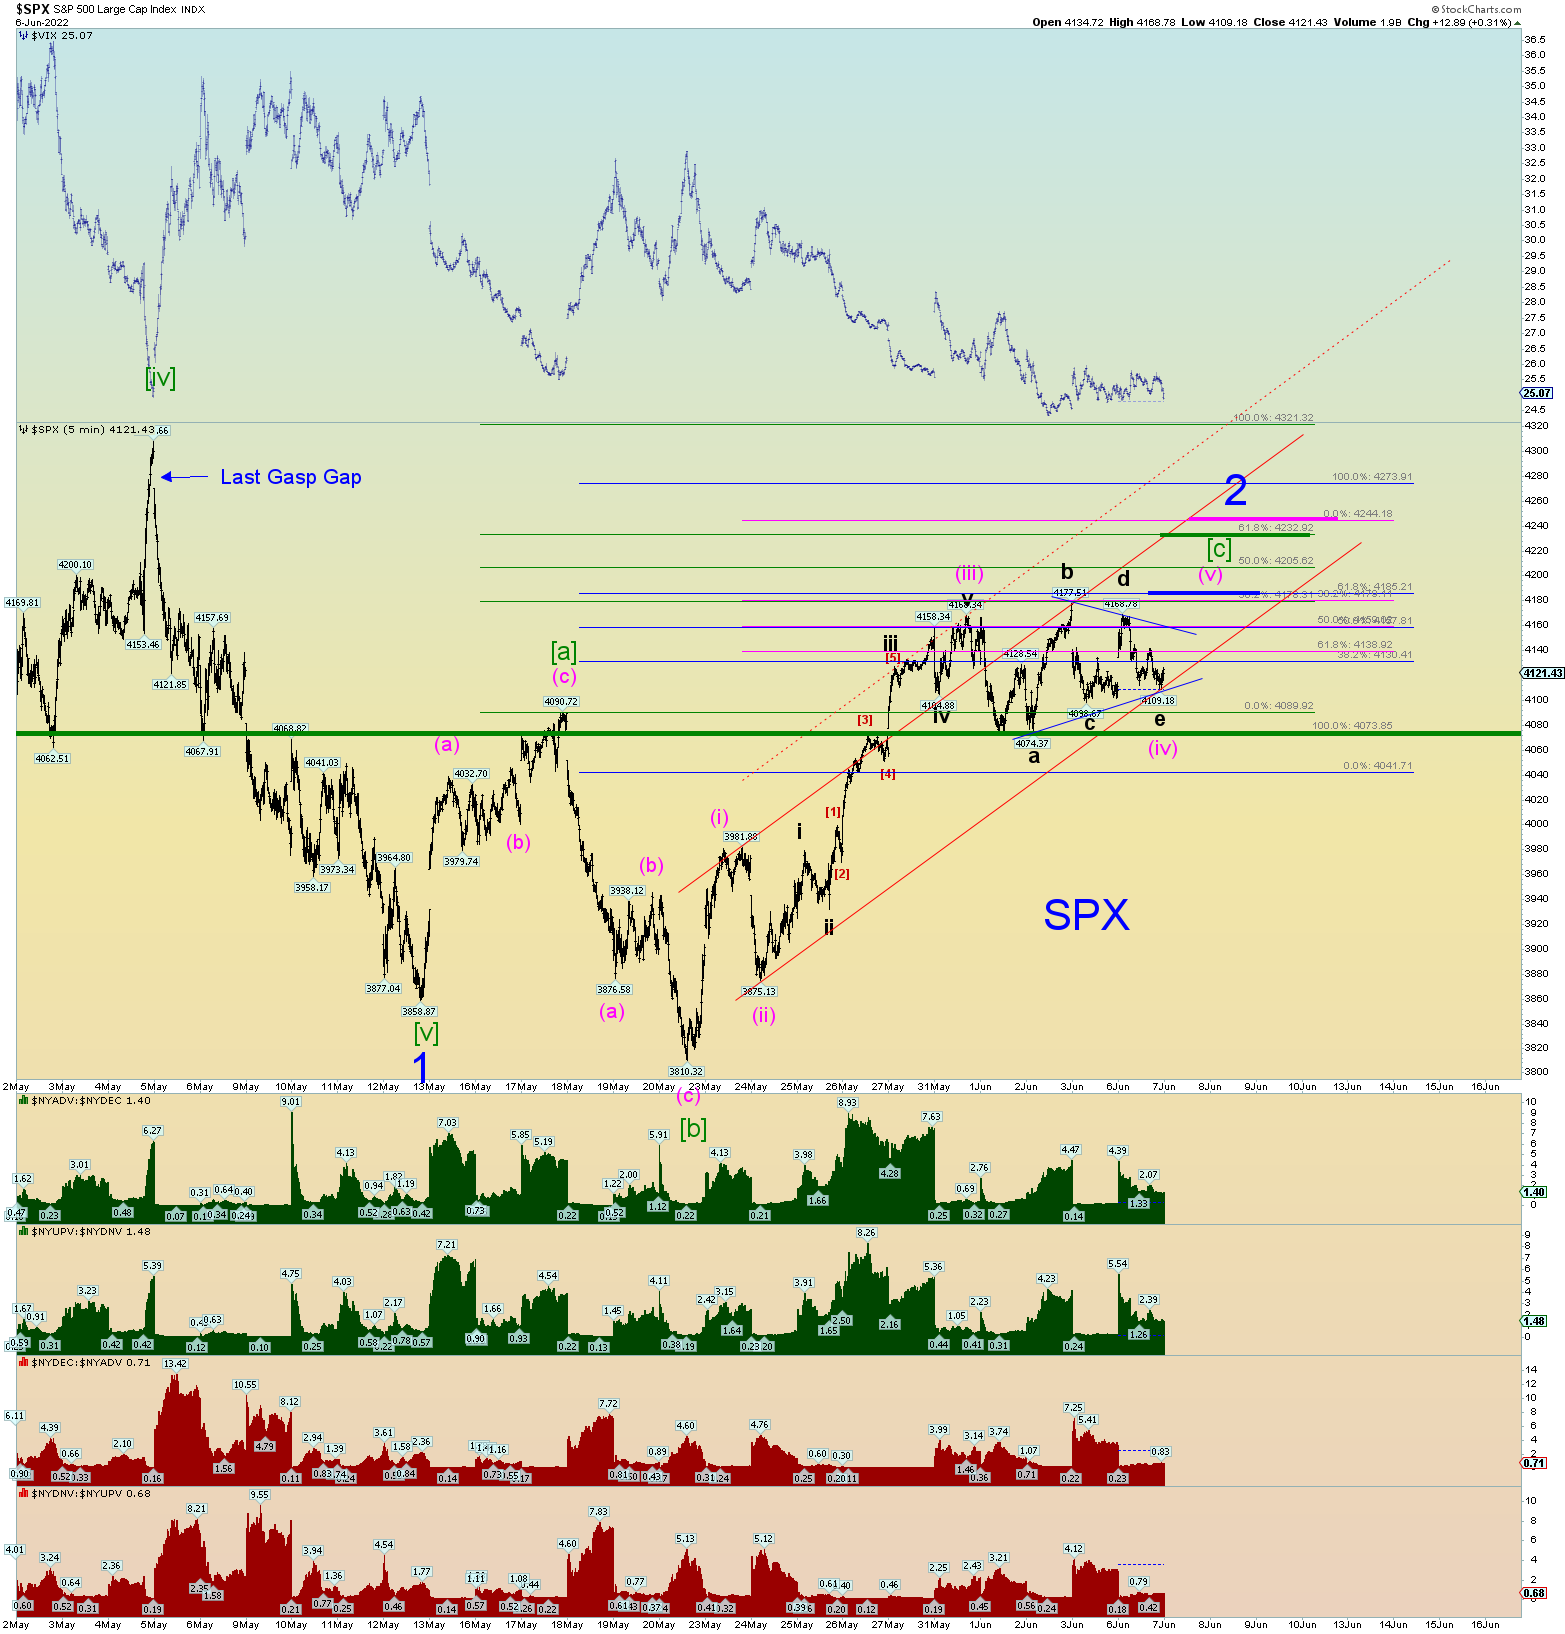
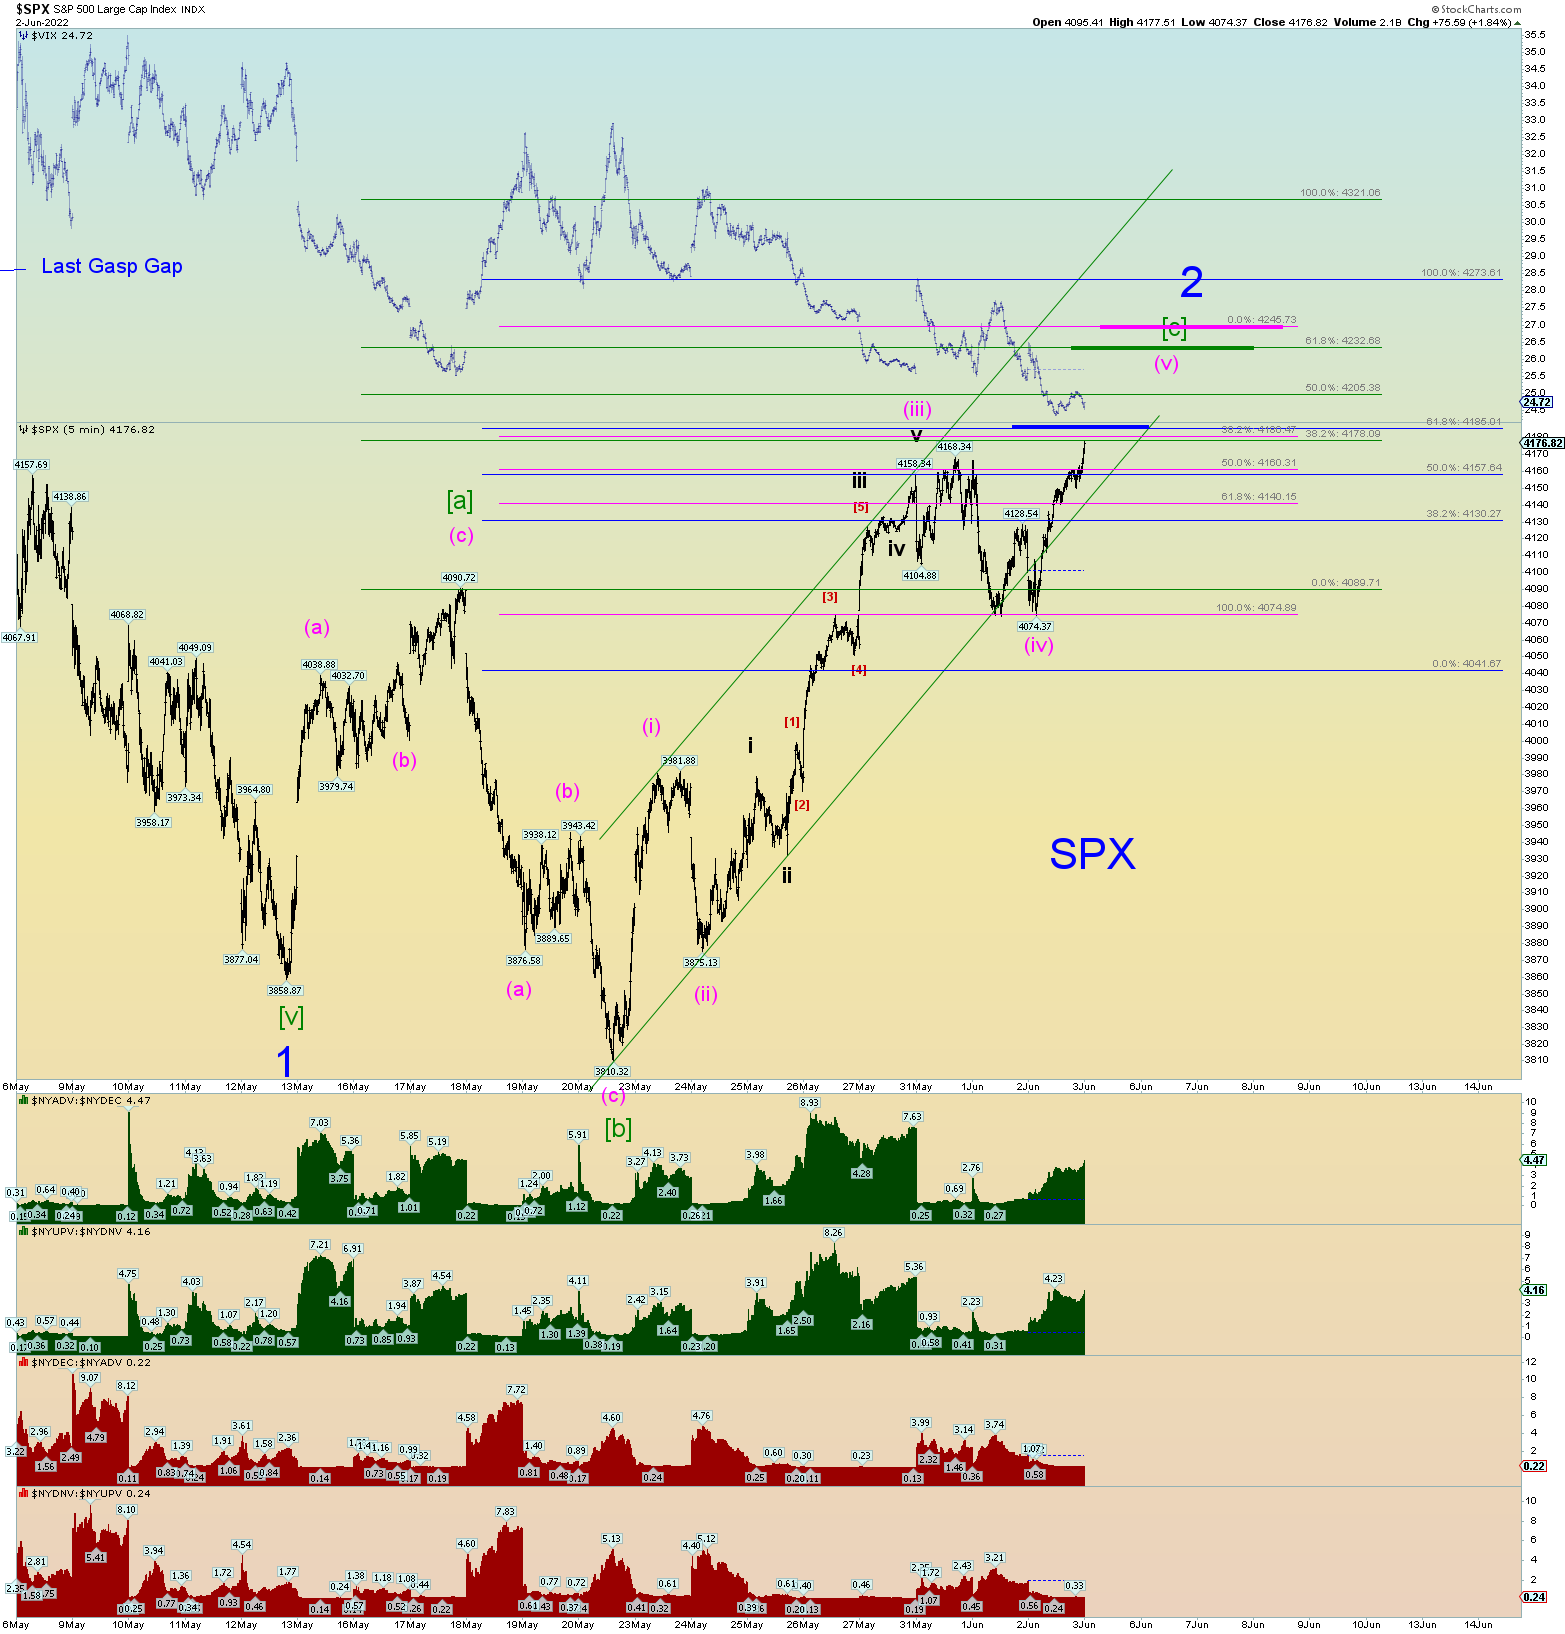
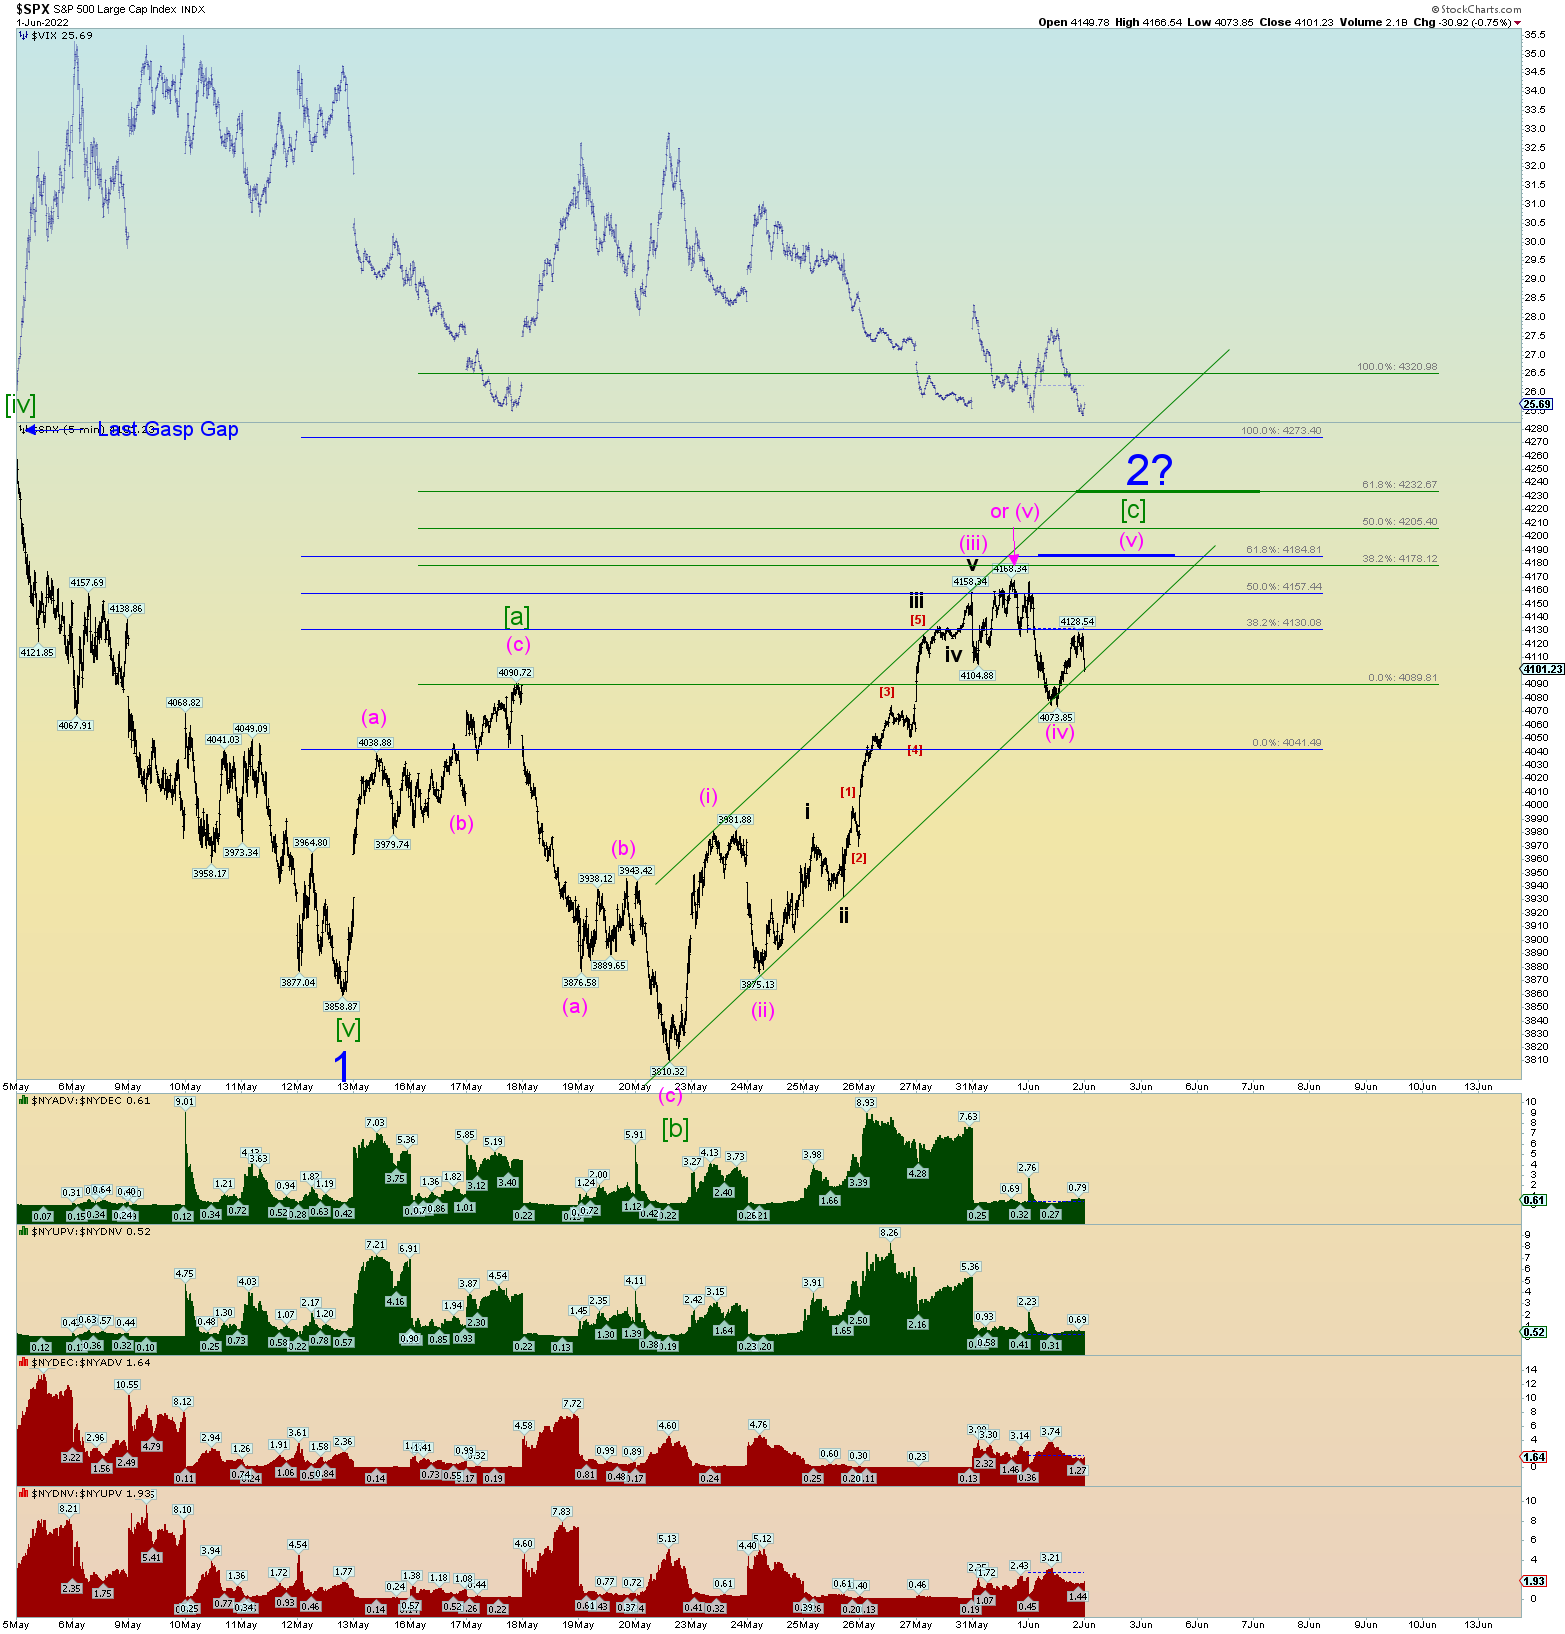
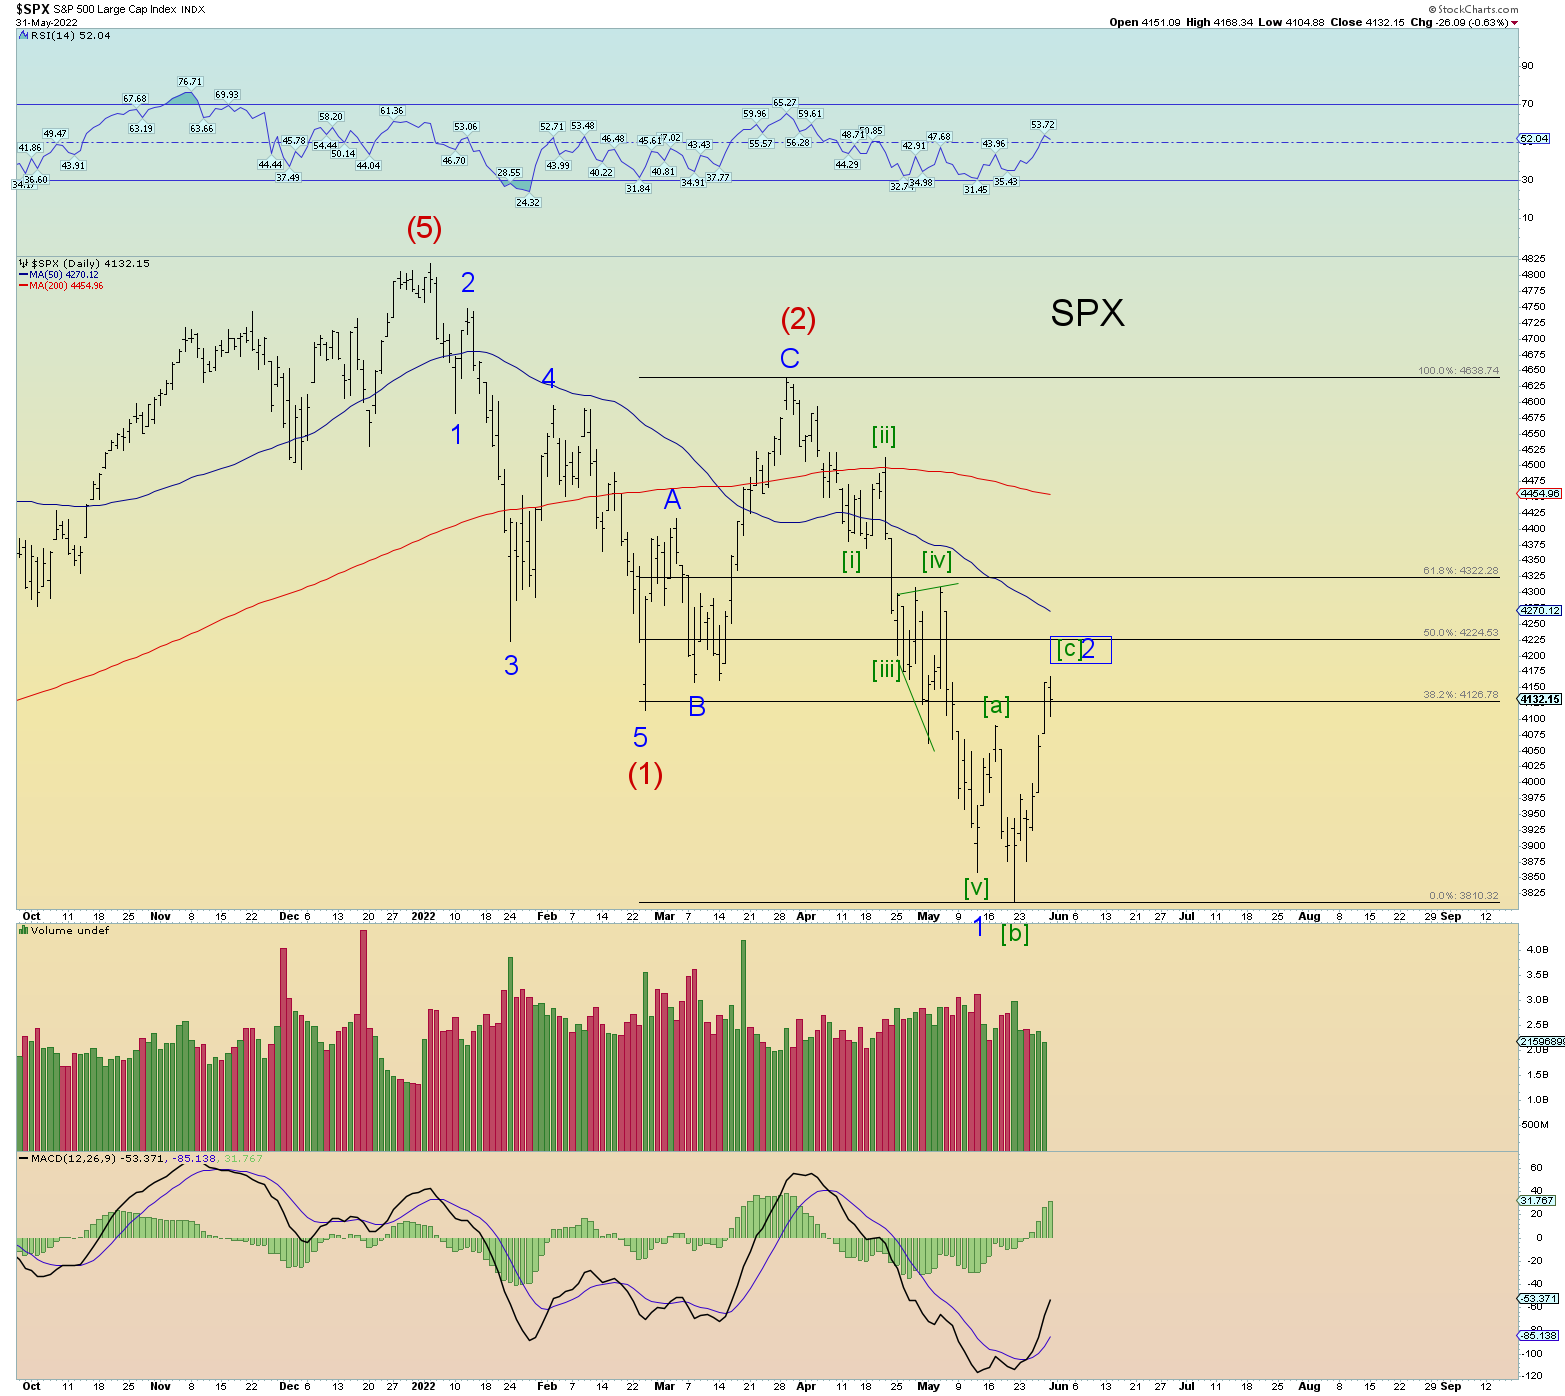
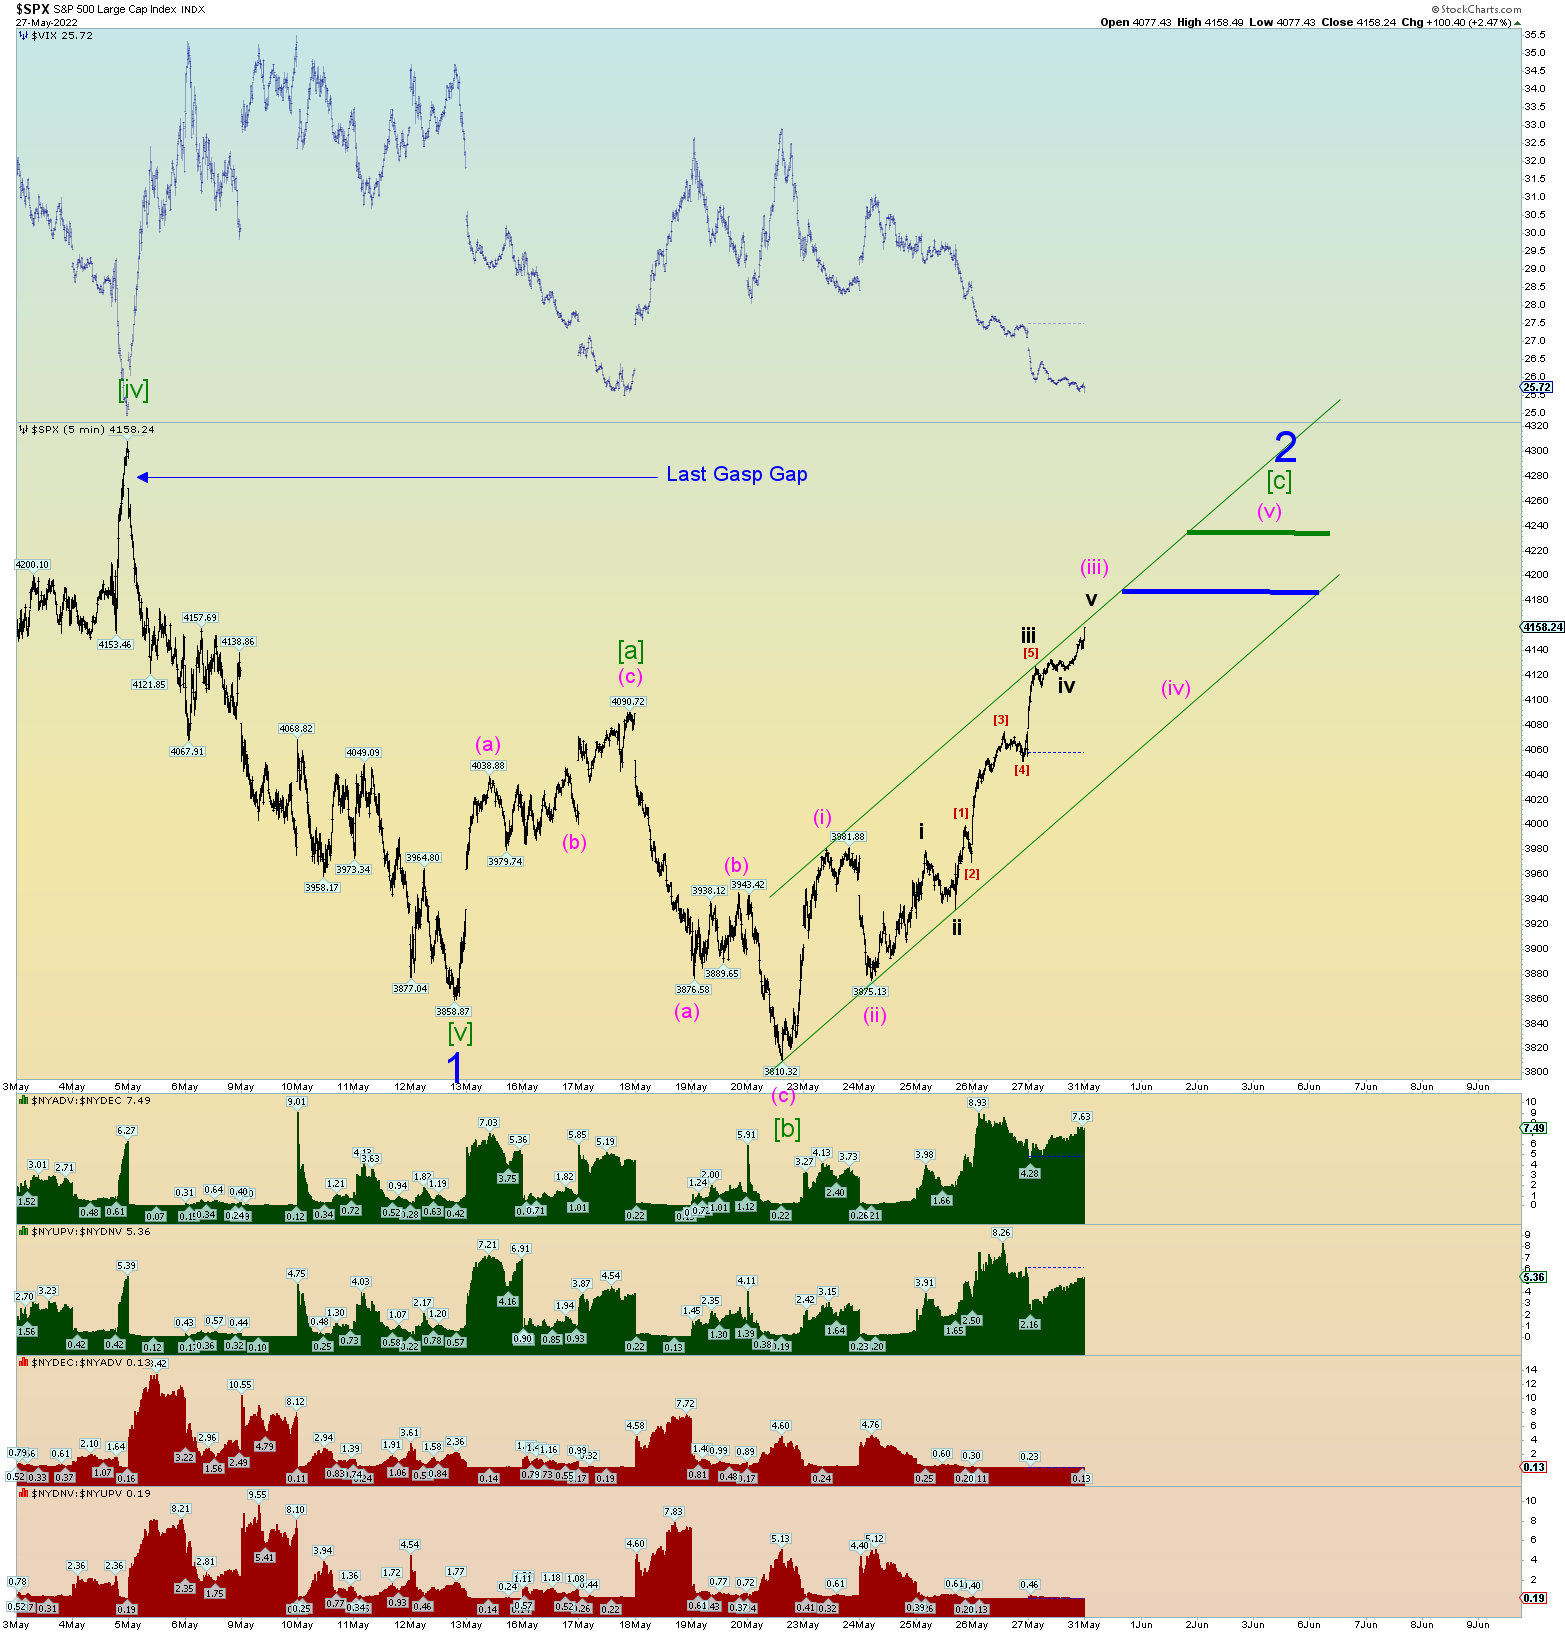
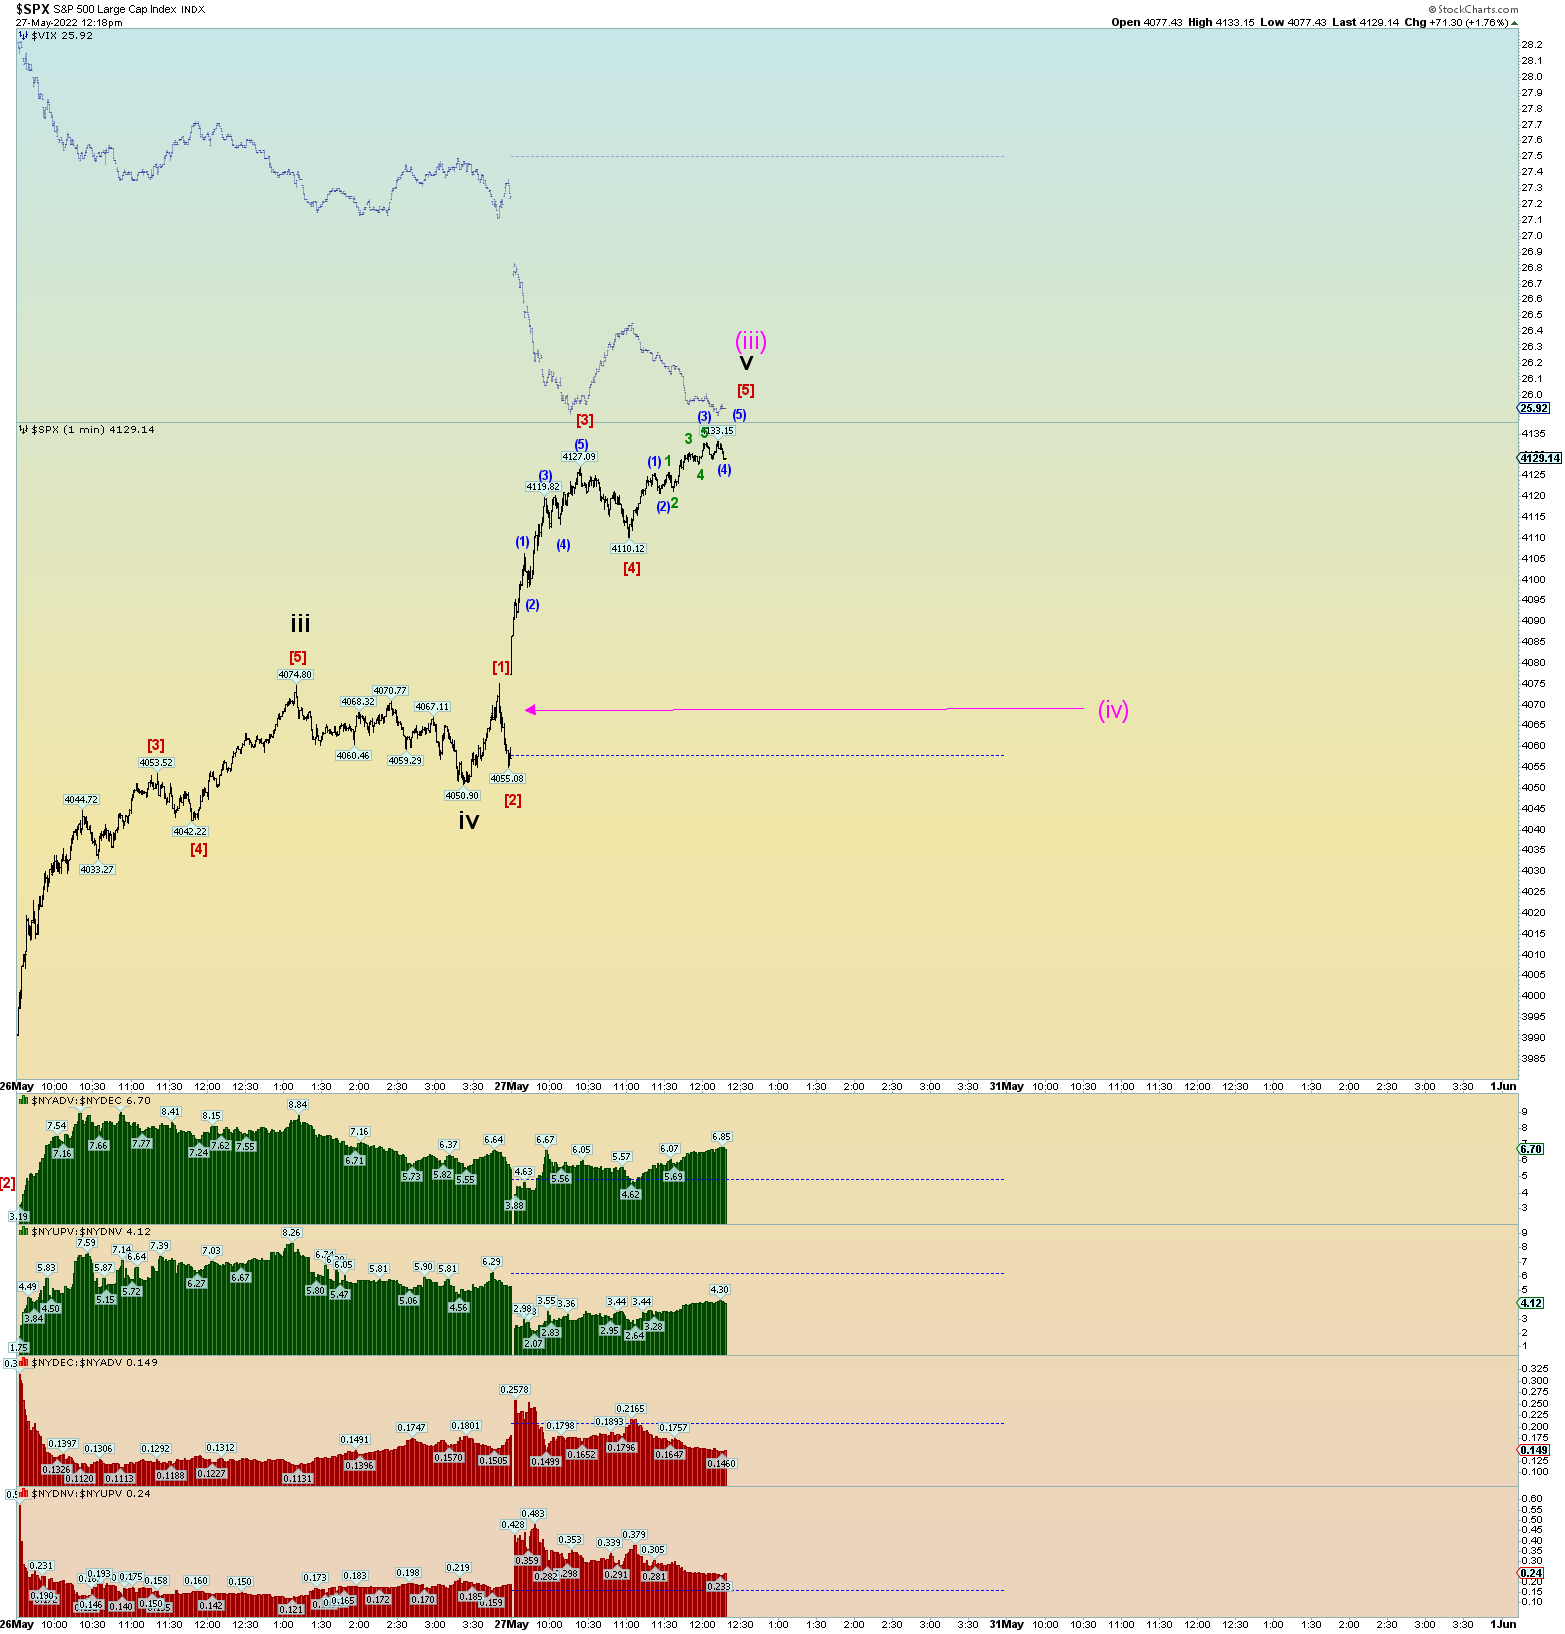
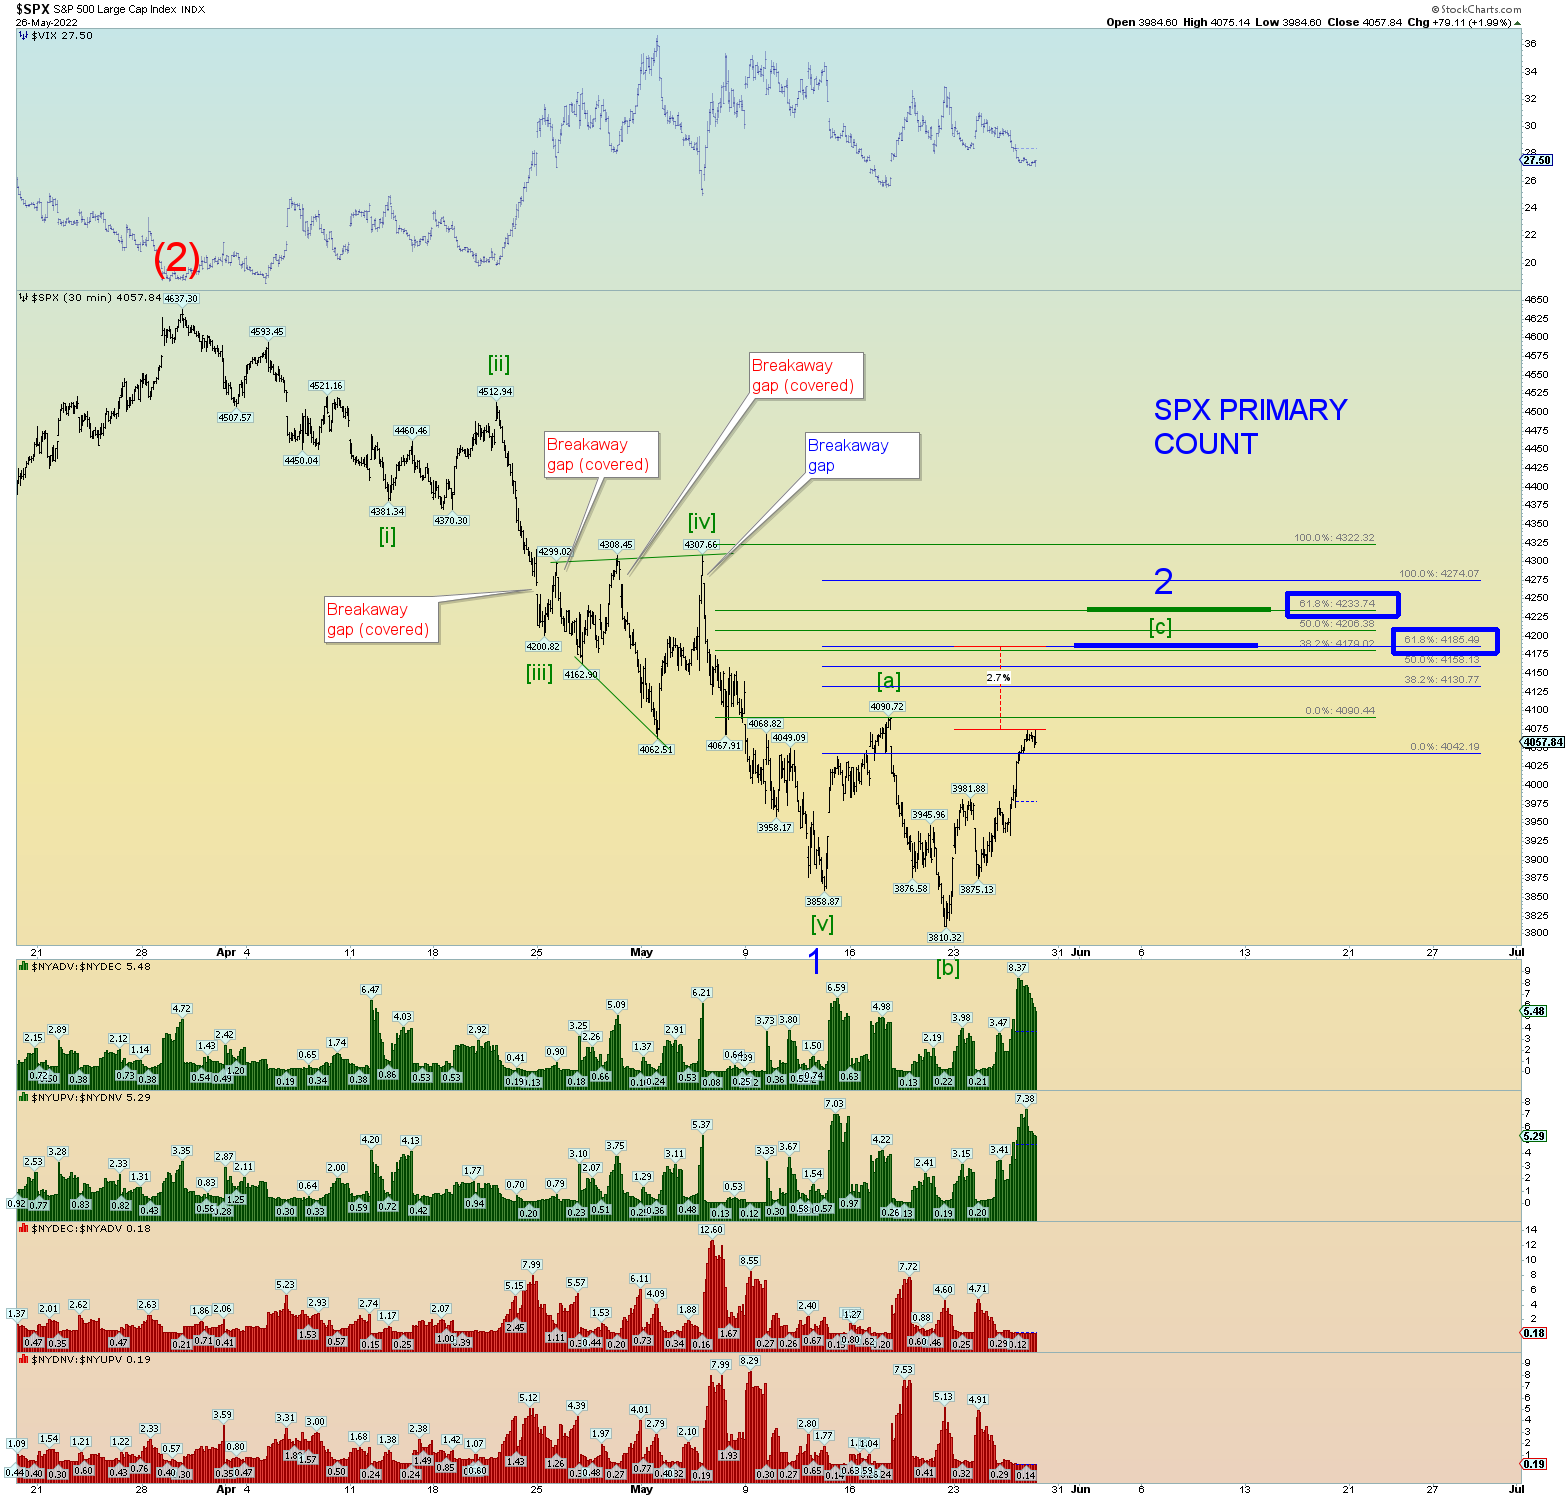
The SPX with the same count and target ranges. A stupidly big gap down which of course presents an “easy” target for the algos yet sometimes the market will do exactly the opposite.
At some point, if this is truly Minor 3 of Intermediate (3) down, you’ll wake up one morning at “limit down”. Many younger traders have never truly experienced a bear market before or the excitement of a limit down, but we are due sooner or later.
At some point a true bear market will cause all to lose hope and of course we are almost infinitely a long way from that point in time. The market has a lot of work to do to turn this Grand Supercycle of 240+ years into the worst social mood downturn since the Dark Ages.
There is a lot of variation between indexes. Negative divergences existed between the top(s) in Nov 2021 and early January 2022. The main reason I track primarily the Wilshire 5000 is because it lies the least. It is the total U.S. market which, in the scheme of things, is the only thing that matters.
Once in a while I’ll throw in an SPX chart here and there, but the algorithms of today’s highly watched, and computer traded indices become somewhat self-fulfilling in a sense. The DJIA, the SPX (SPY), e-minis futures, the COMP, the NDX, even the Russell 2000, these are all highly watched and traded markets via algorithms and have, as a result, become the least predictive Elliott Wave structure overall. For example, how many algorithms have given hefty weight and programmed with “gap trading” in mind?
But no one really trades the “total market”.
My point is thus: If the Wilshire 5000 had been the “key” market index to trade, the “pros” would have done it decades ago, made a highly traded index to exploit it, and based technical analysis around it. There is something tempered about trying to manipulate the entire (for the sake or arguing) tradable index of the United States. If it had been “manipulative” they would have done it by now. But of course, they break the market into “segments”; and abuse these gyrations and programmed the computer algorithms to react or not react based on a myriad of micro information passing over the “news ticker” at every waning moment. Chop up the market, and it can be manipulated all the easier.
But the thieves of Wall Street generally shun the “total market” because it cannot be manipulated as the sub-segments are. Therefore, they shun and bury the Wilshire 5000.
But I postulate that they have actually done the opposite in secret. That they actually use the Wilshire 5000 (or some other such total market measure) in the algorithm programming and adhere perfectly to predicted wave patterns, channel and trendlines of all various sorts. I of course cannot prove this, but the result of market moves manifest in the output of the Wilshire 5000 chart. The Wilshire 5000 adheres the best to Elliott Wave structures.
For instance, the SPX made a new all-time high in January and the Wilshire 5000 (its closet cousin) did not. This was a major negative divergence over a span of 2 months, and it mattered. The aftermath resulting total market breakdown followed.
So, what is my point? One point is this: pay attention to the total market moves as expressed in the Wilshire 5000 and its overall pattern, its channel lines, its trendlines. At this extremely volatile junction, it tells the least lies. It makes the best channels, trendlines, and other finely tuned price targets and pivots.
Remember, Elliott Wave theory is based on somewhat absolutes. For instance, wave two cannot go beneath in price the start points of a wave one. It is the hardest of rules and forbidden. And when one views these small variations between two “cousin” indexes, you can glean some useful information perhaps.
But I digress and you get the point.
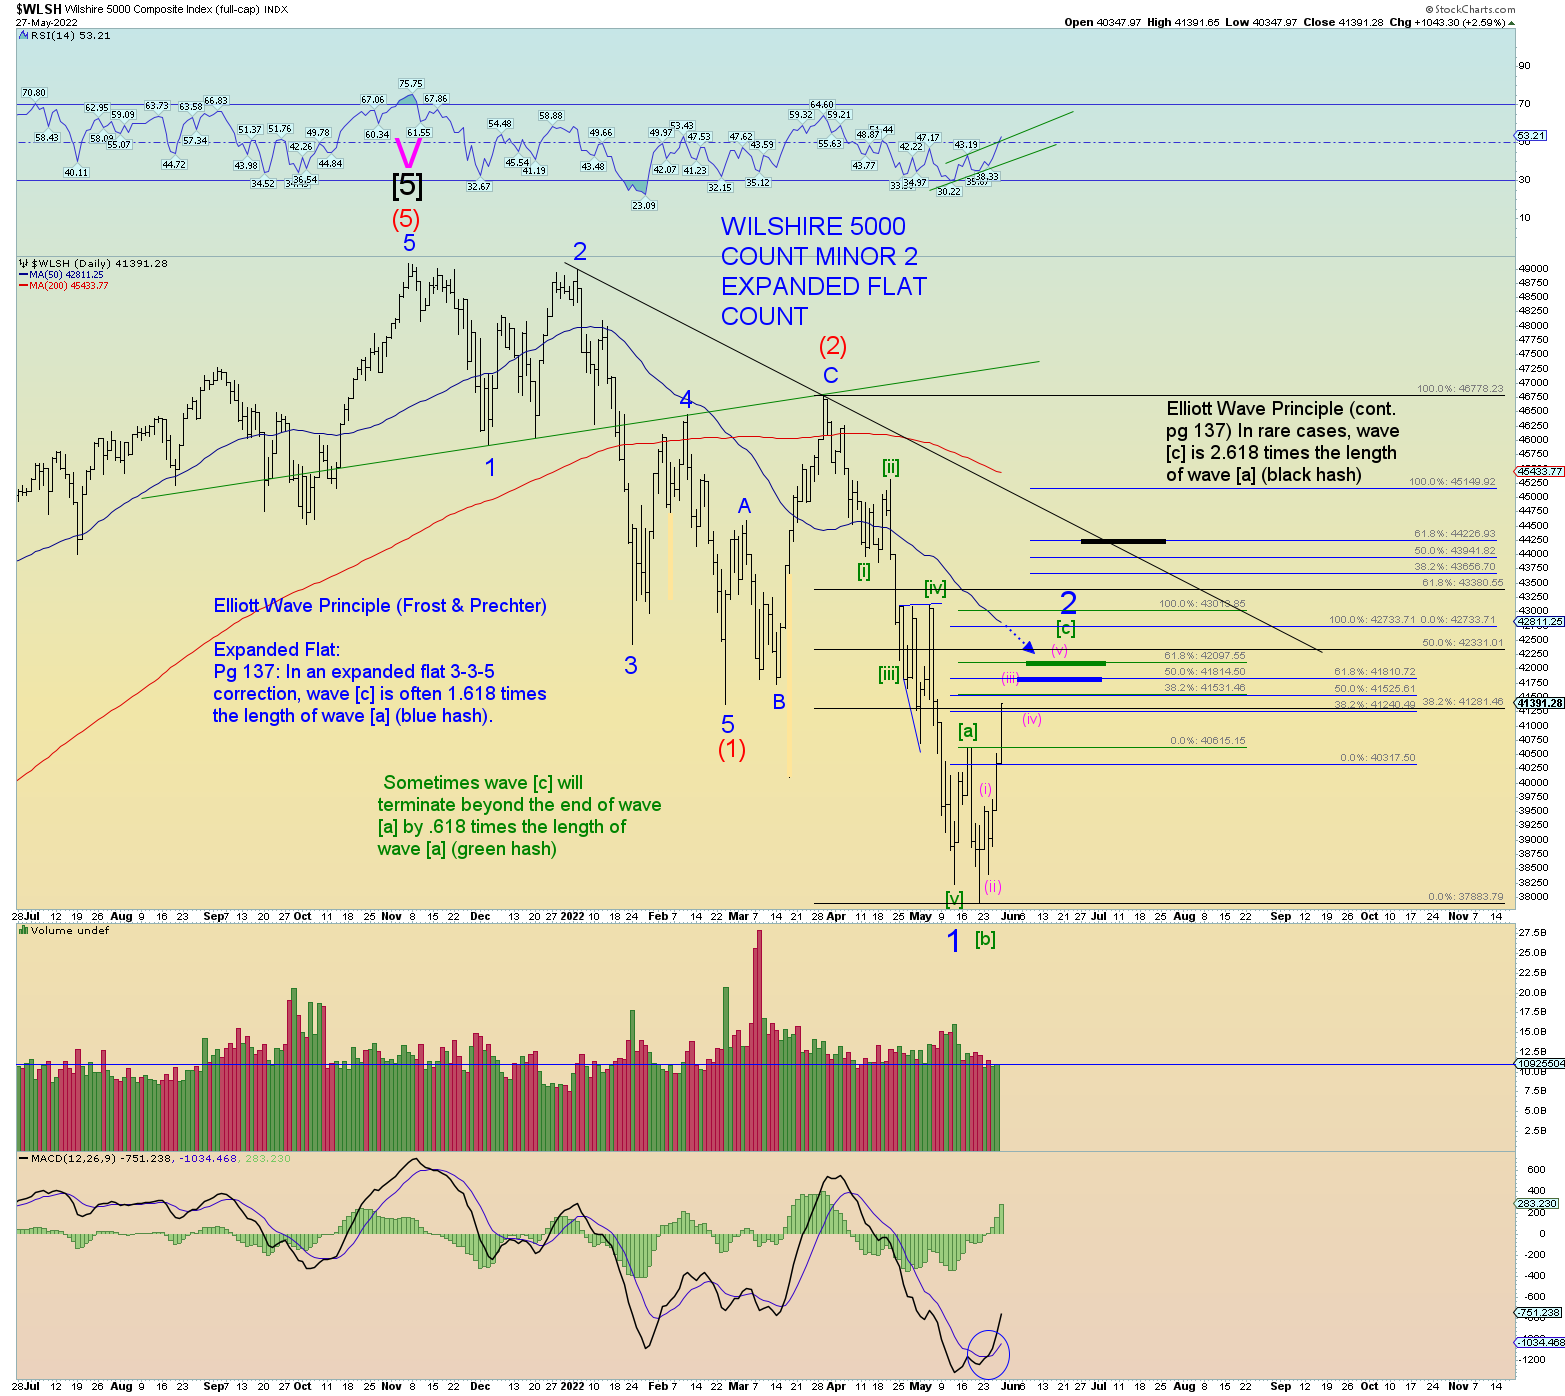
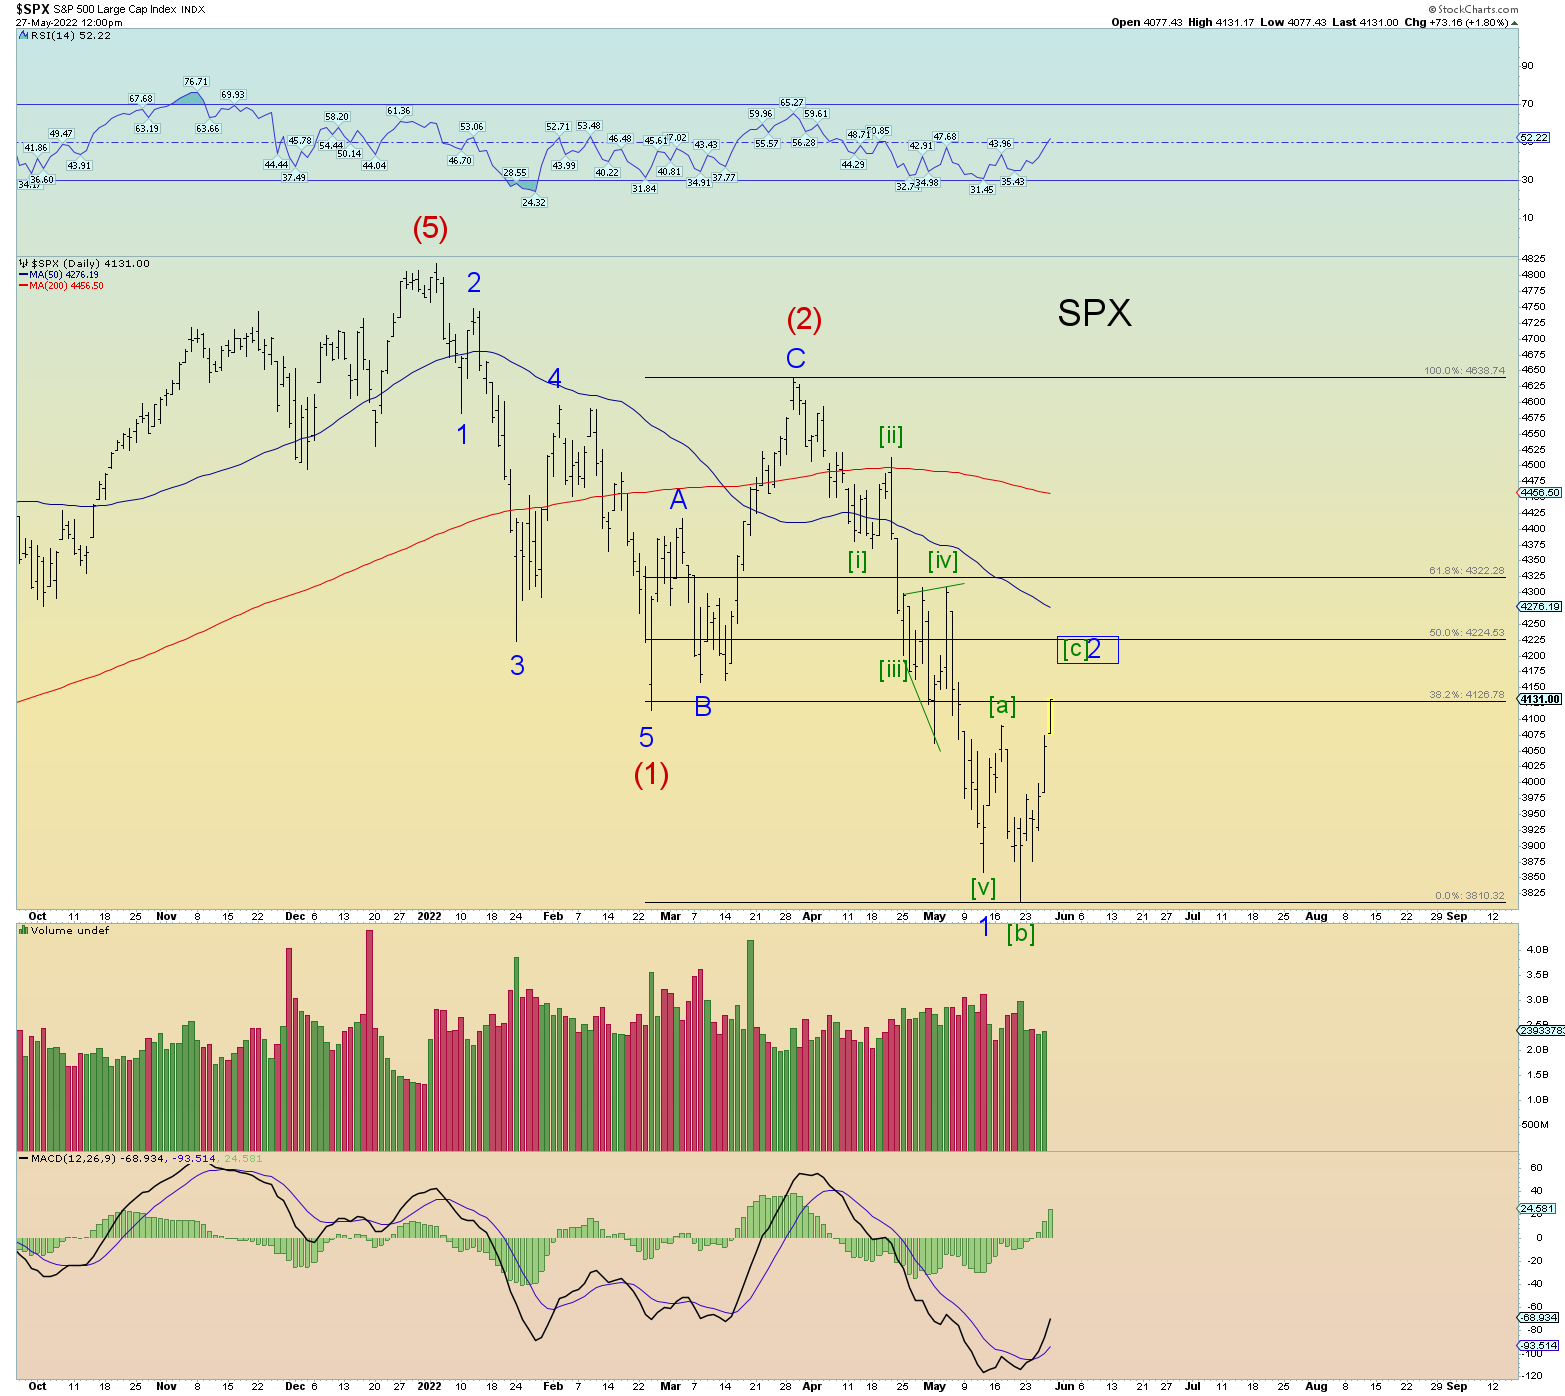
The best count has the total market approaching its ideal Minor 2 target range. I added a third target range based on the short-term structure of wave [c] of 2.
Here is a small example of how the SPX differs slightly with the Wilshire 5000 and perhaps is telling a diverging story. Today’s SPX low surpassed yesterday’s low yet the Wilshire did not. These are subtle clues. (Of exactly what is why we count squiggles)
Still would like that backtest of the Wilshire weekly. Coming closer.
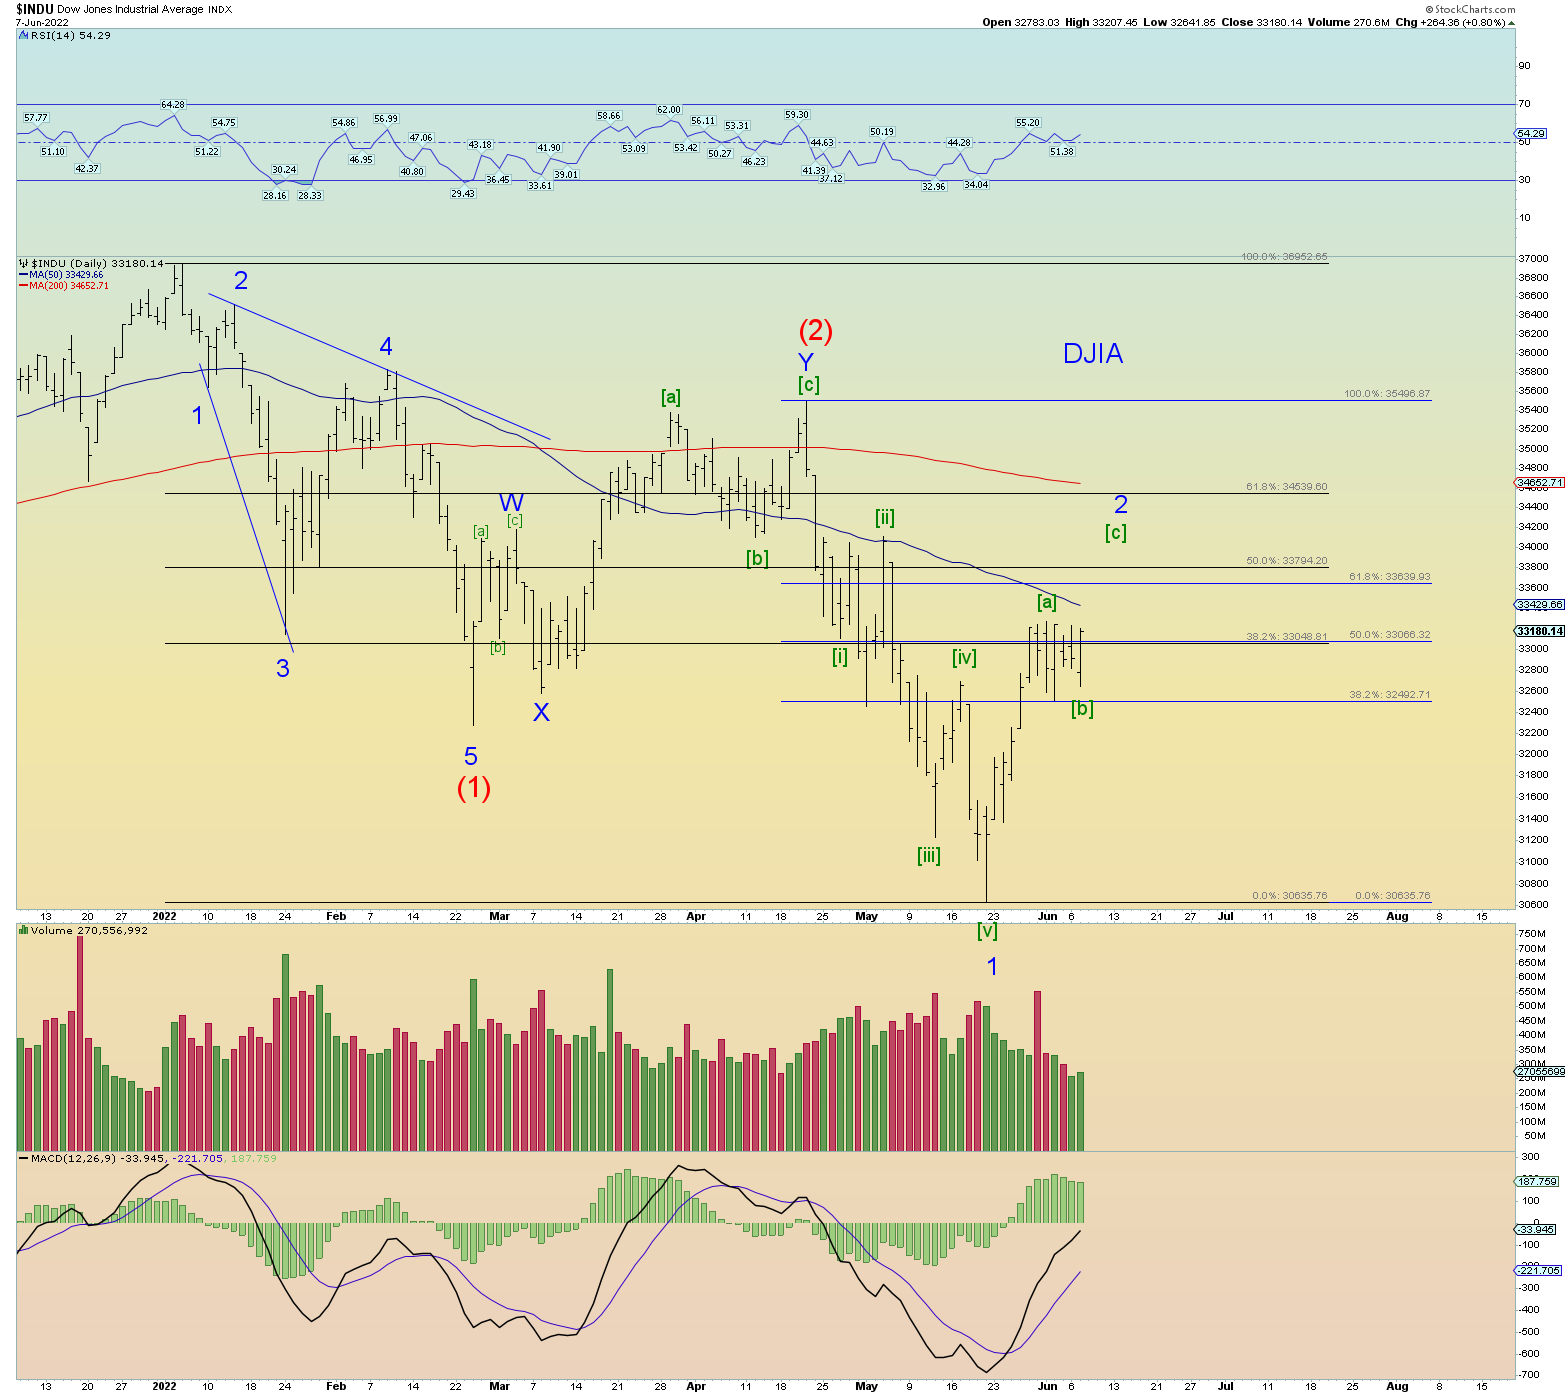
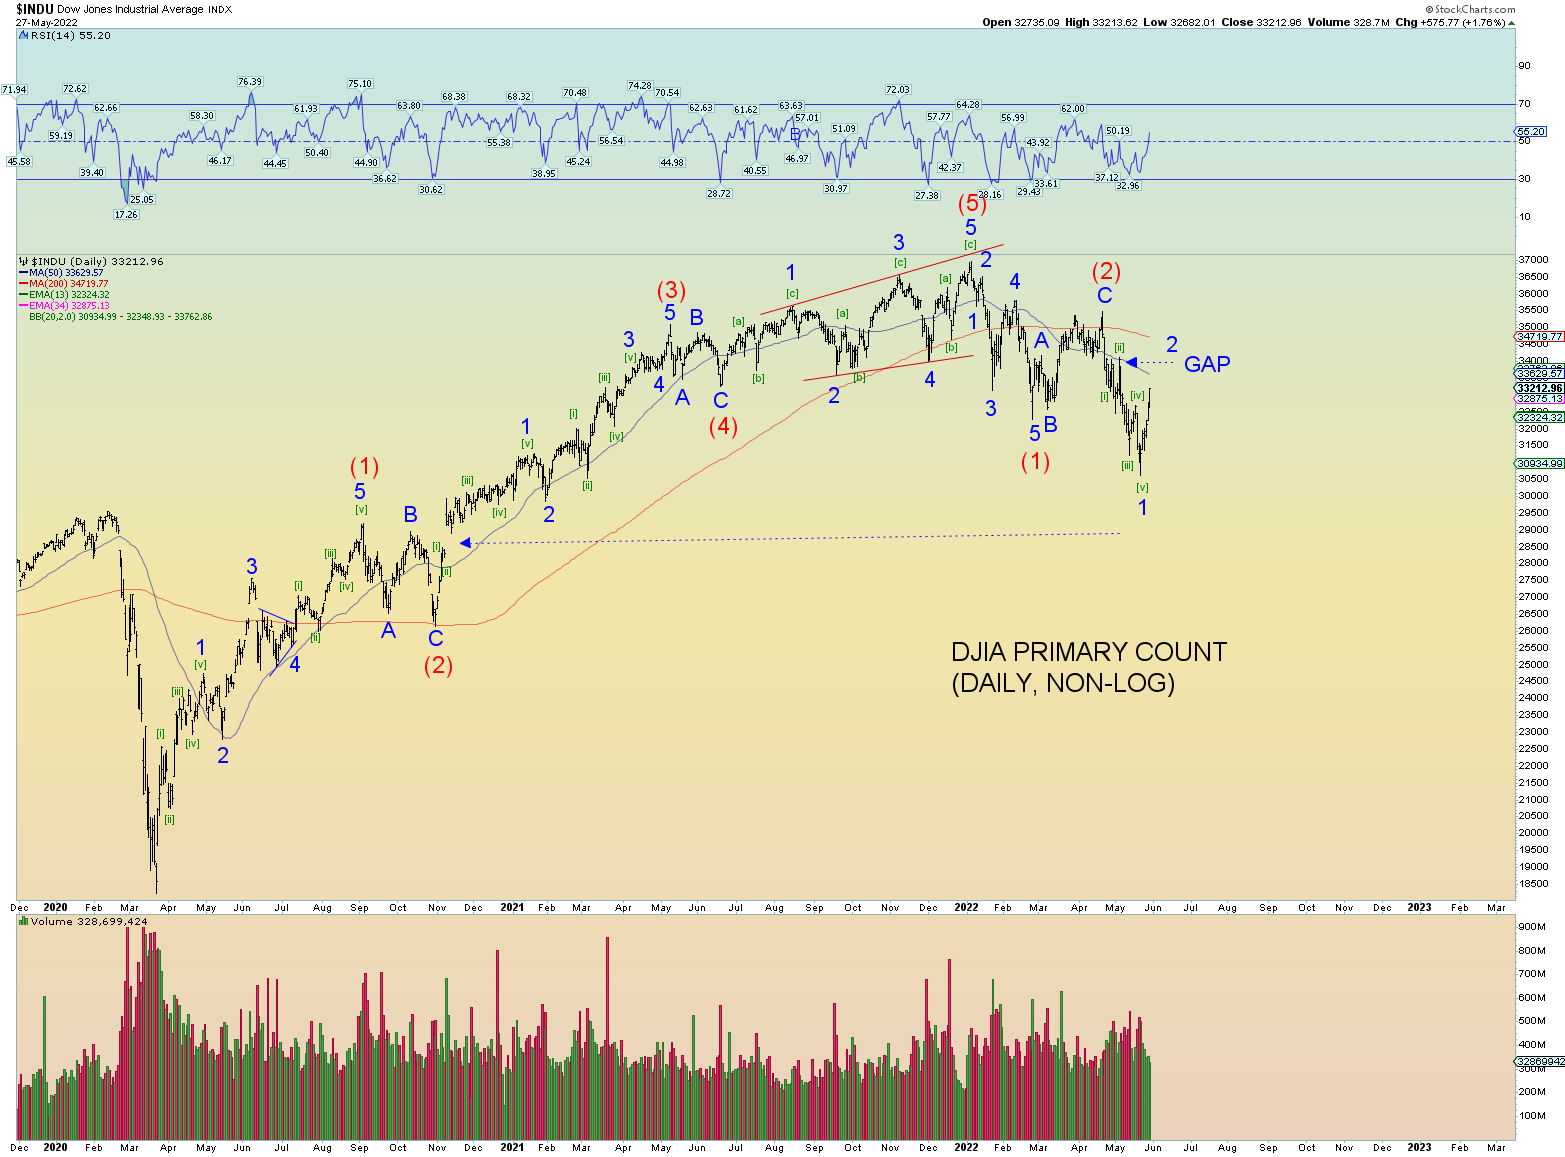
I don’t count the DJIA because it can go through great nuisance stretches just like the NYSE count or any other subindex.
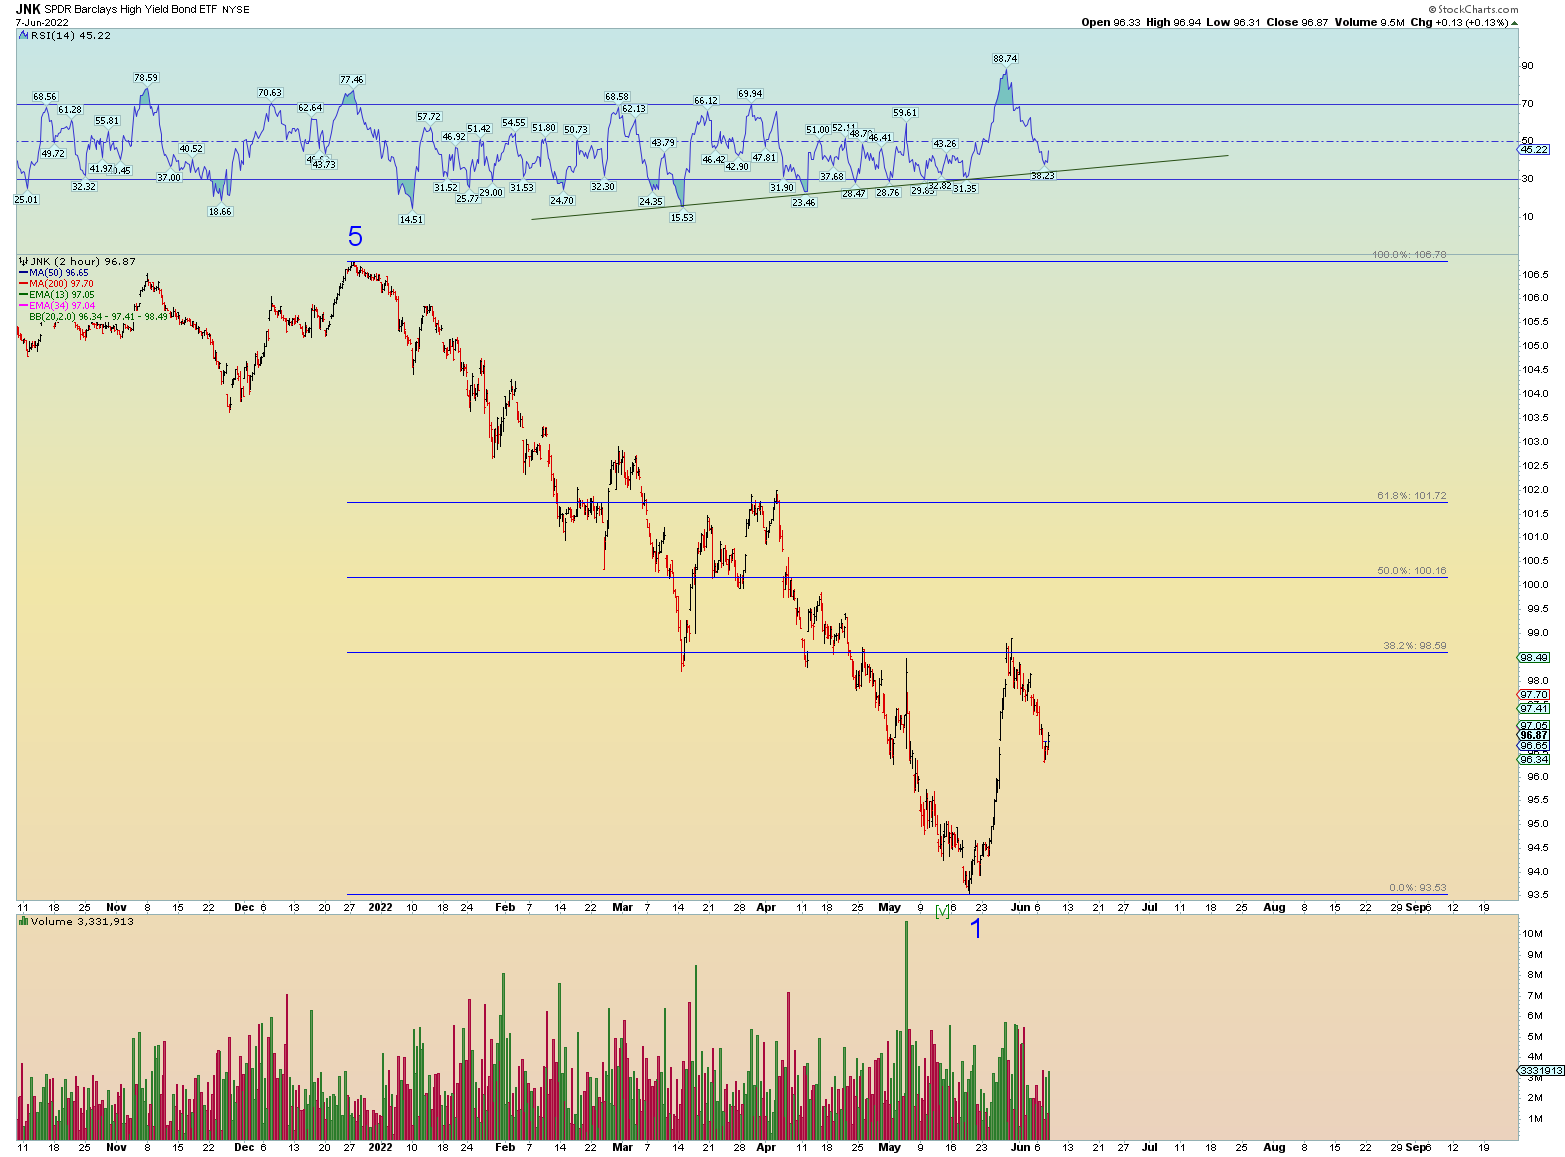
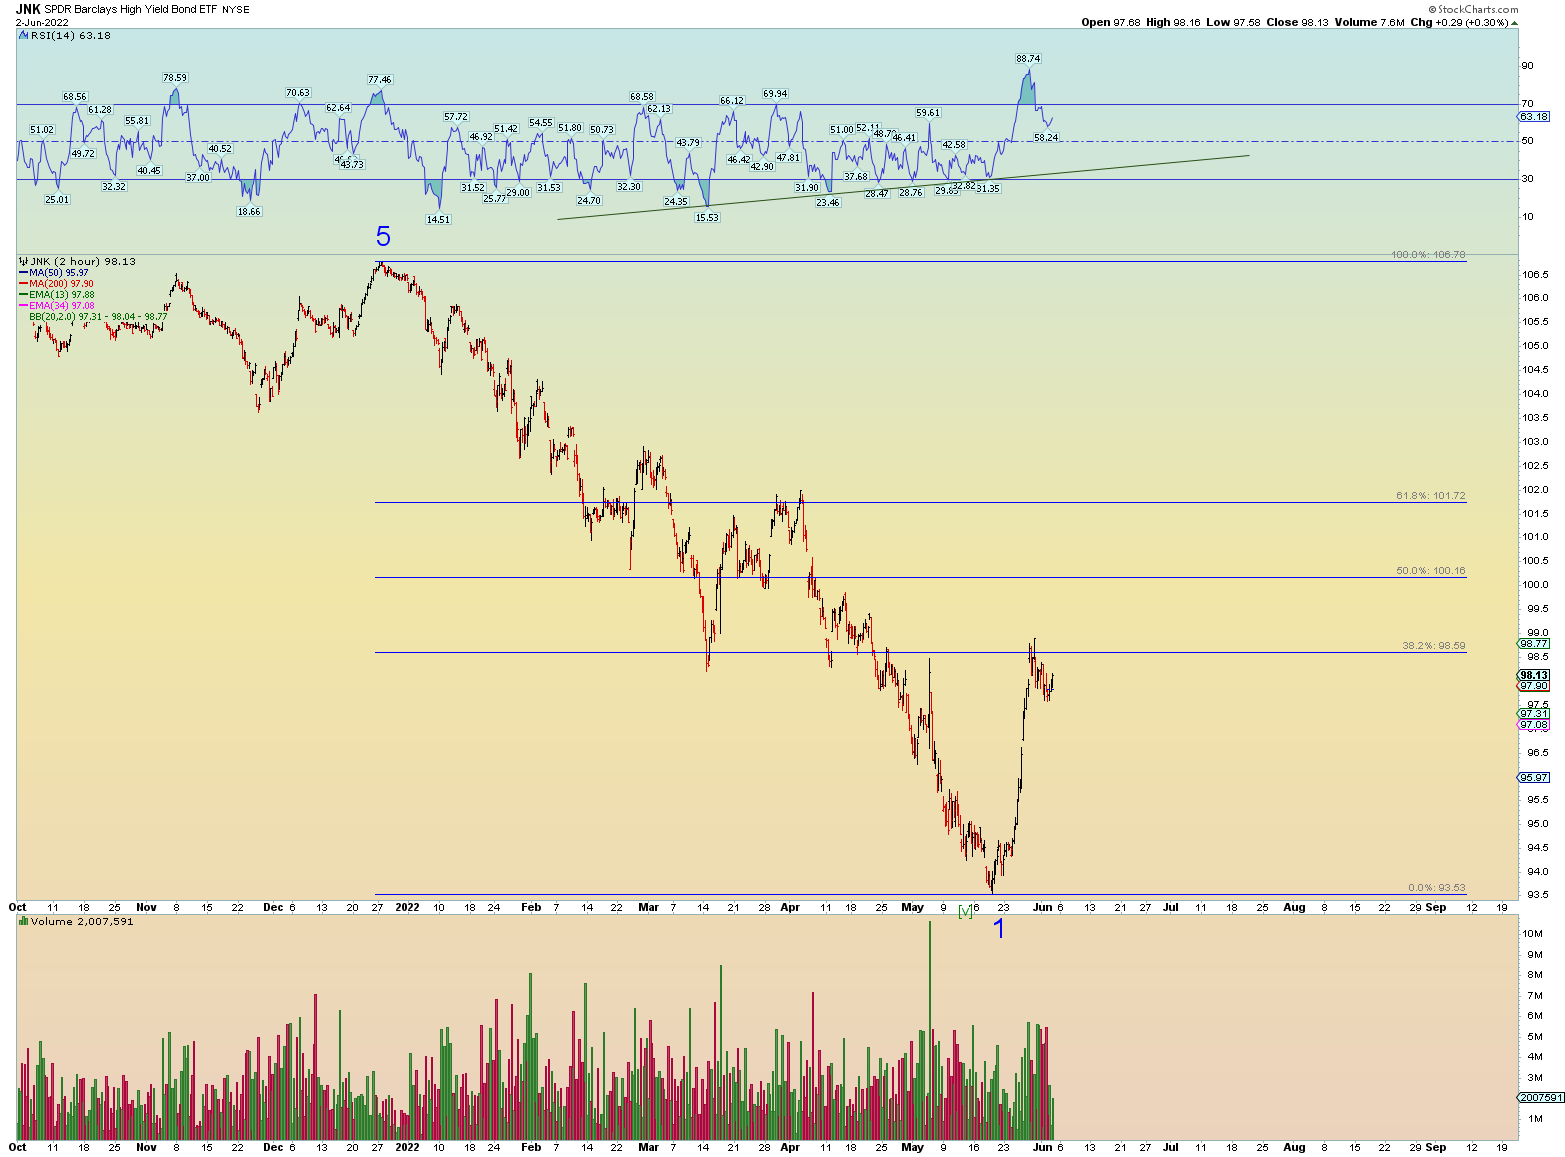
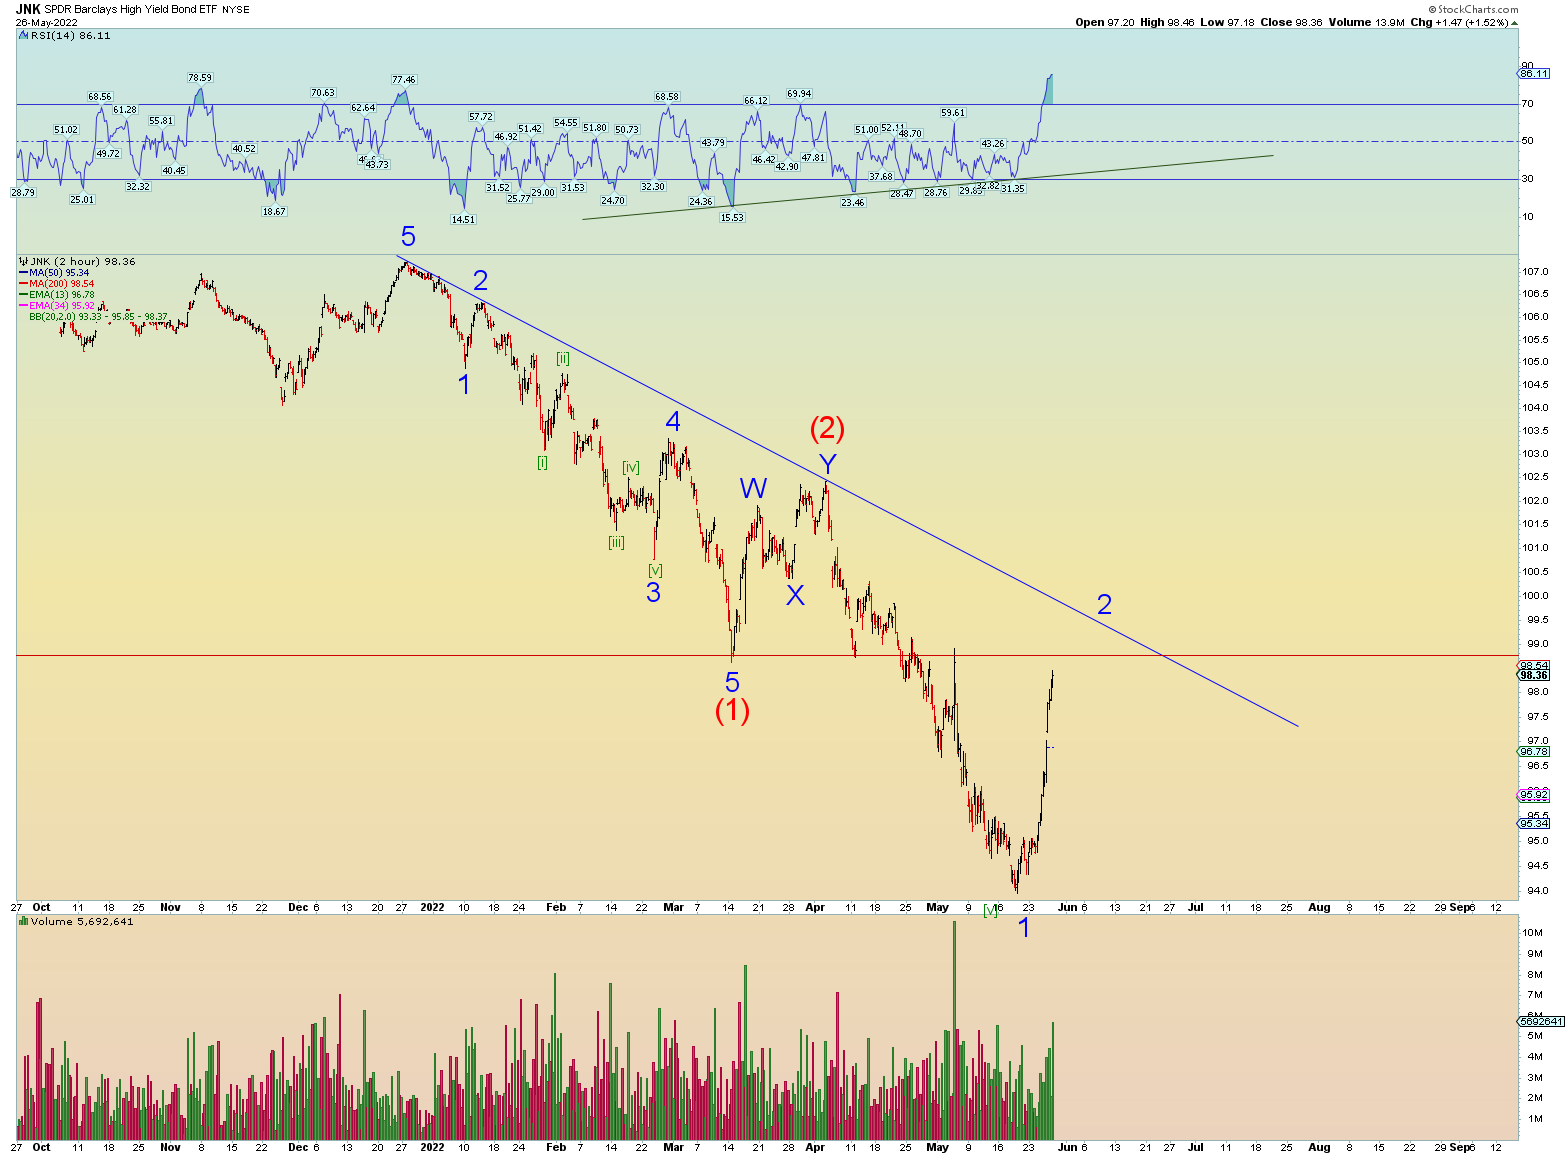
No new high on Junk today.
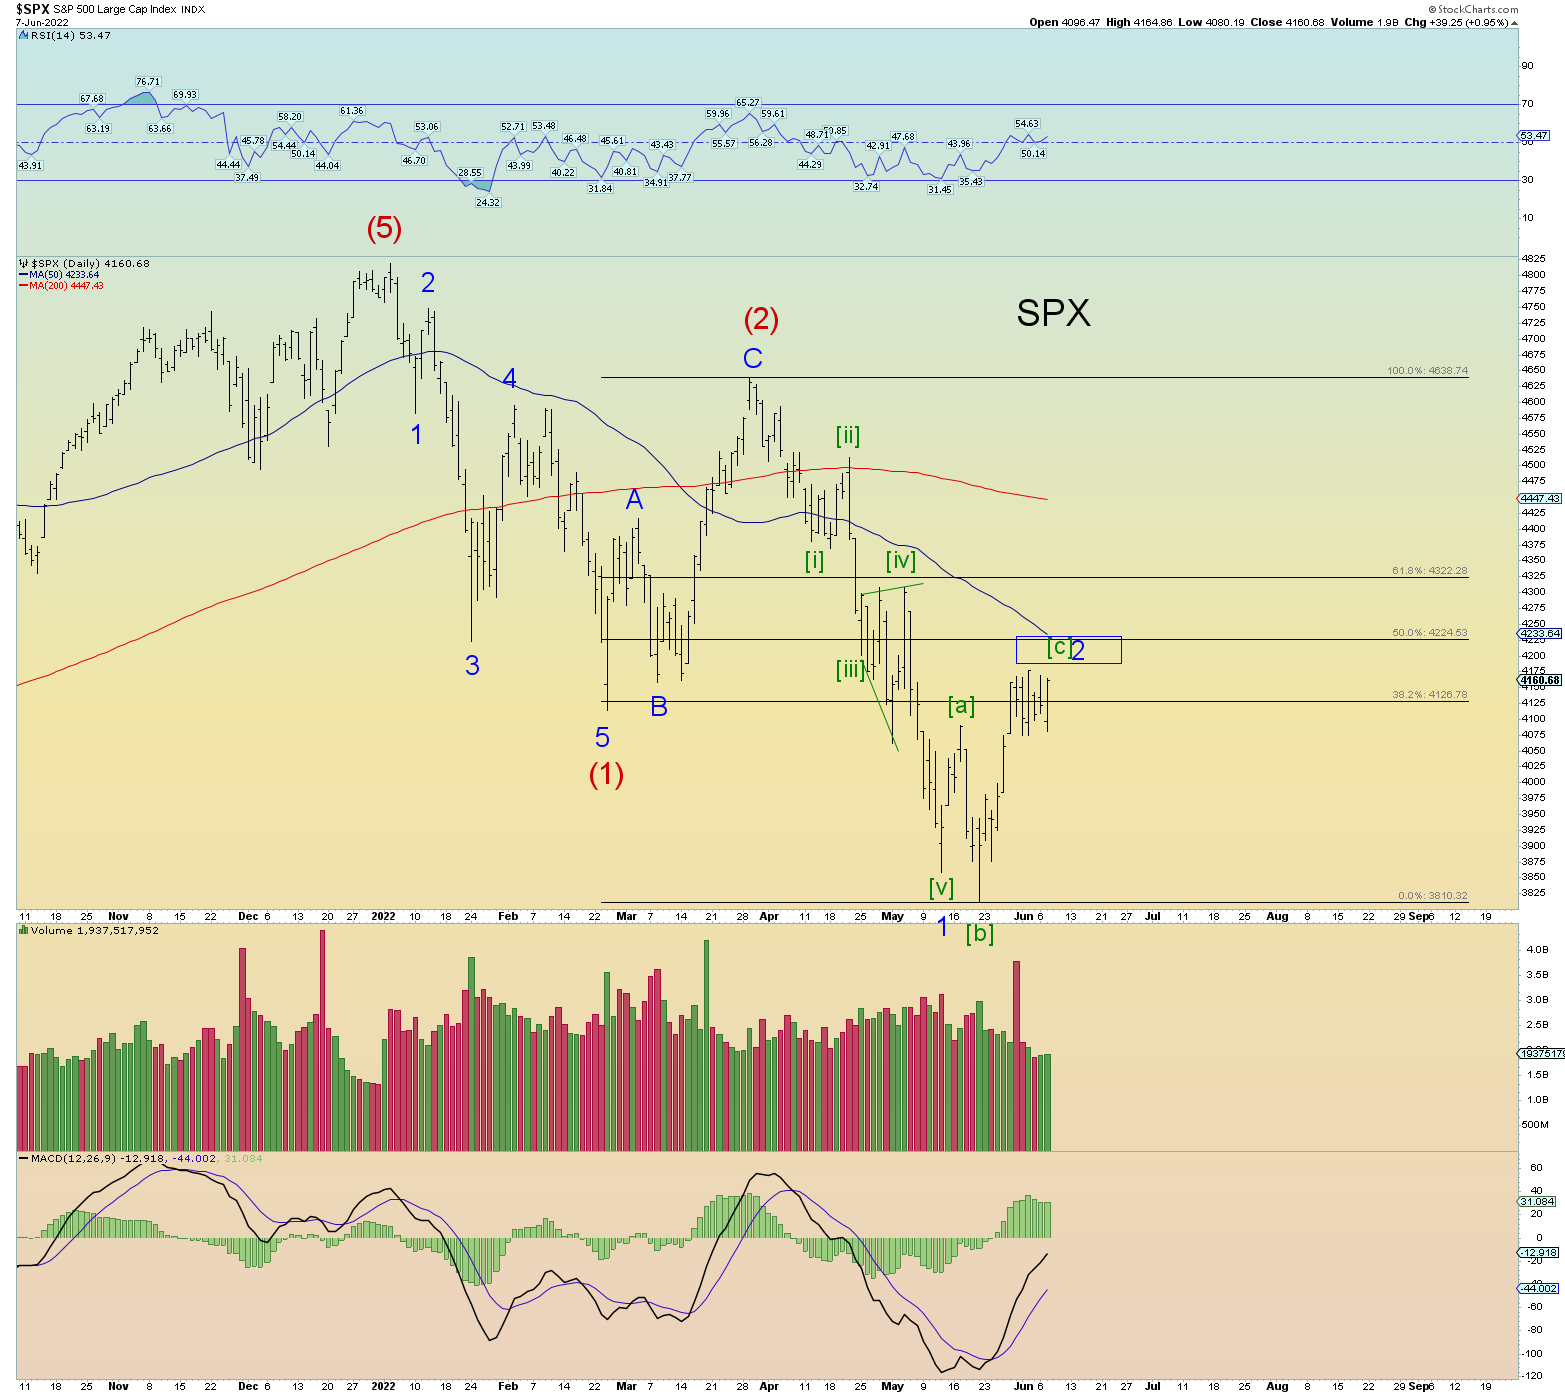
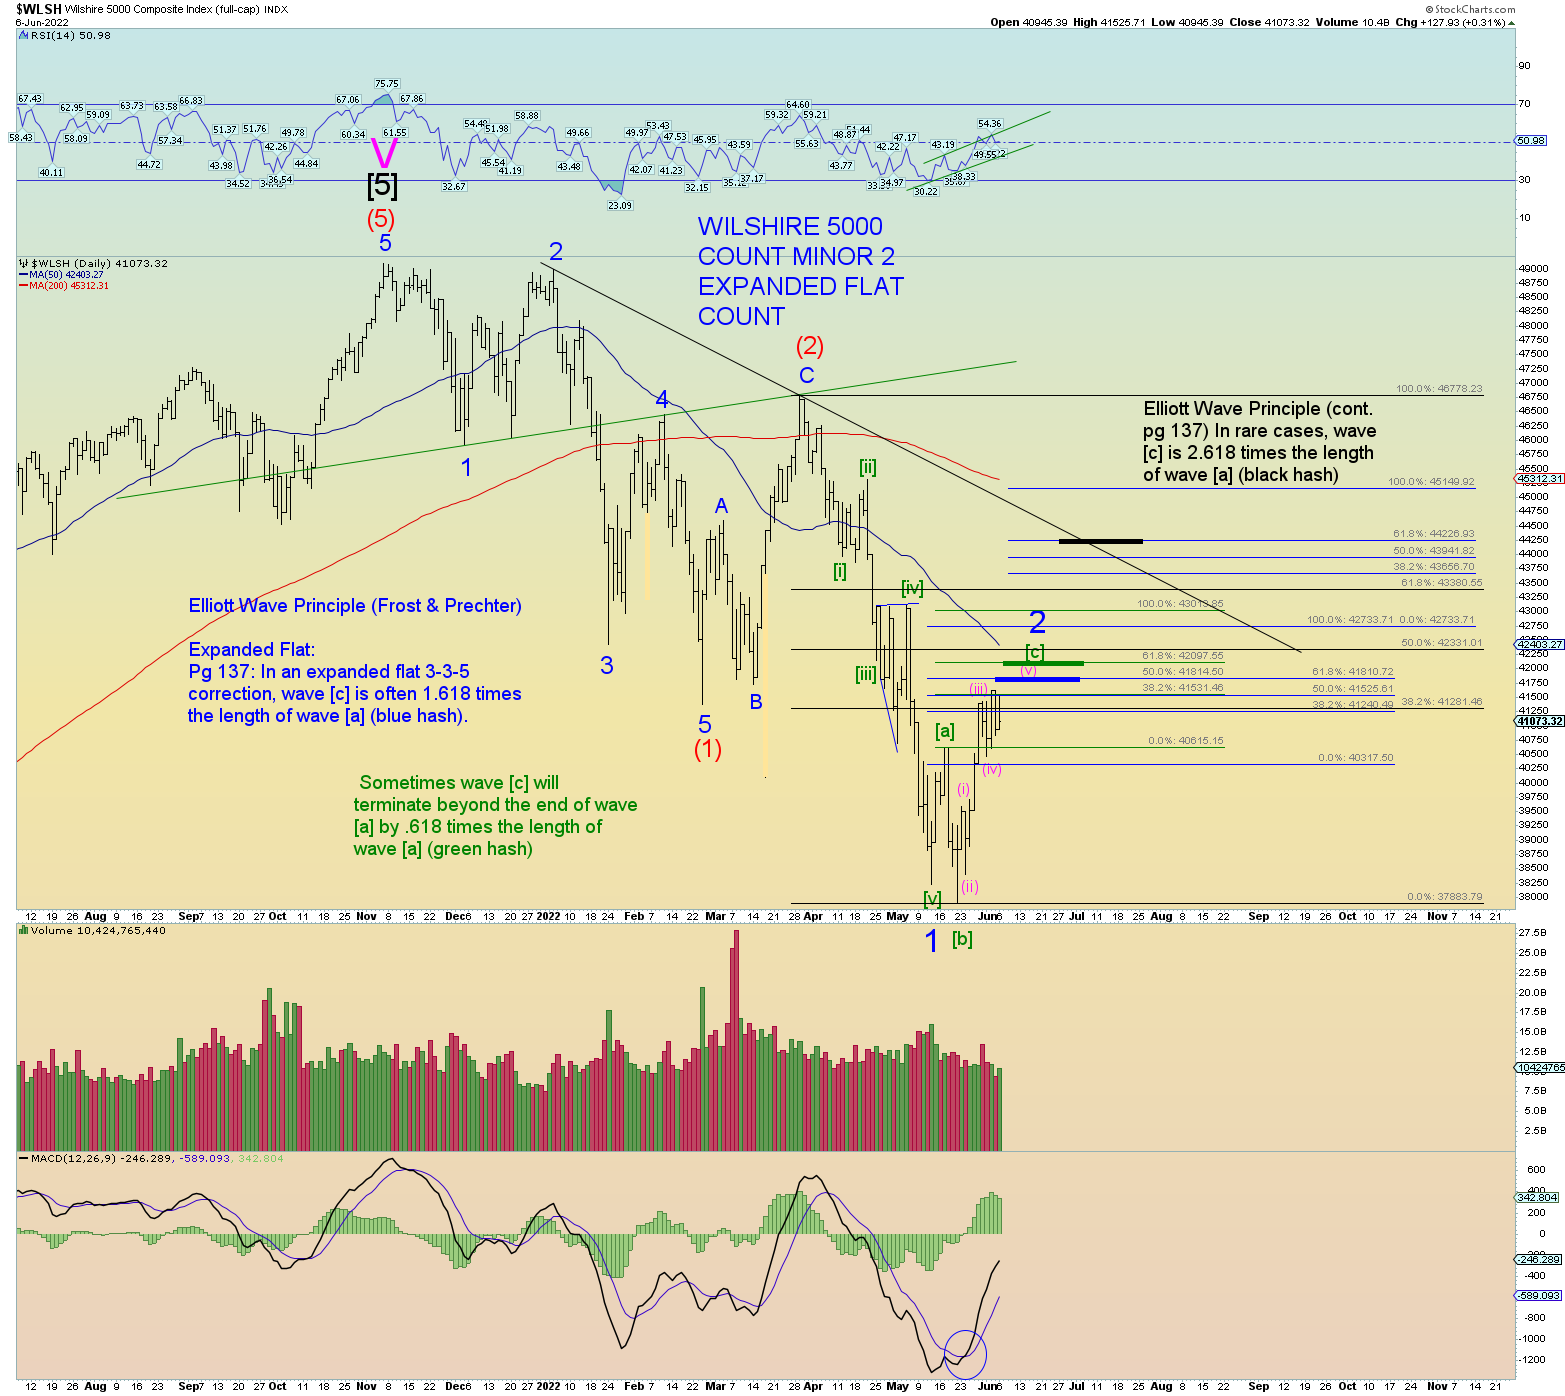
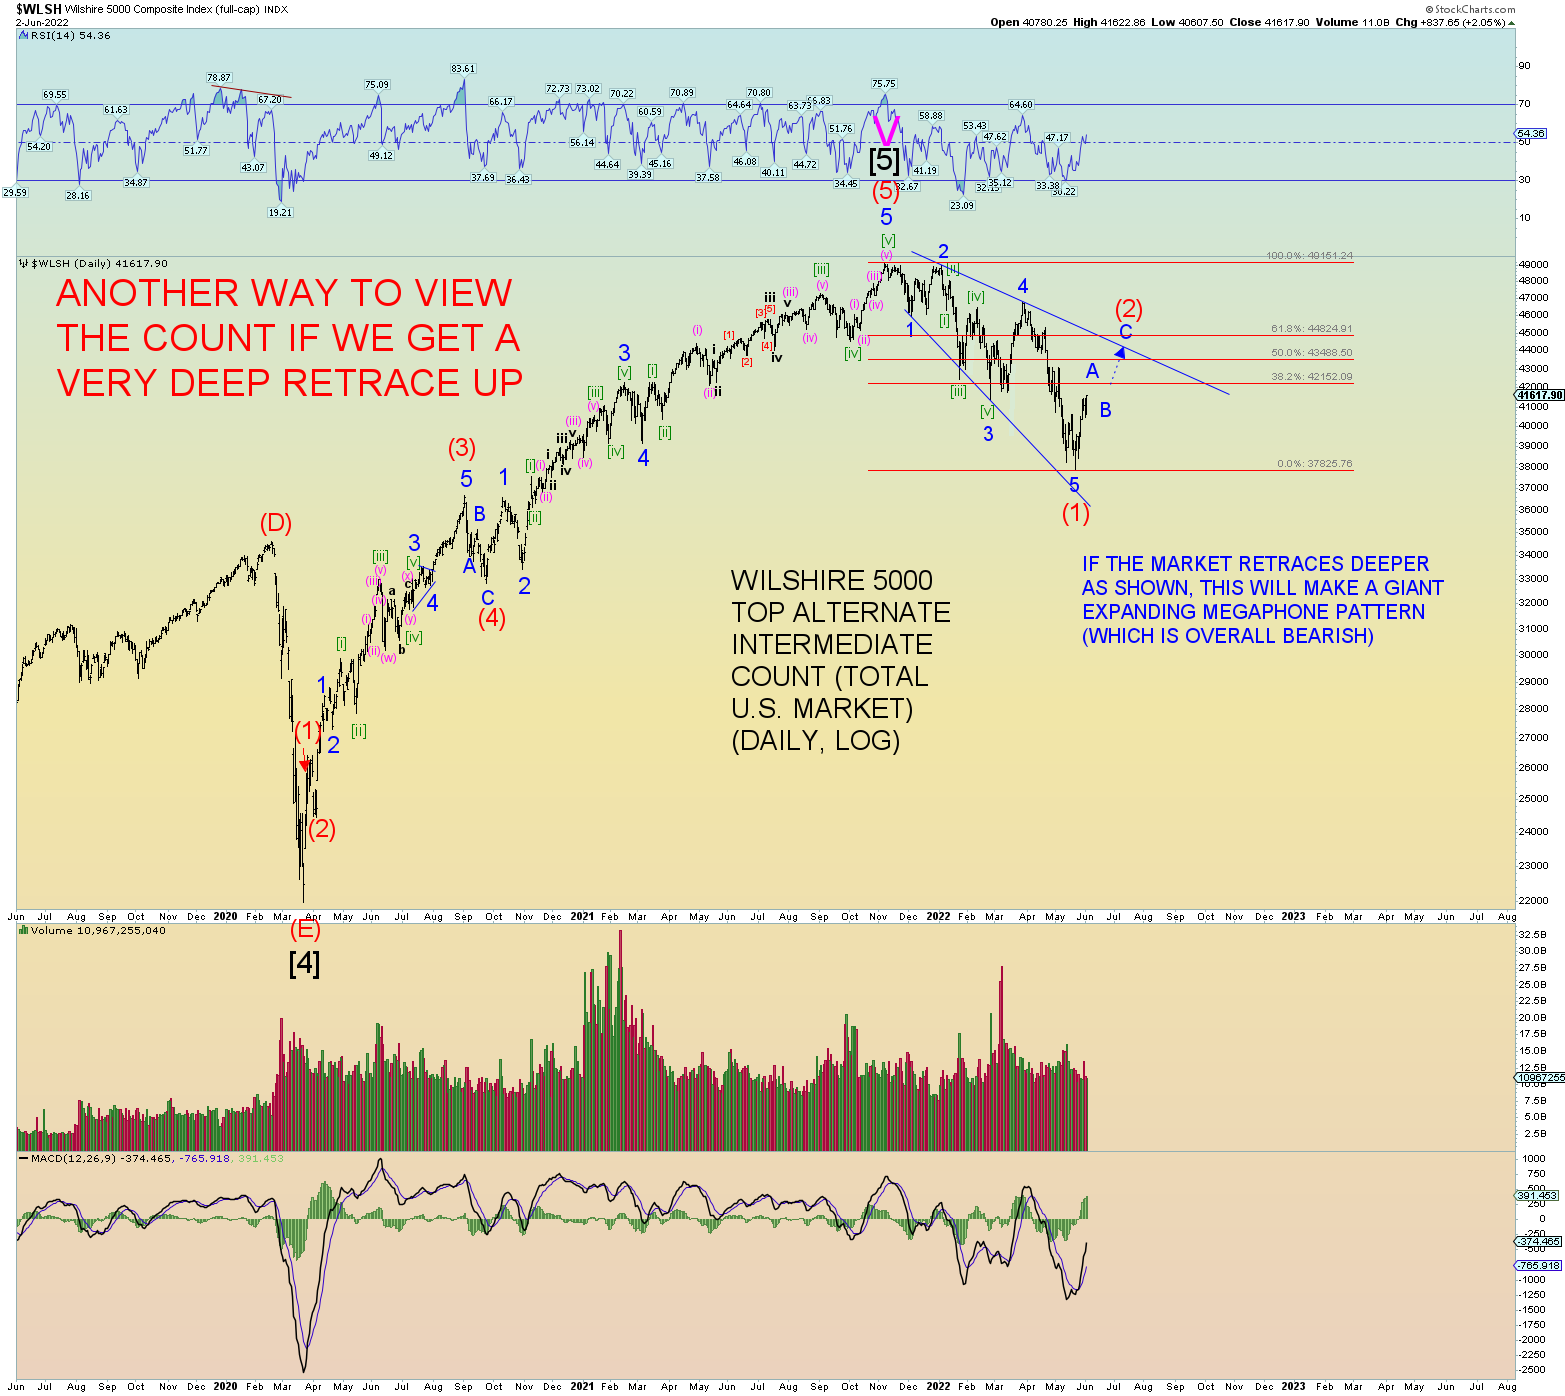
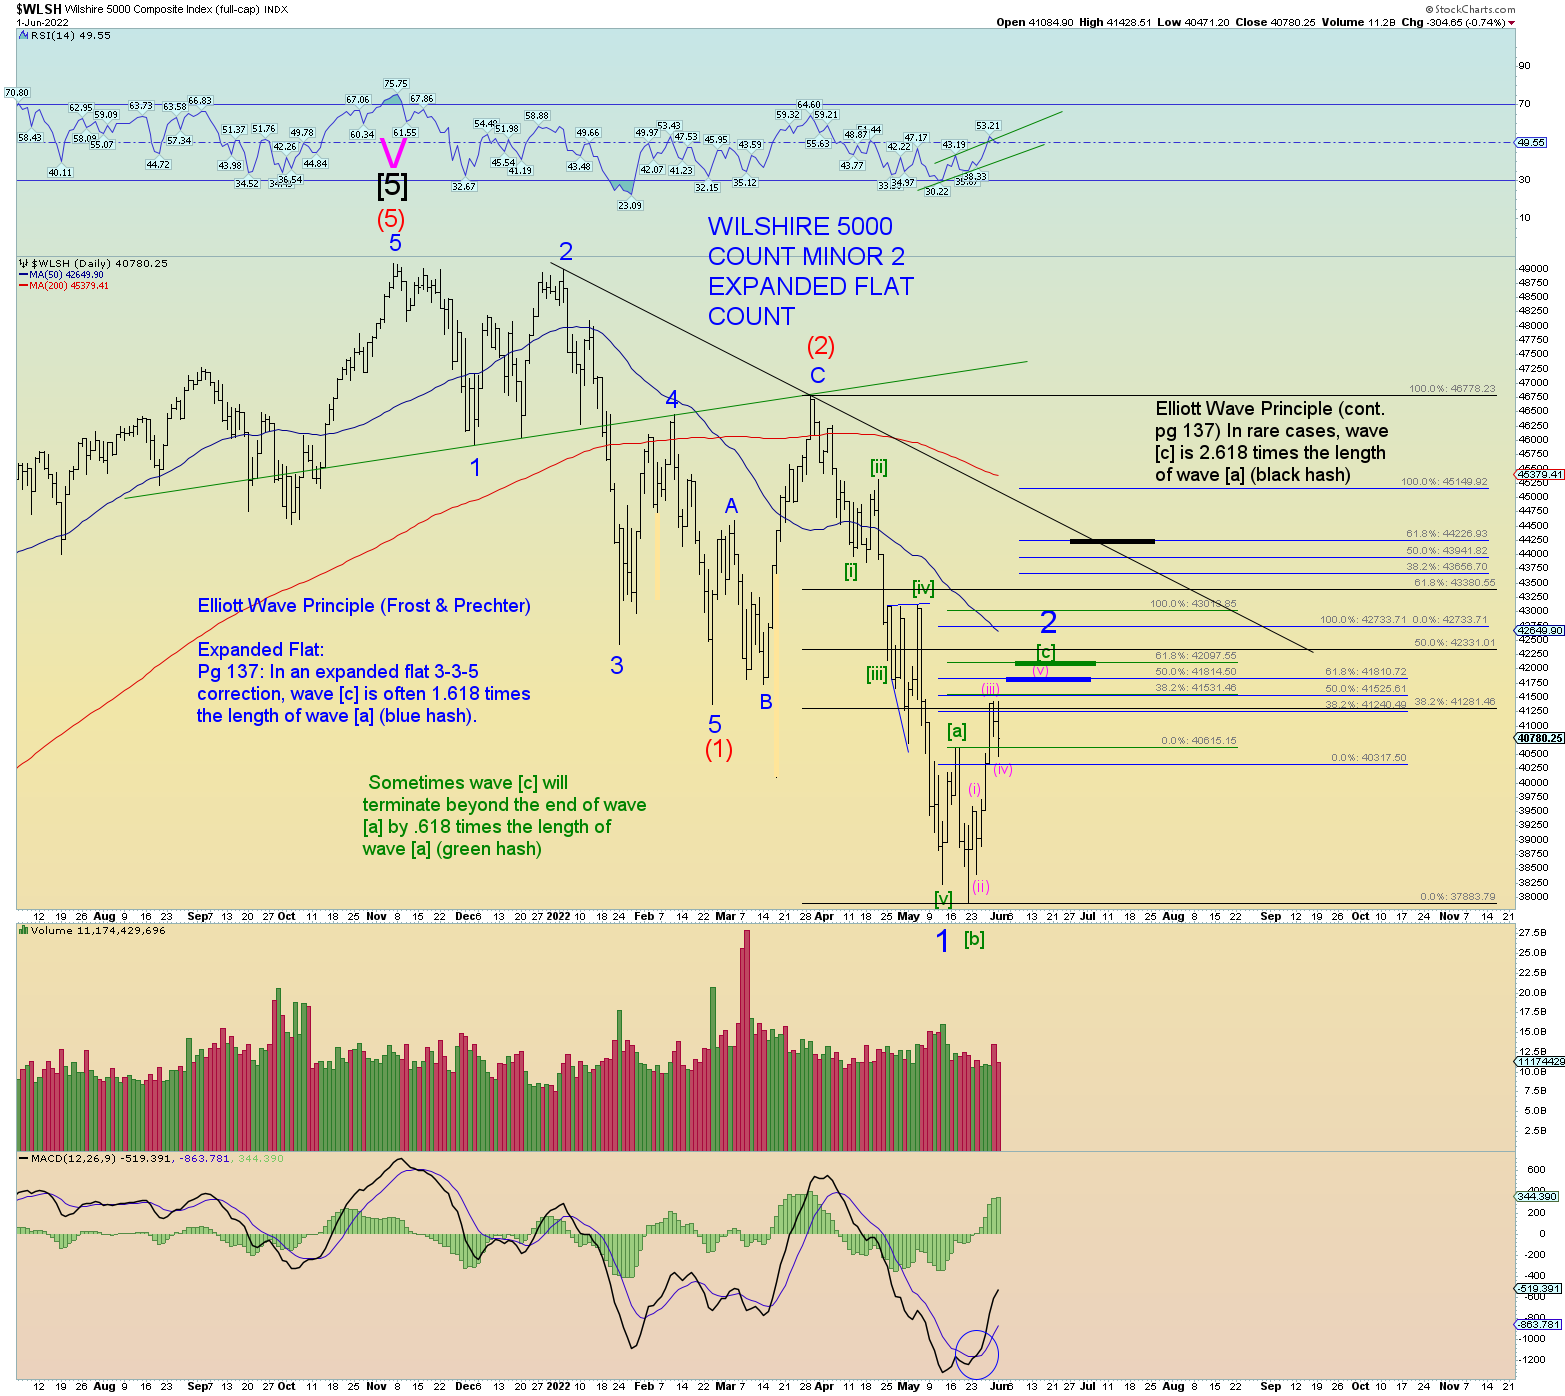
And finally, allow me to show you a chart that differs not very much from the Wilshire daily chart (shown above) that accounts for a Fibonacci 2.618 wave [c] times [a] for a Minor 2 price target.
And what if that 2.618 Fib target was reached, what would the overall pattern look like on the total market?
It would look like this:
CONCLUSION:
The bottom line is this: Even if a much deeper overall market retrace occurs, even if done in a swift and “take no prisoners” manner, it would produce the most overbought, overhyped, overthought, overtraded market in history and result in a historic collapse no matter how one tries to “rescue” it.
That much I am confident in. So, if the market needs to rip some more face to the upside, I say bring it on!
Yes, you can get saved by watching and hearing the Word of God on the internets.
https://www.youtube.com/watch?v=Tb5nGDbYmYo
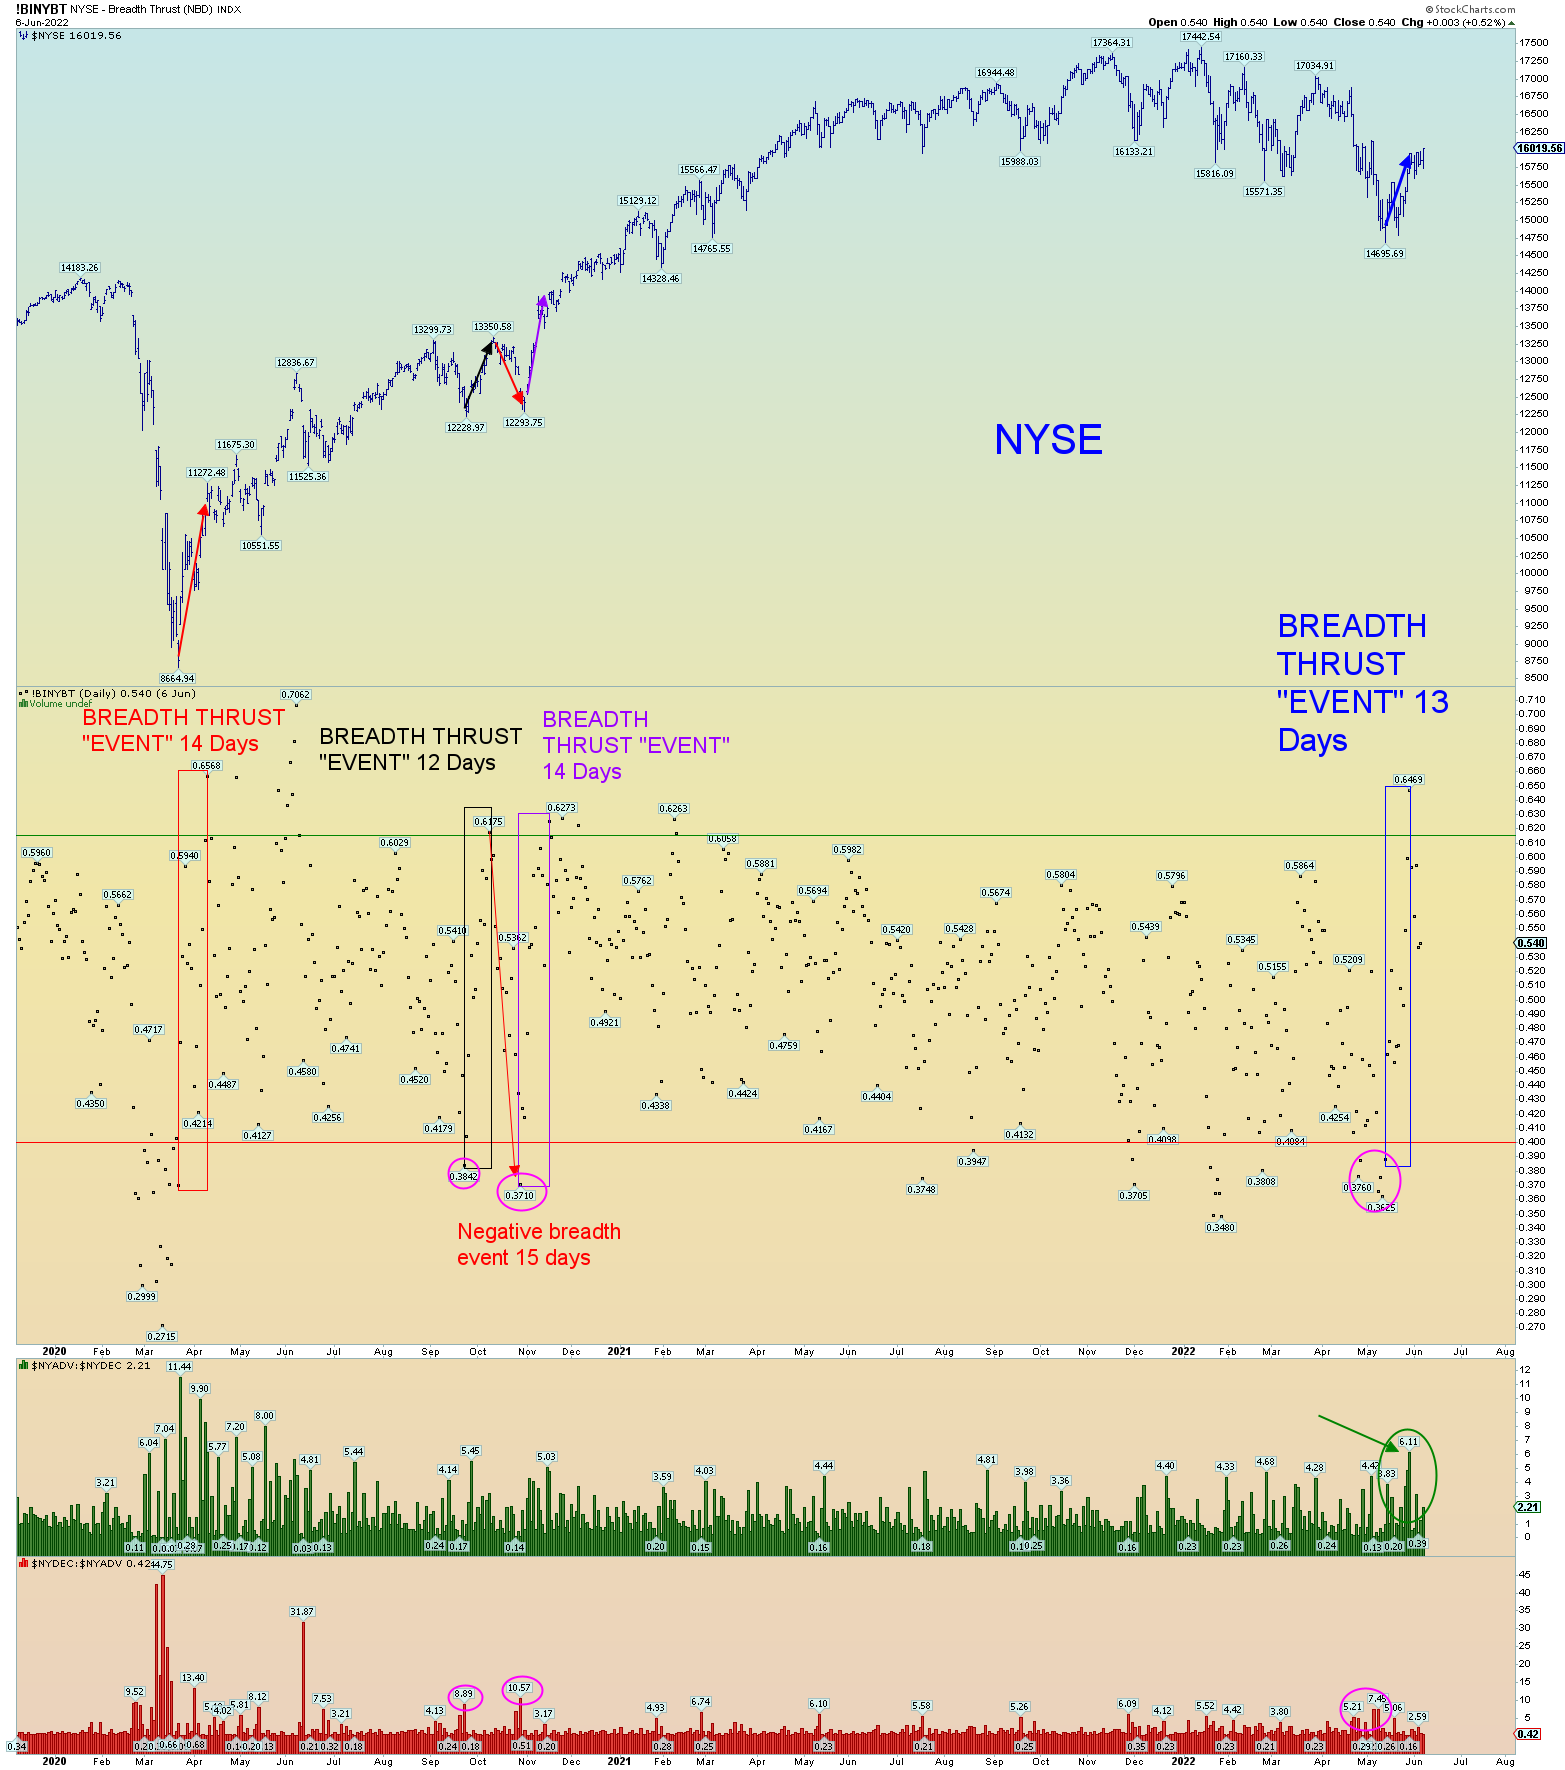
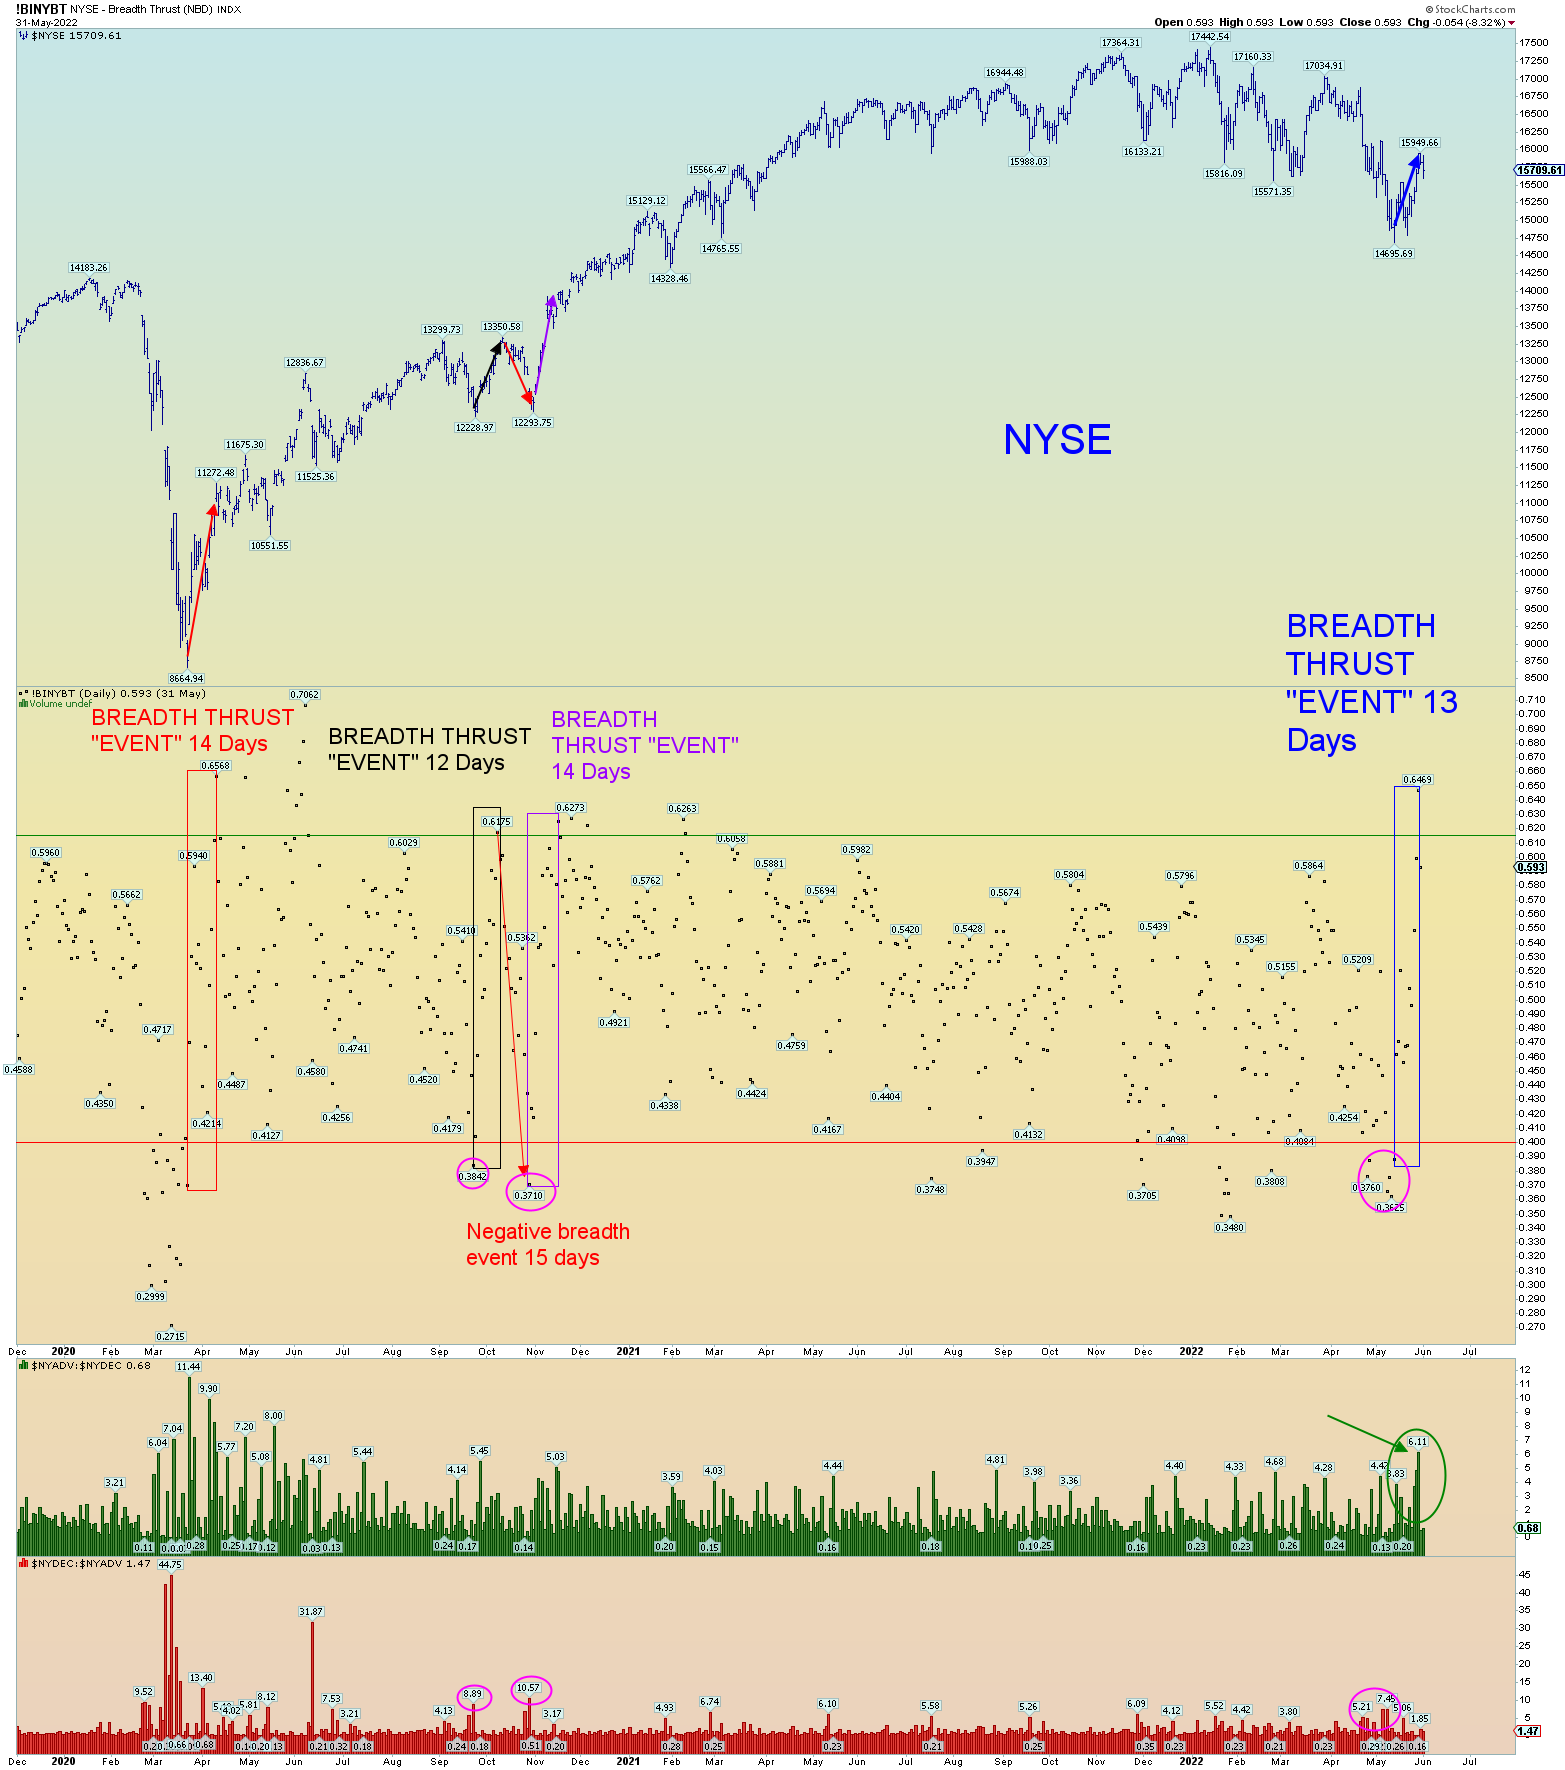
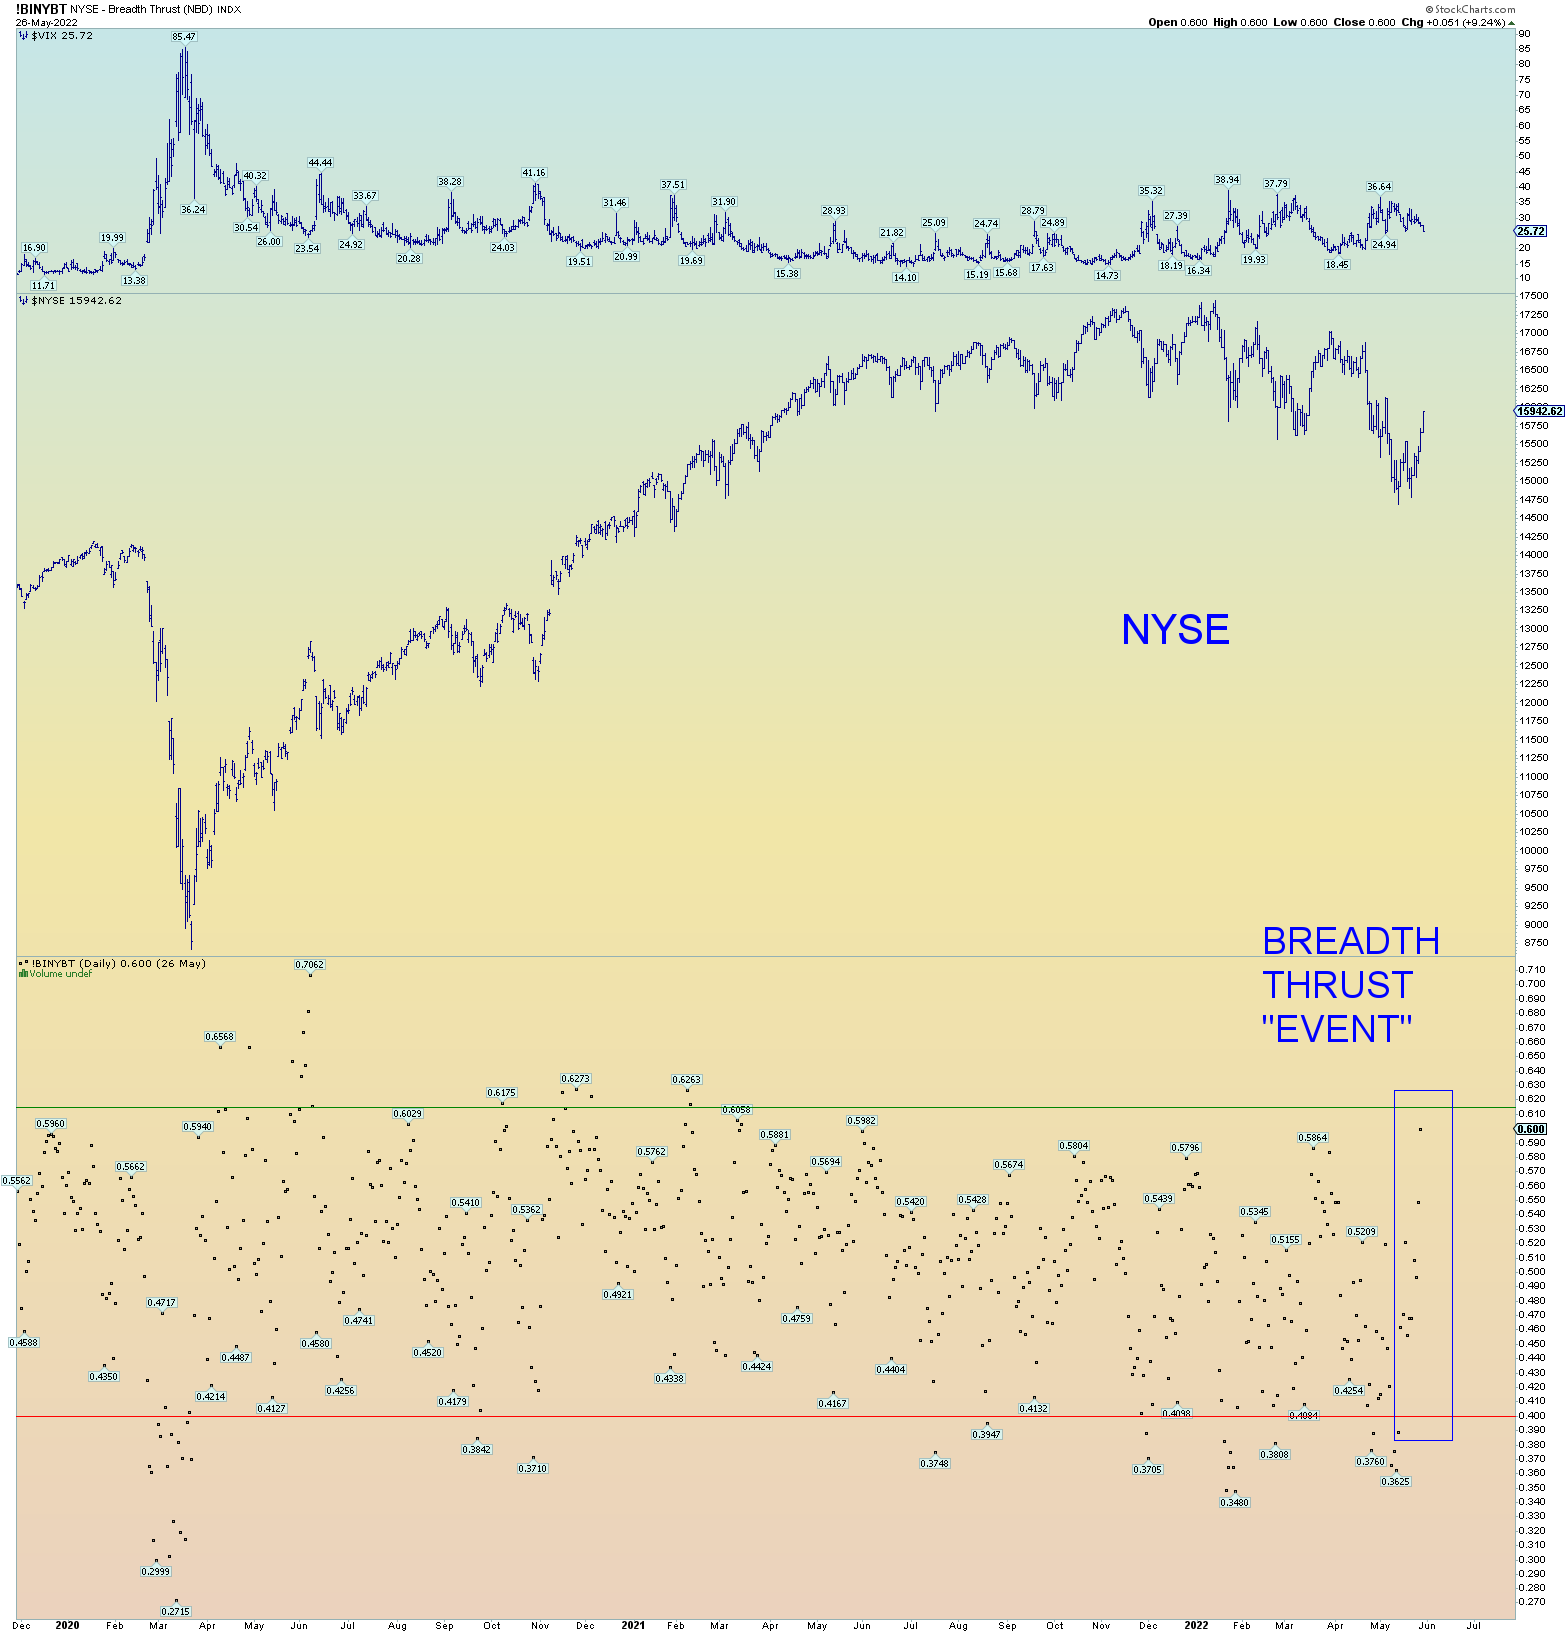
Looking at the NYSE “breadth thrust” indicator, we have had an “event” triggering last Friday. This is not an official “Zweig” event of 10 days or less however I consider a significant event nonetheless.
The primary wave count has the market topping in Minor 2 of (3). After this, more intense selling of what has occurred previously since the November Wilshire 5000 high should occur. And I’m counting on a “negative” thrust event which negates the recent positive and buries the daily print back beneath .40 on the scale. This would take a “close” beneath the closing price of Minor 1 of (3) low.
IF the market cannot pick up selling pressure to negate this positive event, then we might be faced with the “rare” extension of 2.618 for wave [c] of Minor 2 expanded flat. That would be the black hash mark on the downslope line.
But that is getting ahead of things as the market has yet to even reach our preferred Minor 2 target range (on the SPX its 4185 – 4233). I only point this out because this is my thinking about this positive breadth event which cannot be ignored until it is closed under and reversed. The primary wave count suggests that will happen, but the market doesn’t always go the path we wish it to take.
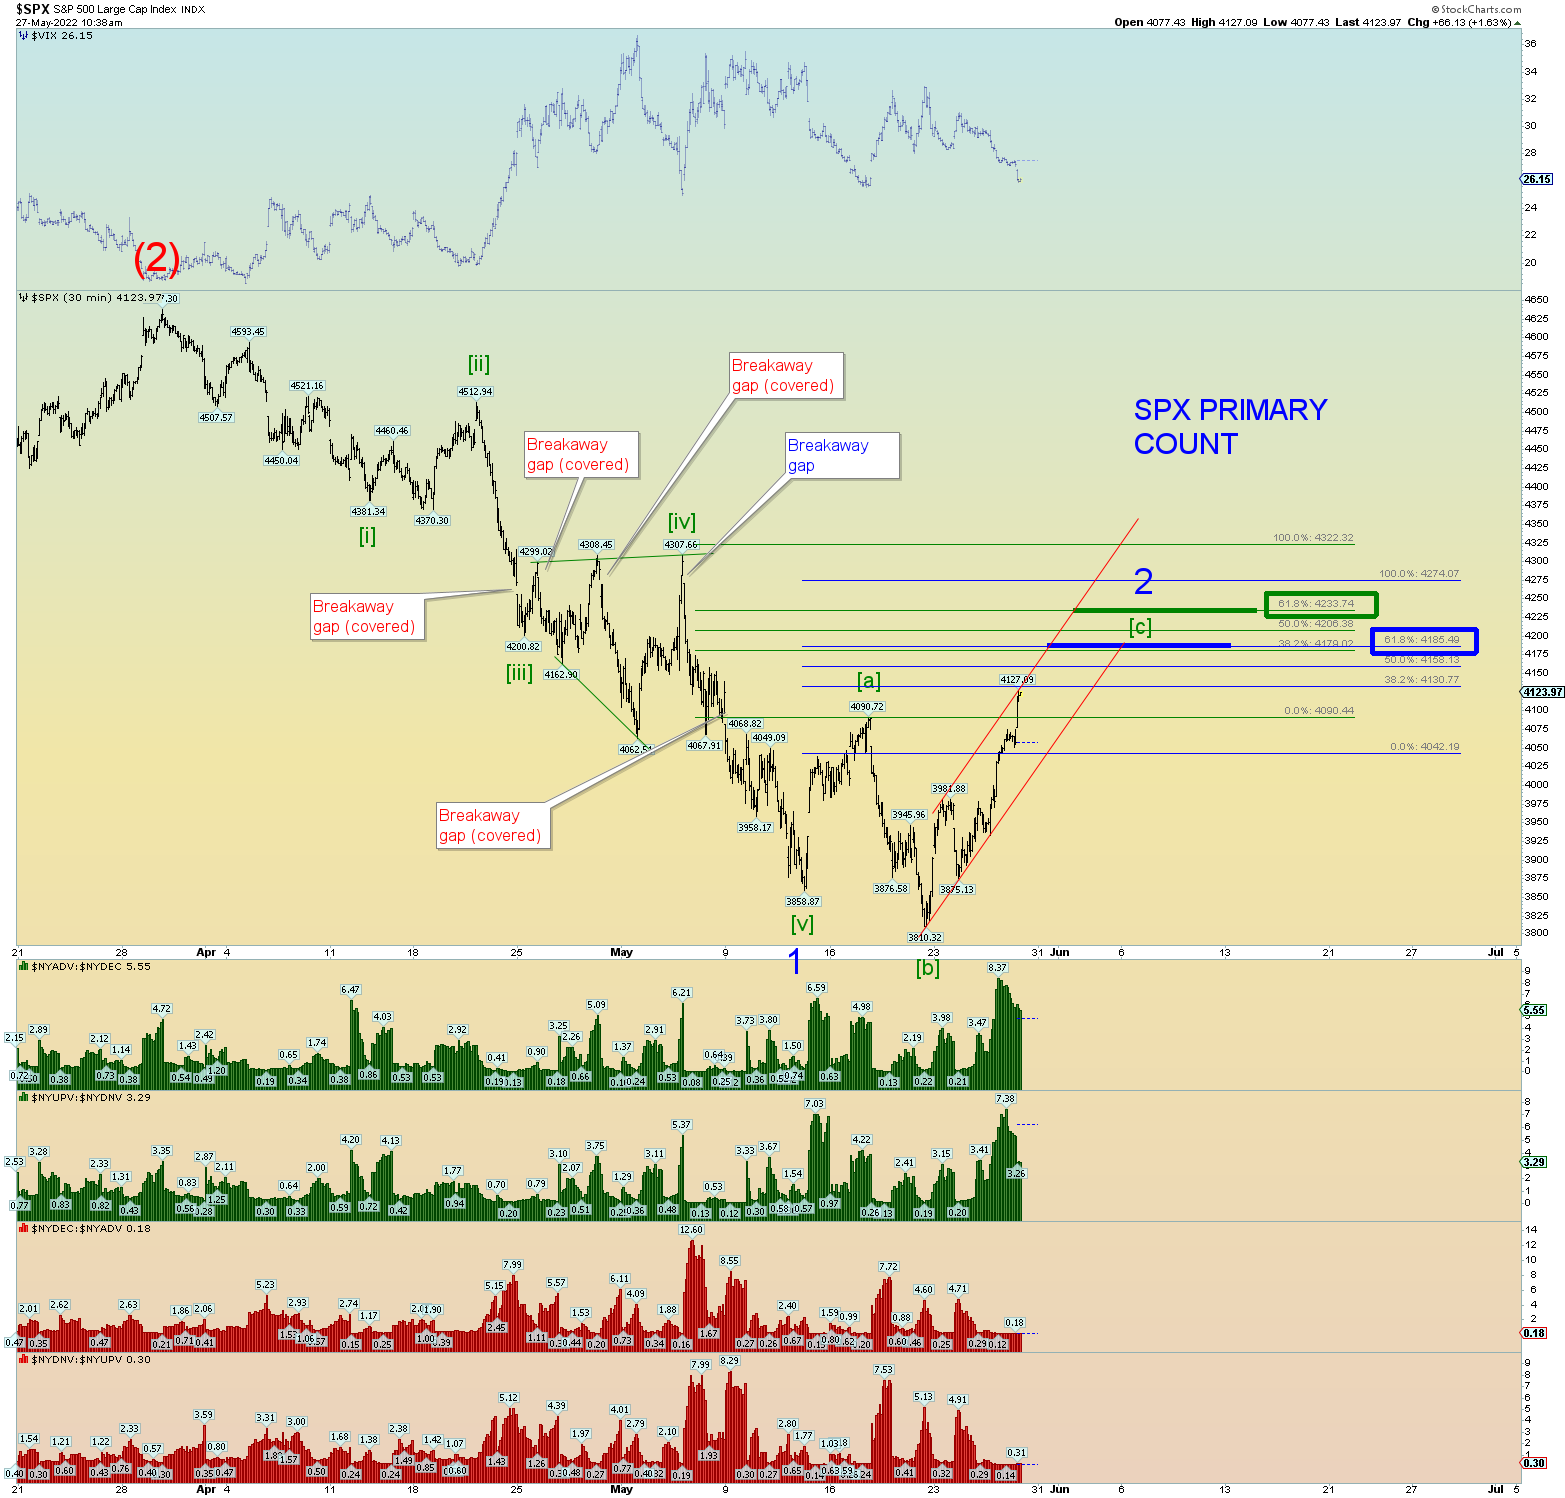
At the very least, we can now determine probably where wave (iii) of 2 peak is and likely the price low of (iv) of 2.
The SPX rose over 9% in a tad of 5 trading days so it was a significant move. For now.
The New York Stock Exchange experienced a “breadth thrust” event last Friday. In fact, it was the fastest and maybe the strongest breadth thrust event since the March 2020 low. It would probably take a negative breadth thrust event to cancel it out and drive prices down in Intermediate 3 of (3). But before that can happen, the market needs to find the top of proposed Minor 2 first.
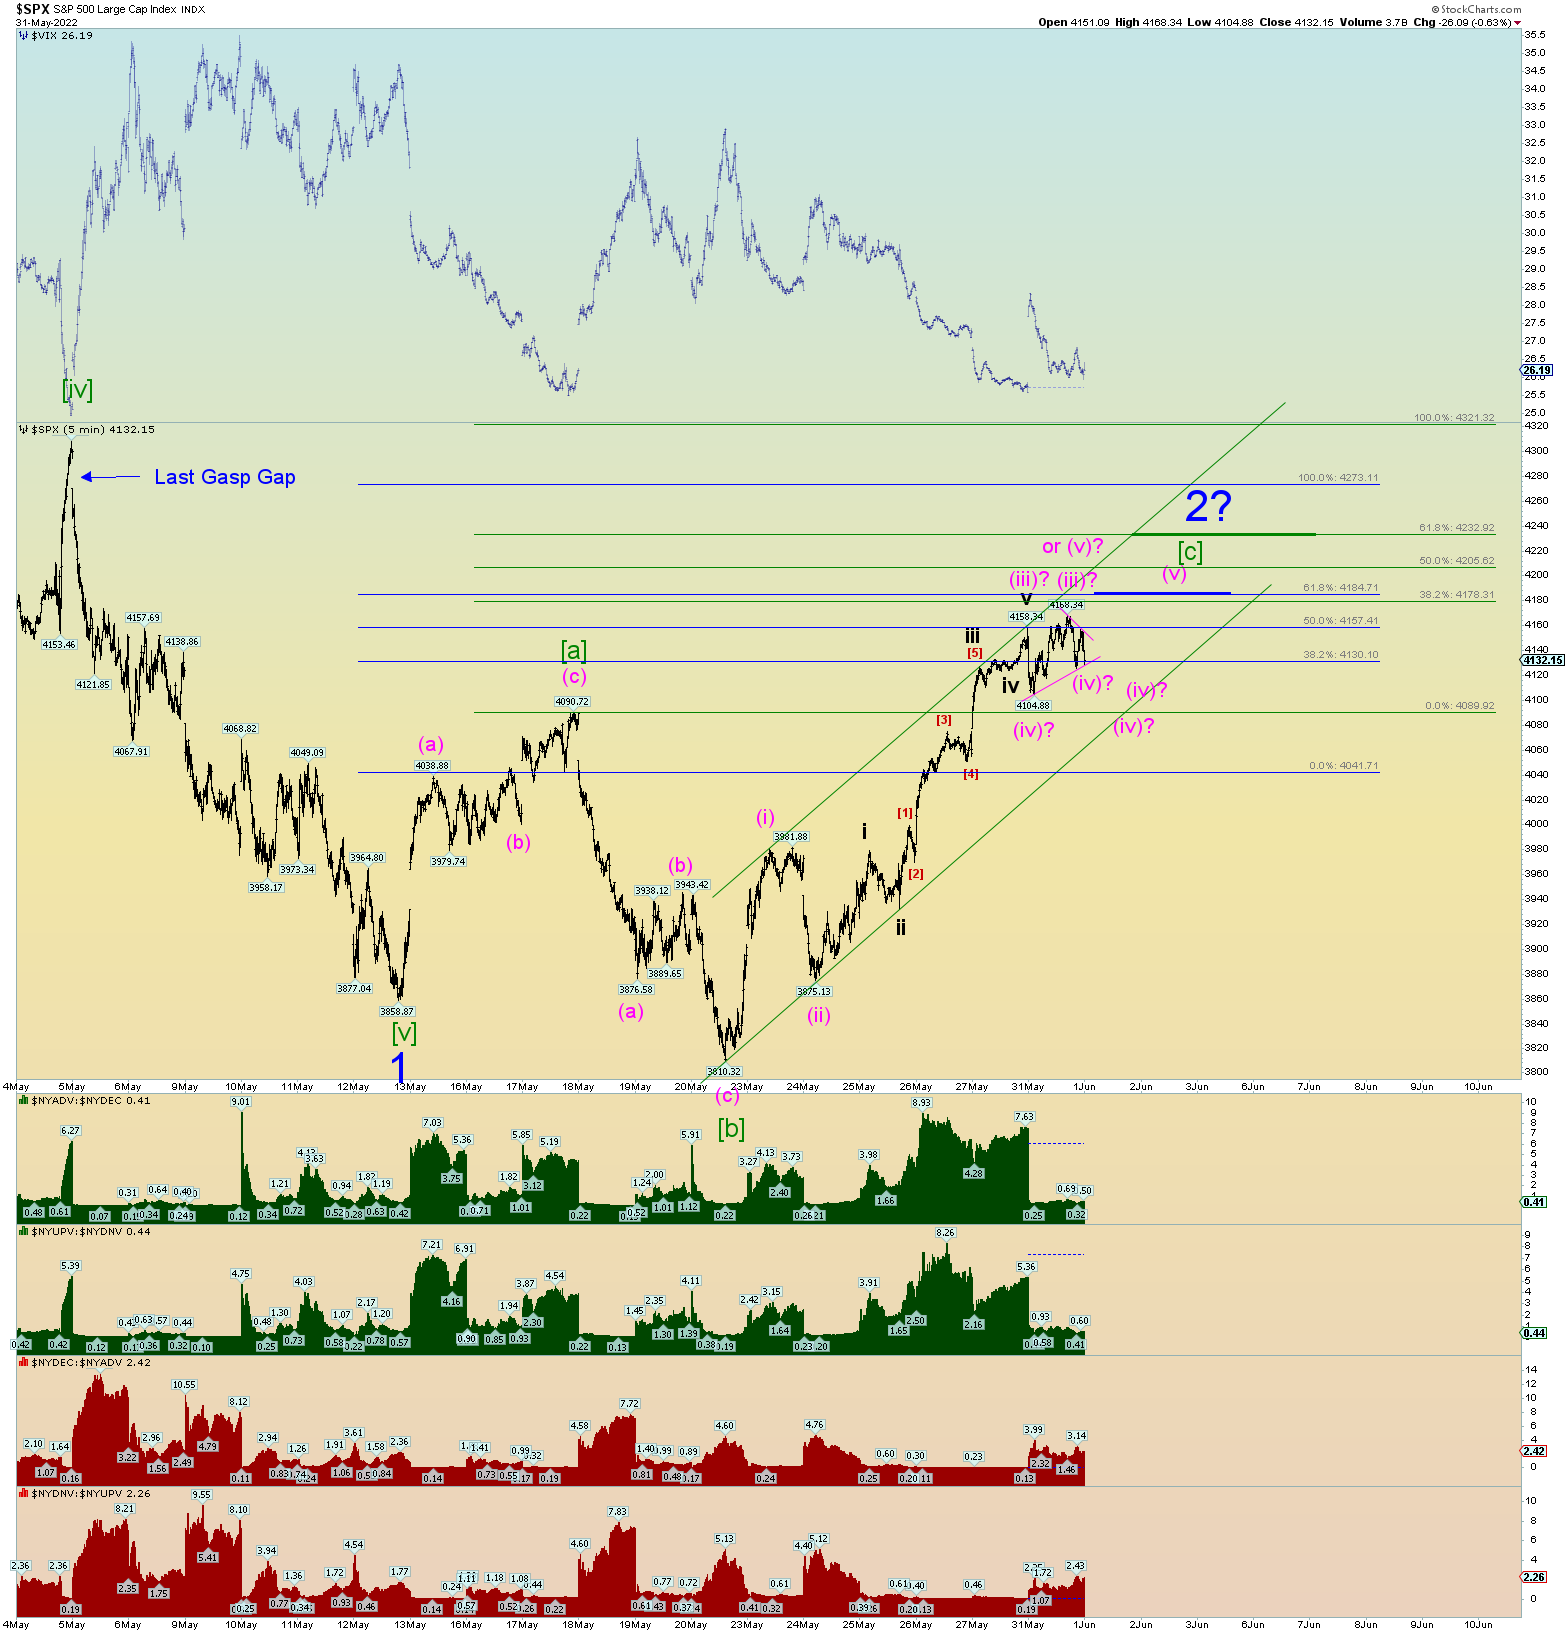
The following SPX chart sums up the short-term squiggles. In other words, there is a bunch of squiggle options. It may resolve itself by end of day tomorrow.
The ideal target range for the SPX expanded Minor 2 flat is 4185 – 4233. Considering today closed at 4132, there is a potential 100-point uprising left in the market.
Again, the NYSE’s breadth thrust event. There is an excellent track record for these events including events that occurred in the past 20 years. This is why I would think it’ll take a negative event of a more extreme to negate the positive event. A plunge in breadth to the downside. If we are soon to start Minor 3 of (3) down, then this is to be expected. We’ll see, I guess.
At the moment, this is a very strong reason for the bullish case of potential much bigger upside in prices to come. The next 10 – 12 days will be telling.
Wilshire daily, SPX daily. The “extreme and rare” upside target for the proposed Minor 2 expanded flat is considerably higher still and would likely take a few weeks or more. (For the SPX that would be about 4400 SPX).
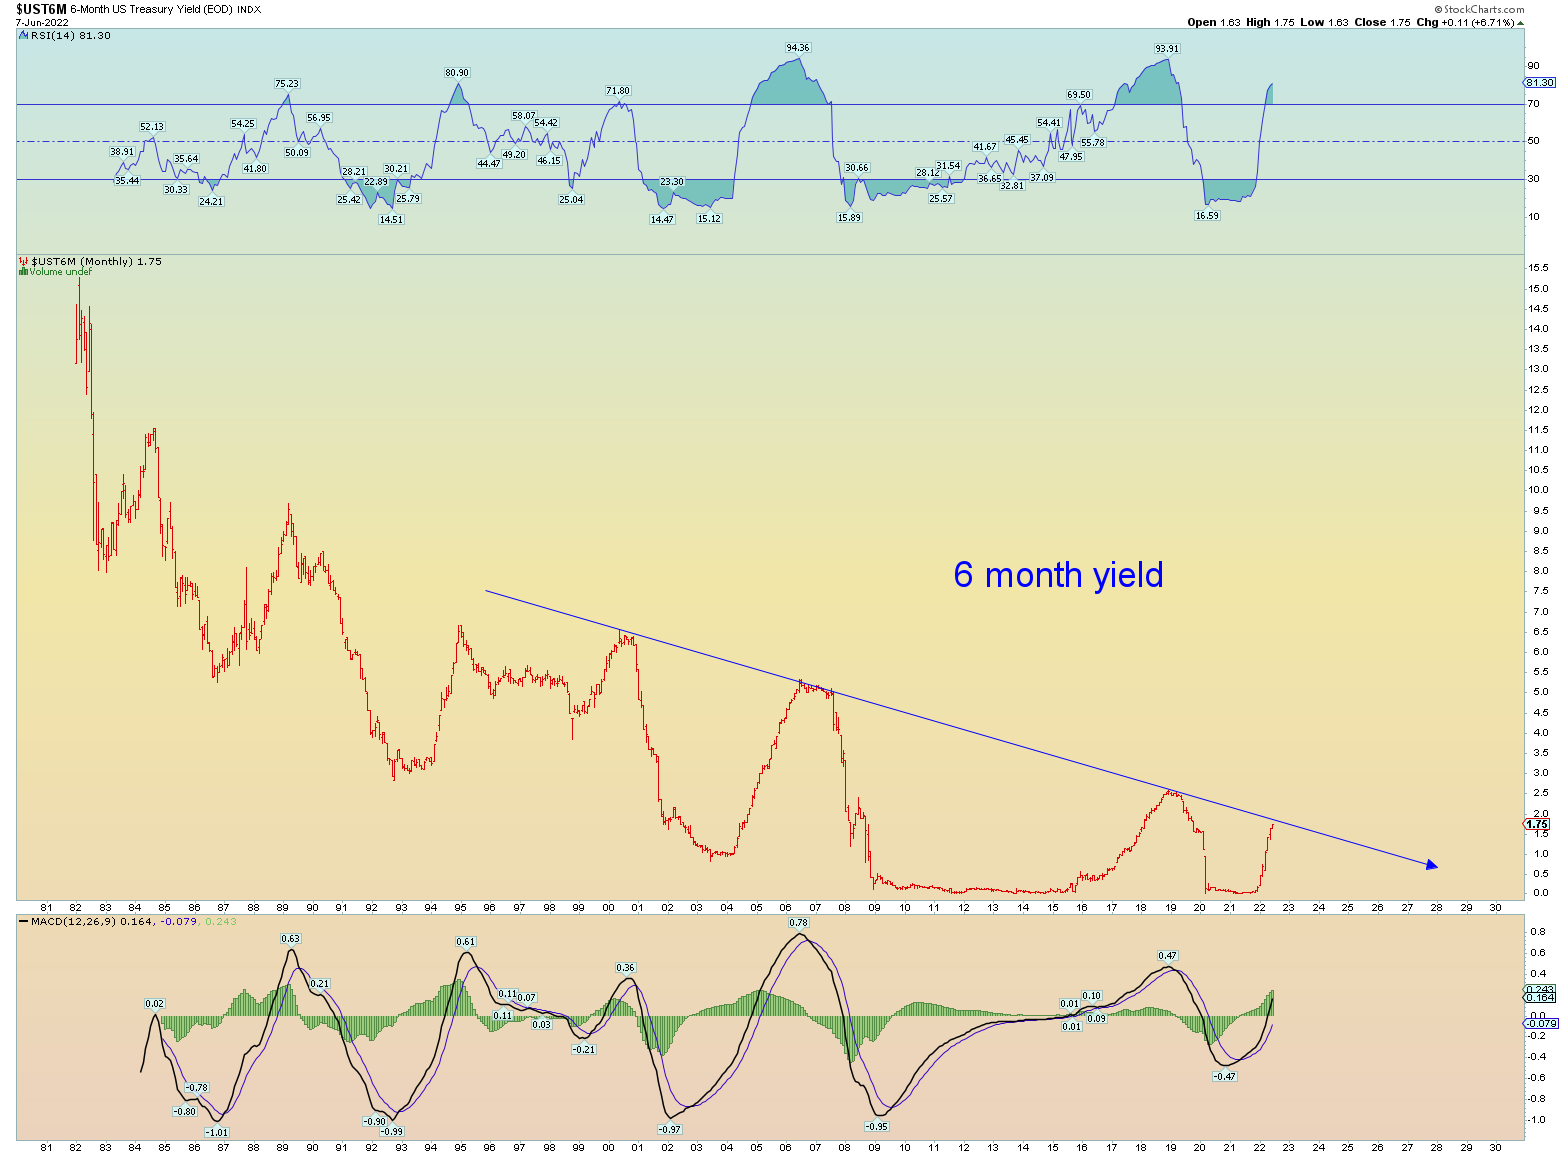
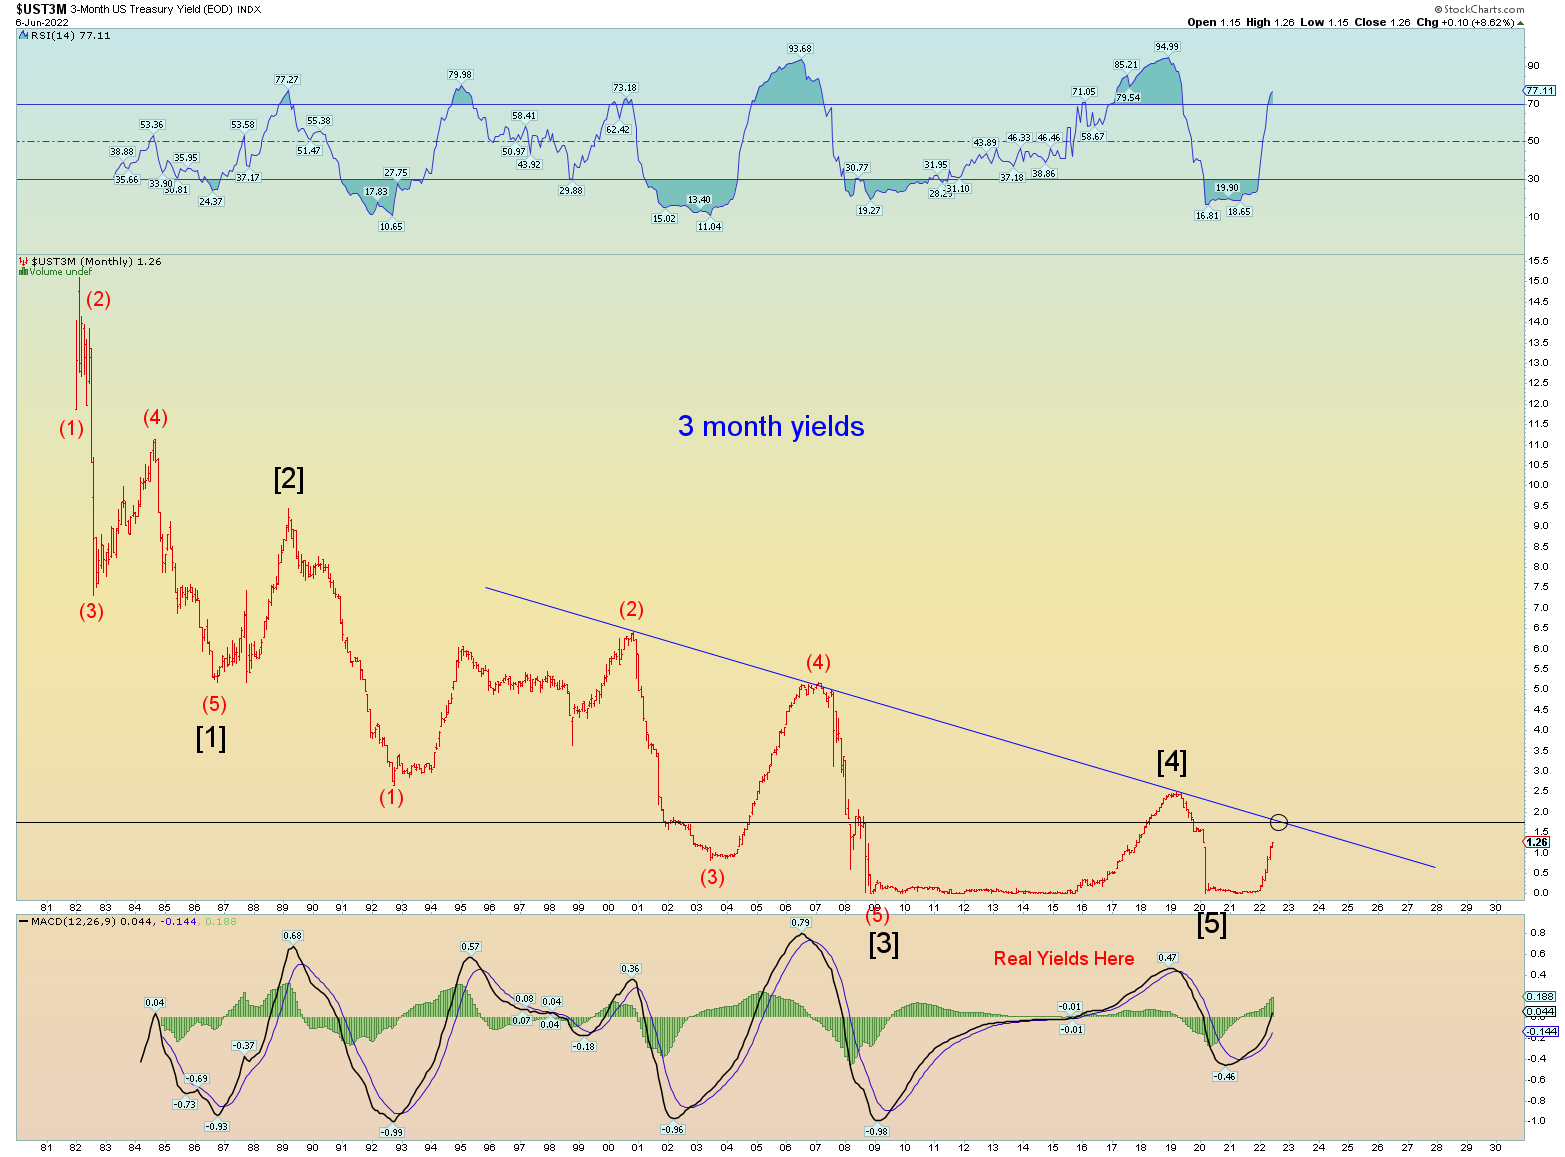
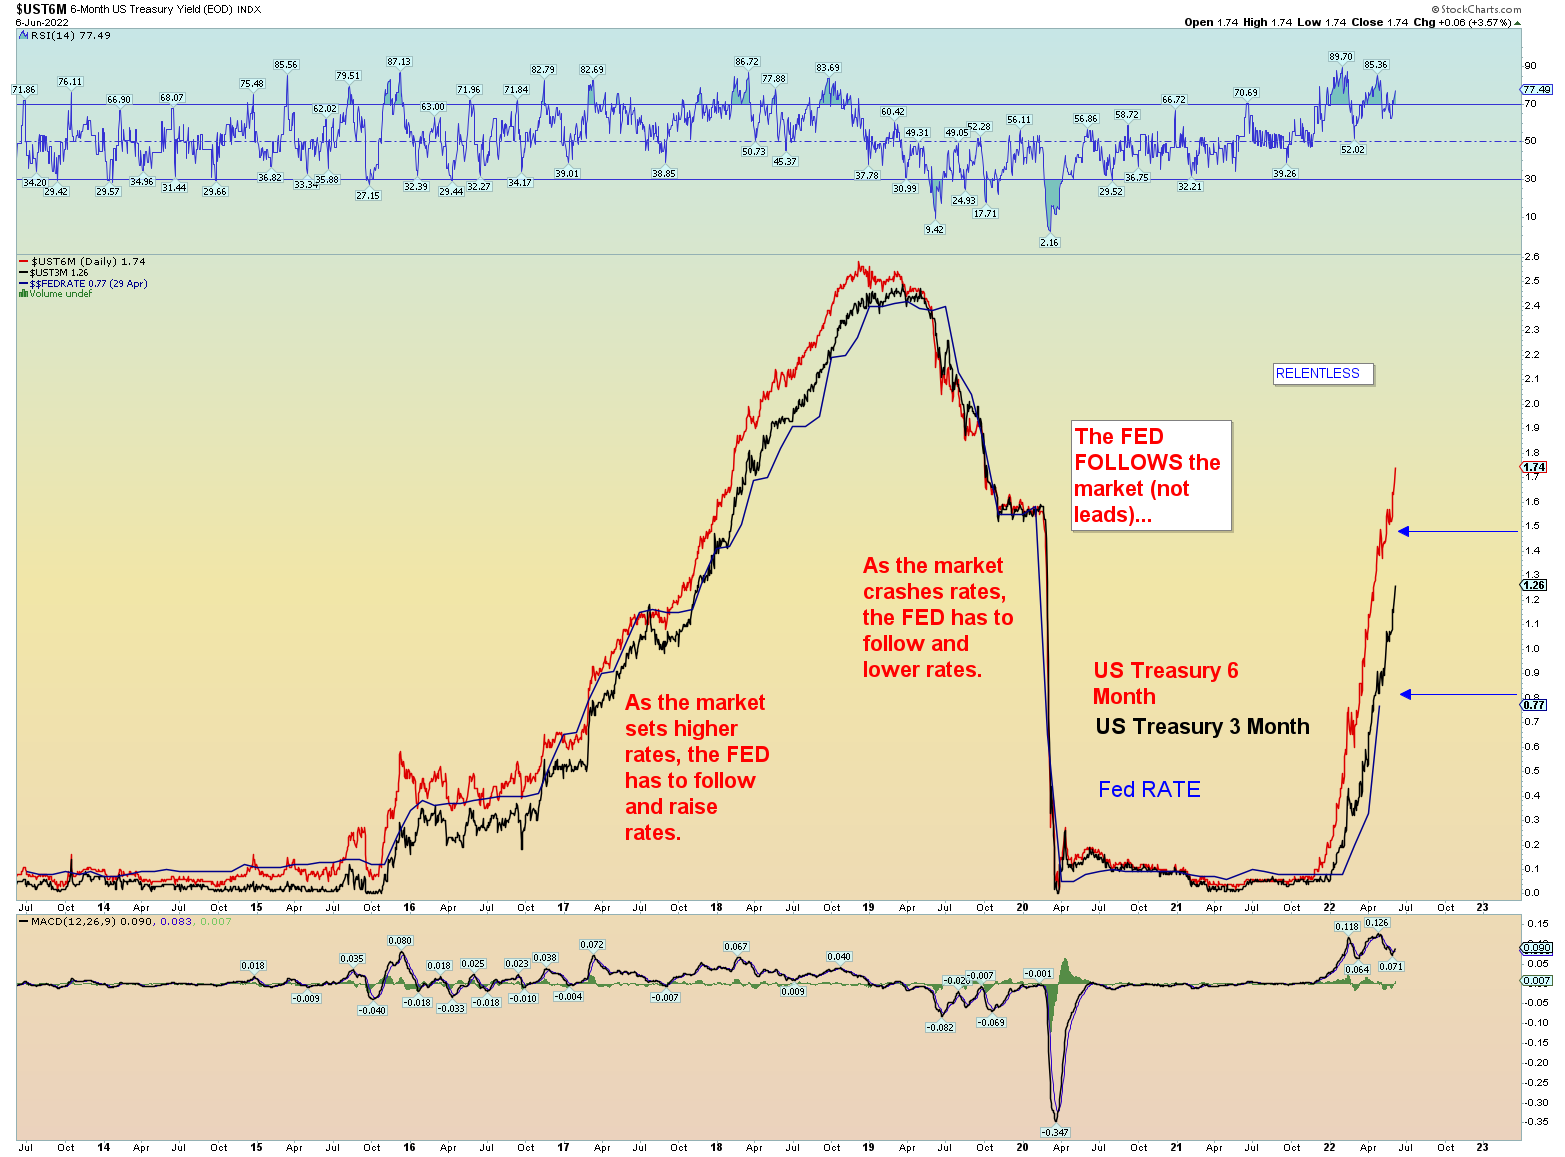
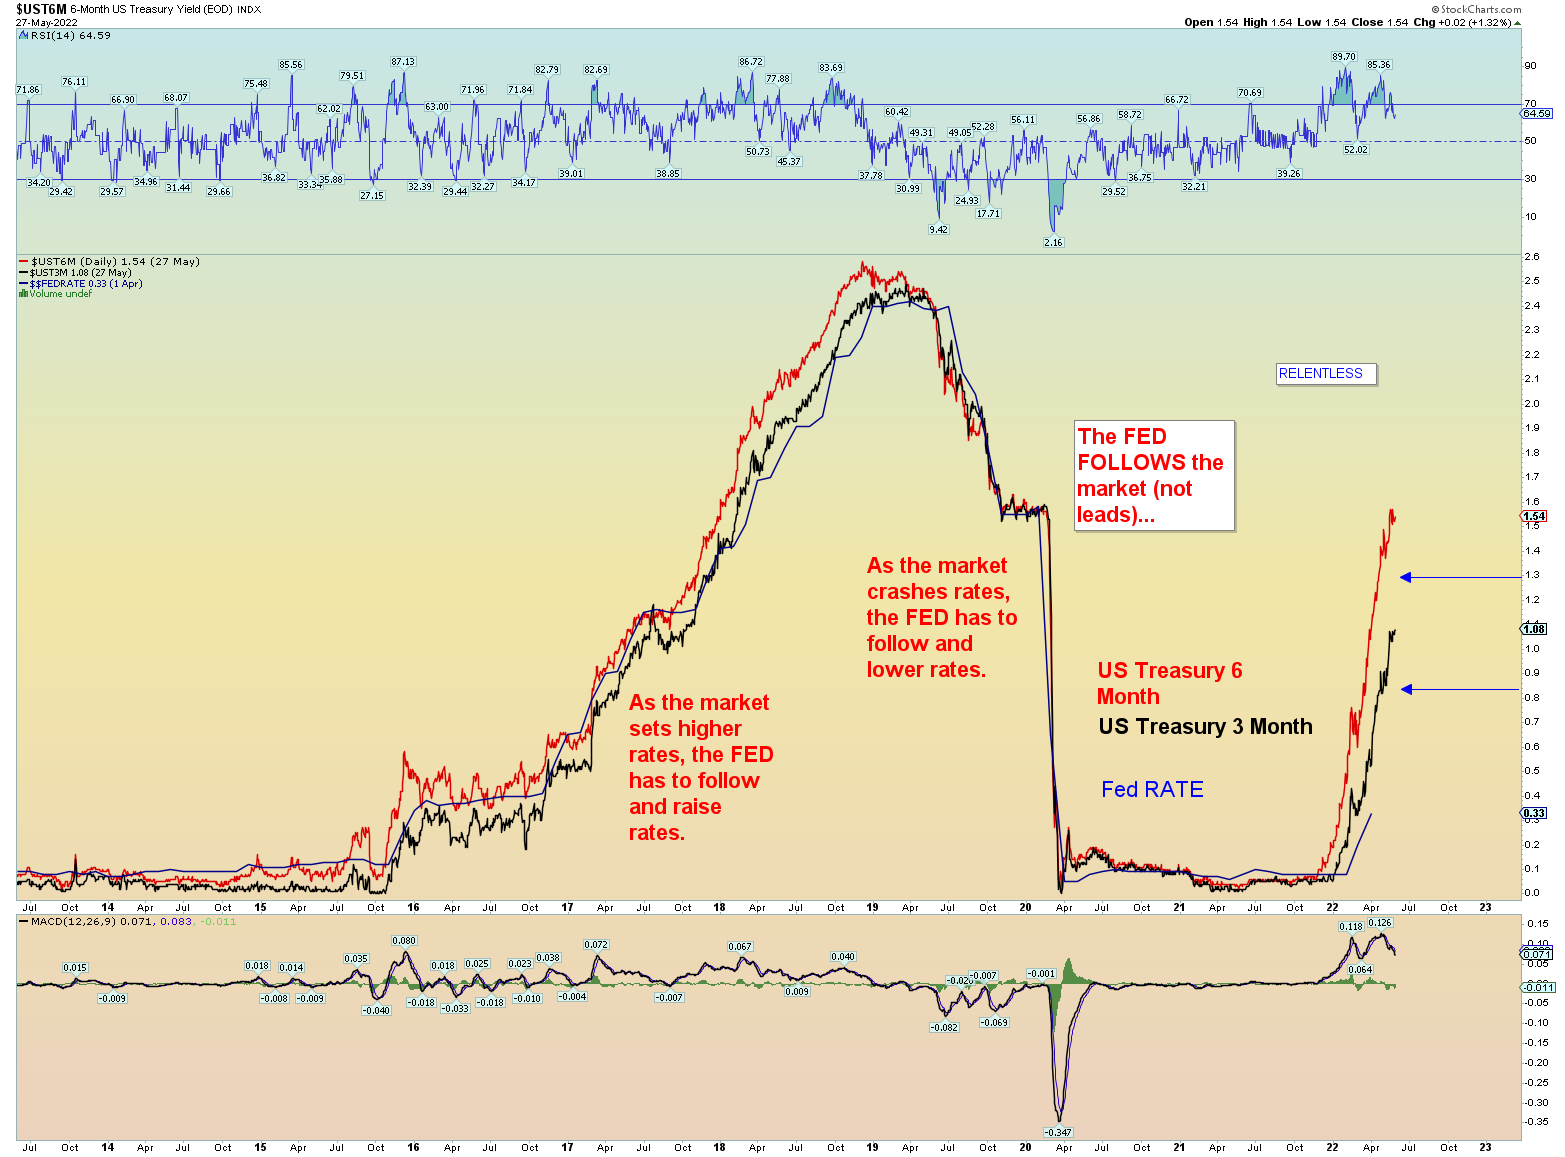
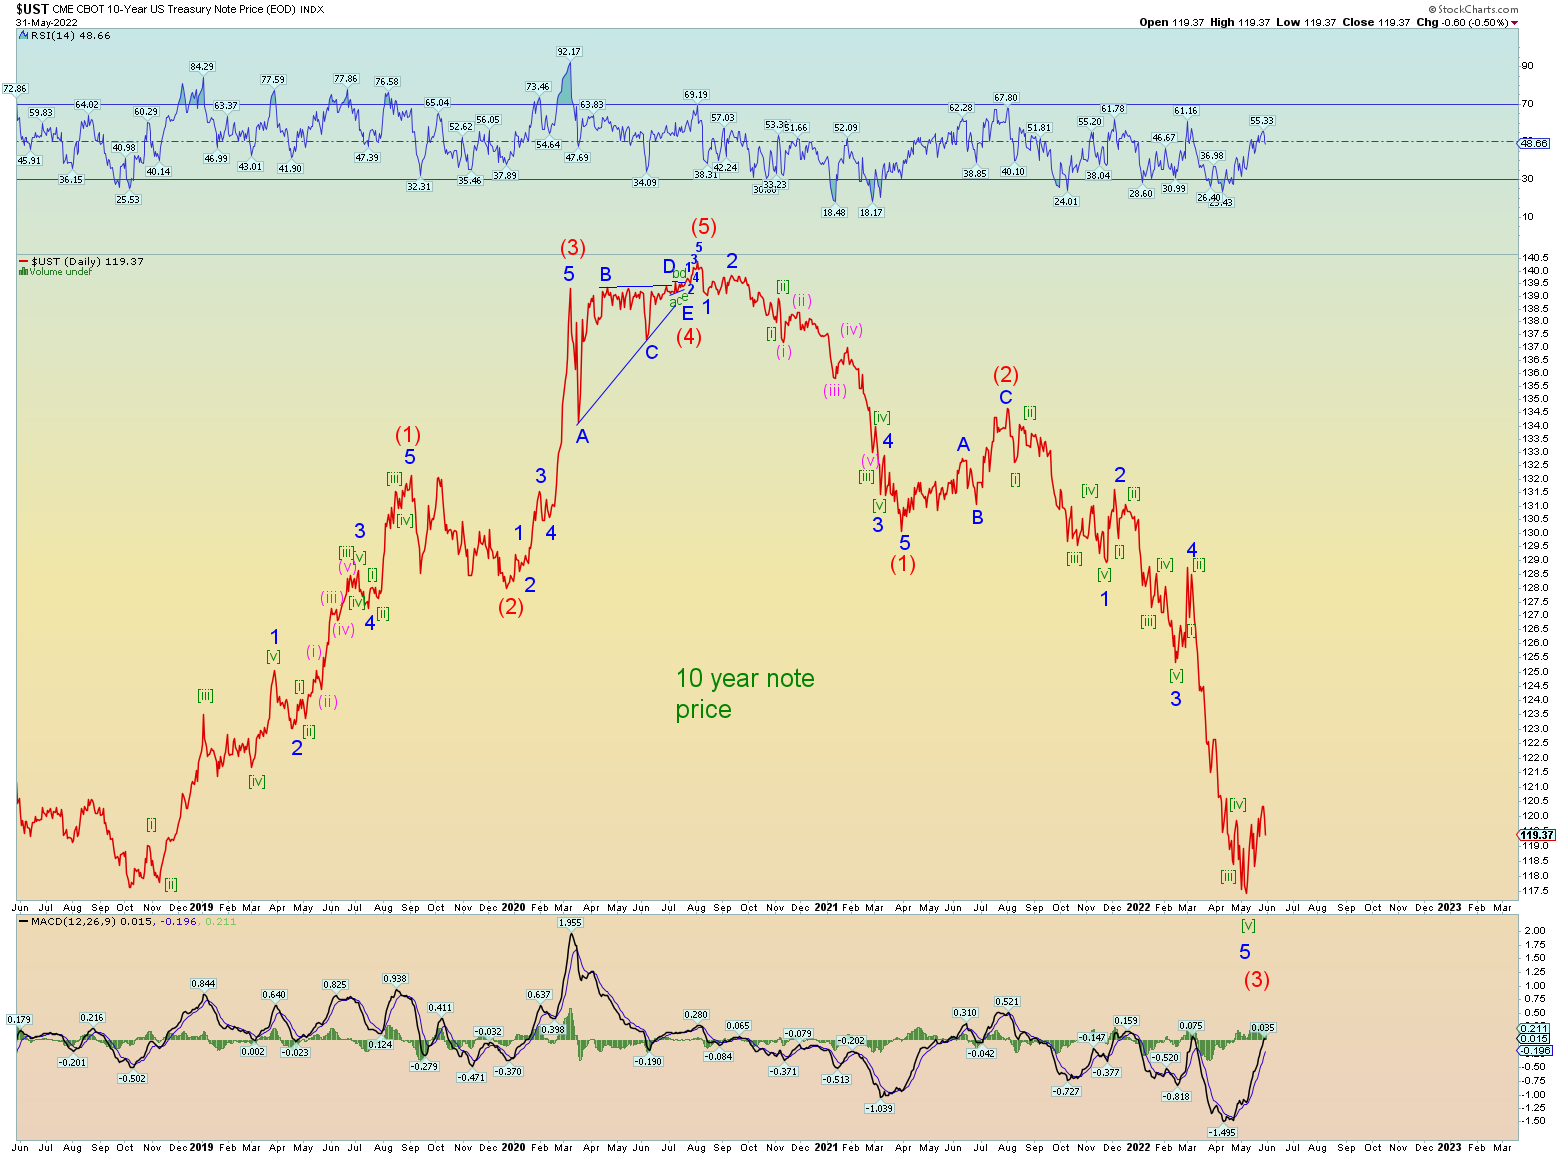
Where are short term interest rates going? At least another .50 point for now. But there is still quite an acceleration gap between the 3- and 6-month rates.
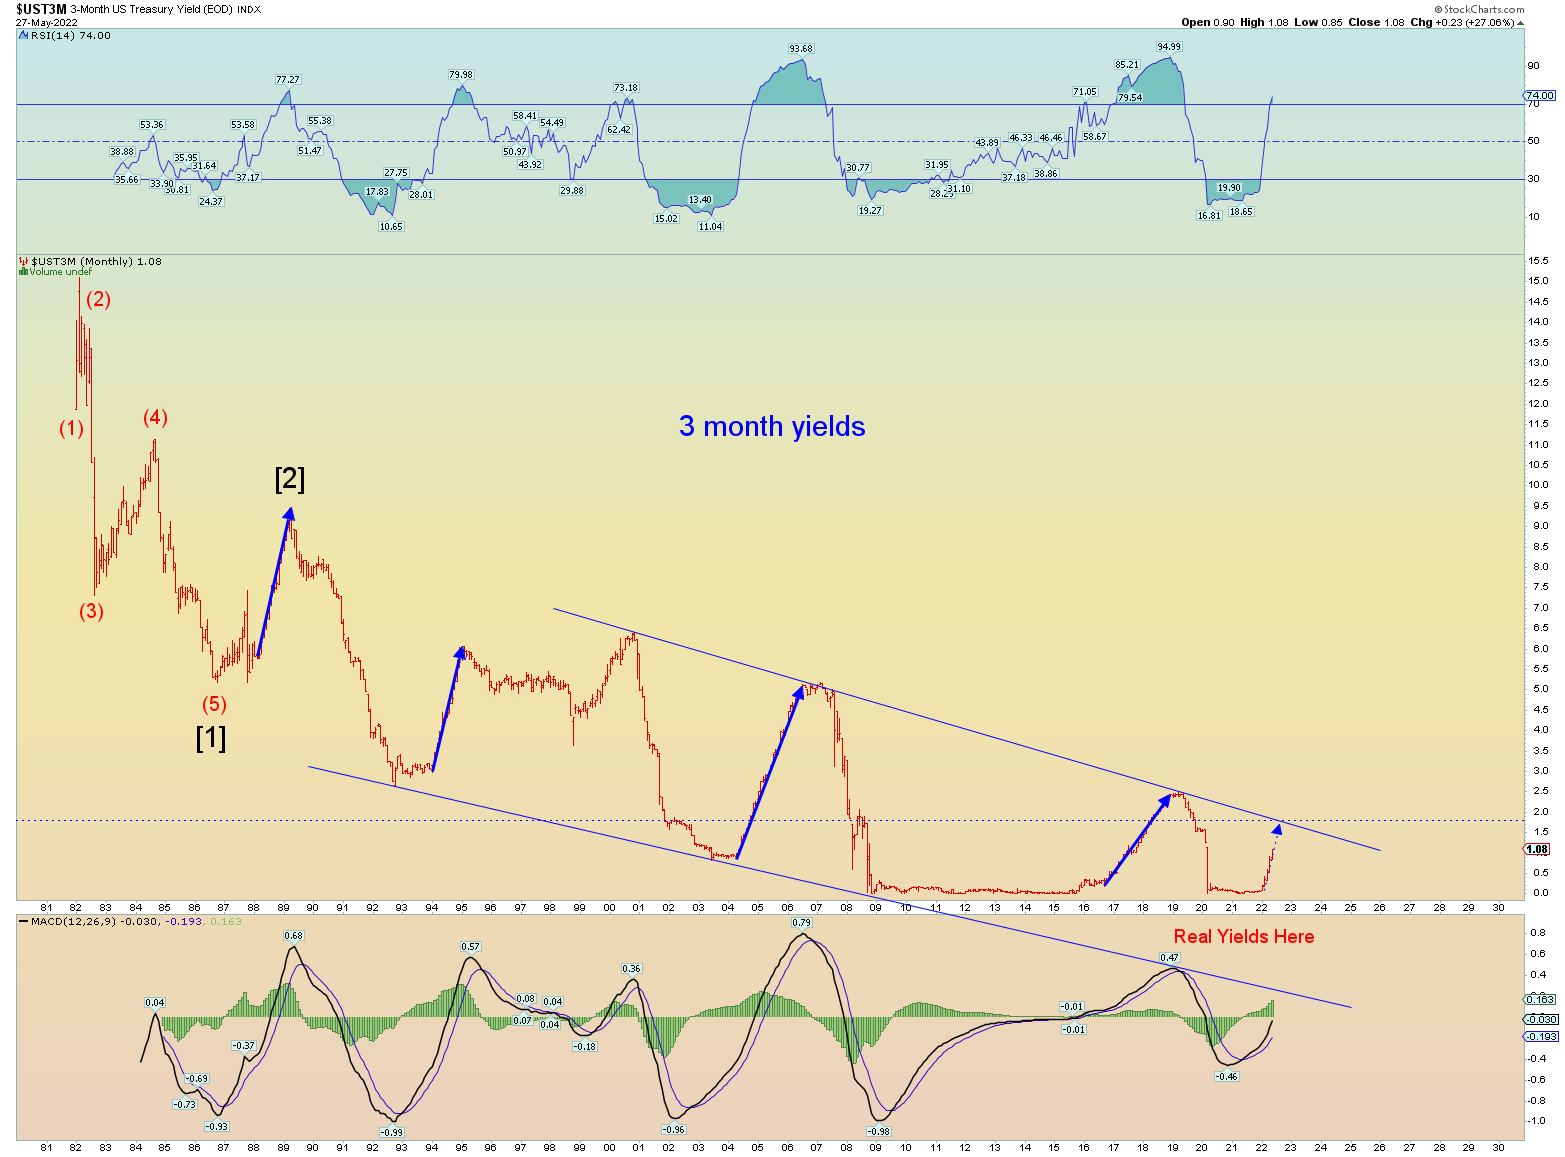
The long term 3-month yield chart. Upside channel line sits at about 1.65 – 1.75 depending on how fast it rises. That’s about another full 1 point of hiking in the long run. It’ll be interesting if prices make it to the downtrend line. Will they hold? Or will this signal a new long term supercycle of rising interest rates?
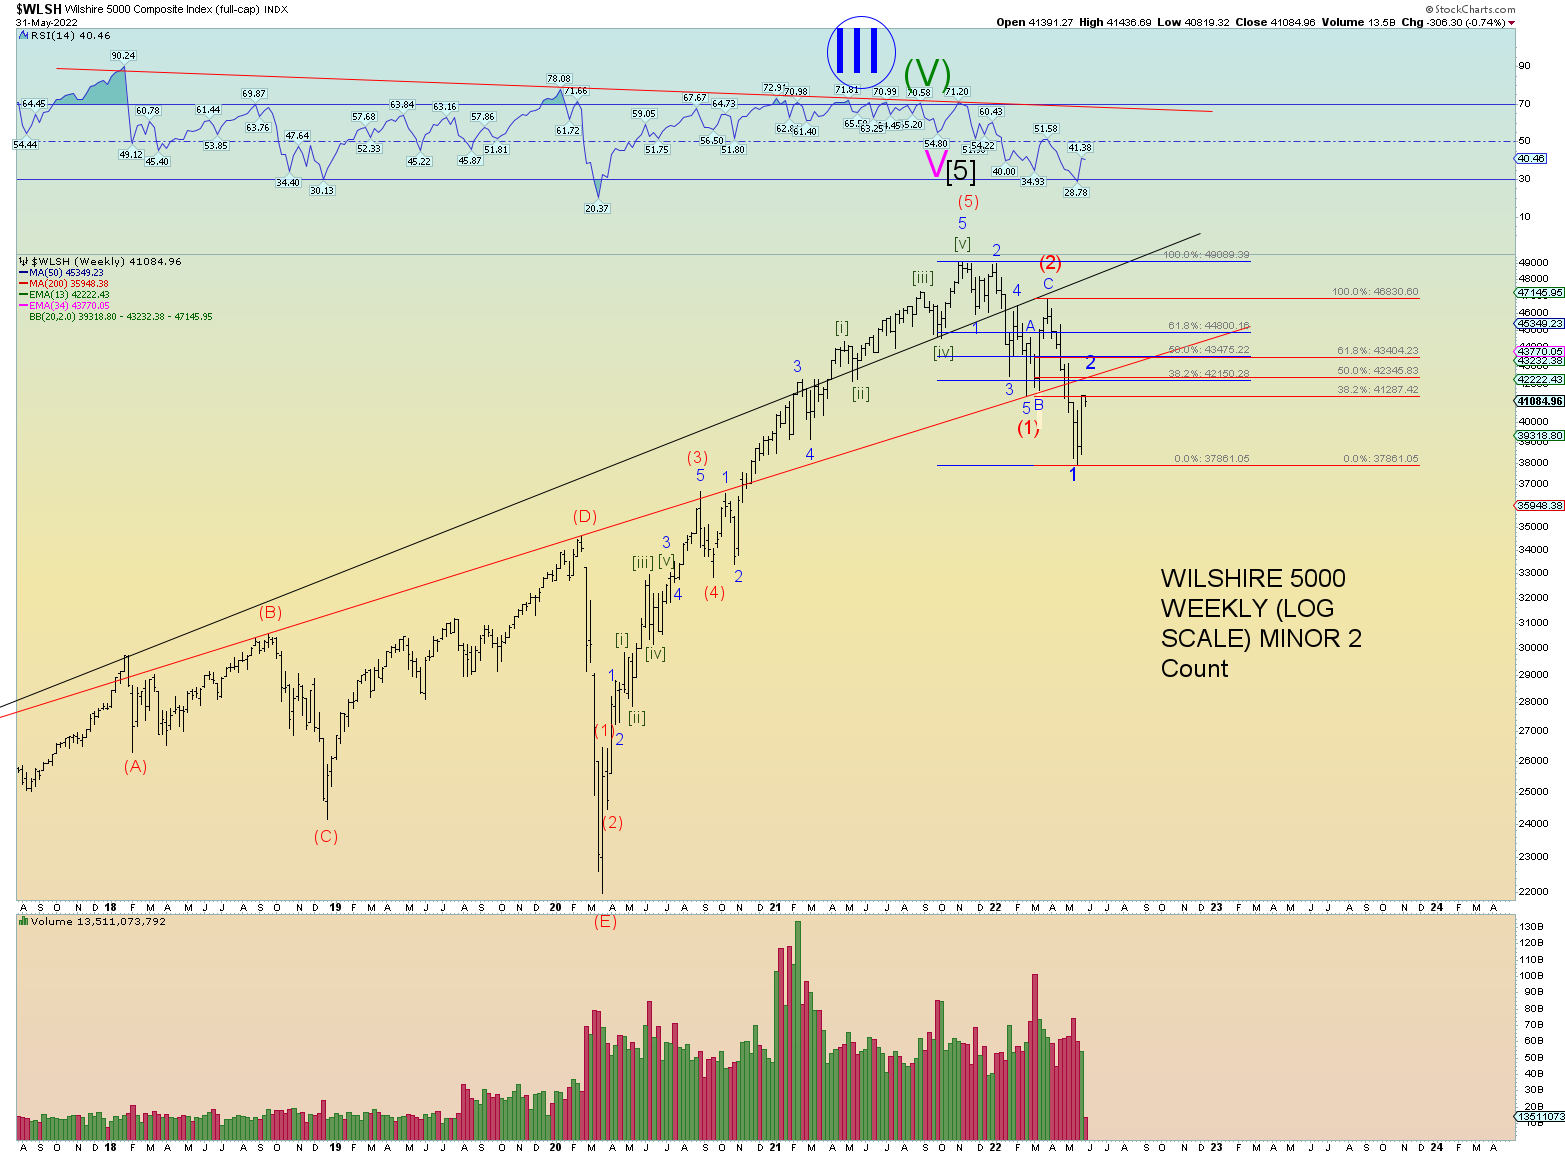
Wilshire monthly. Despite the aggressive rally, the monthly candle ends in a doji of sorts.
Wilshire expanded Minor 2 target range. I would also like to point out there are enough waves in place to consider Minor 2 “over”.
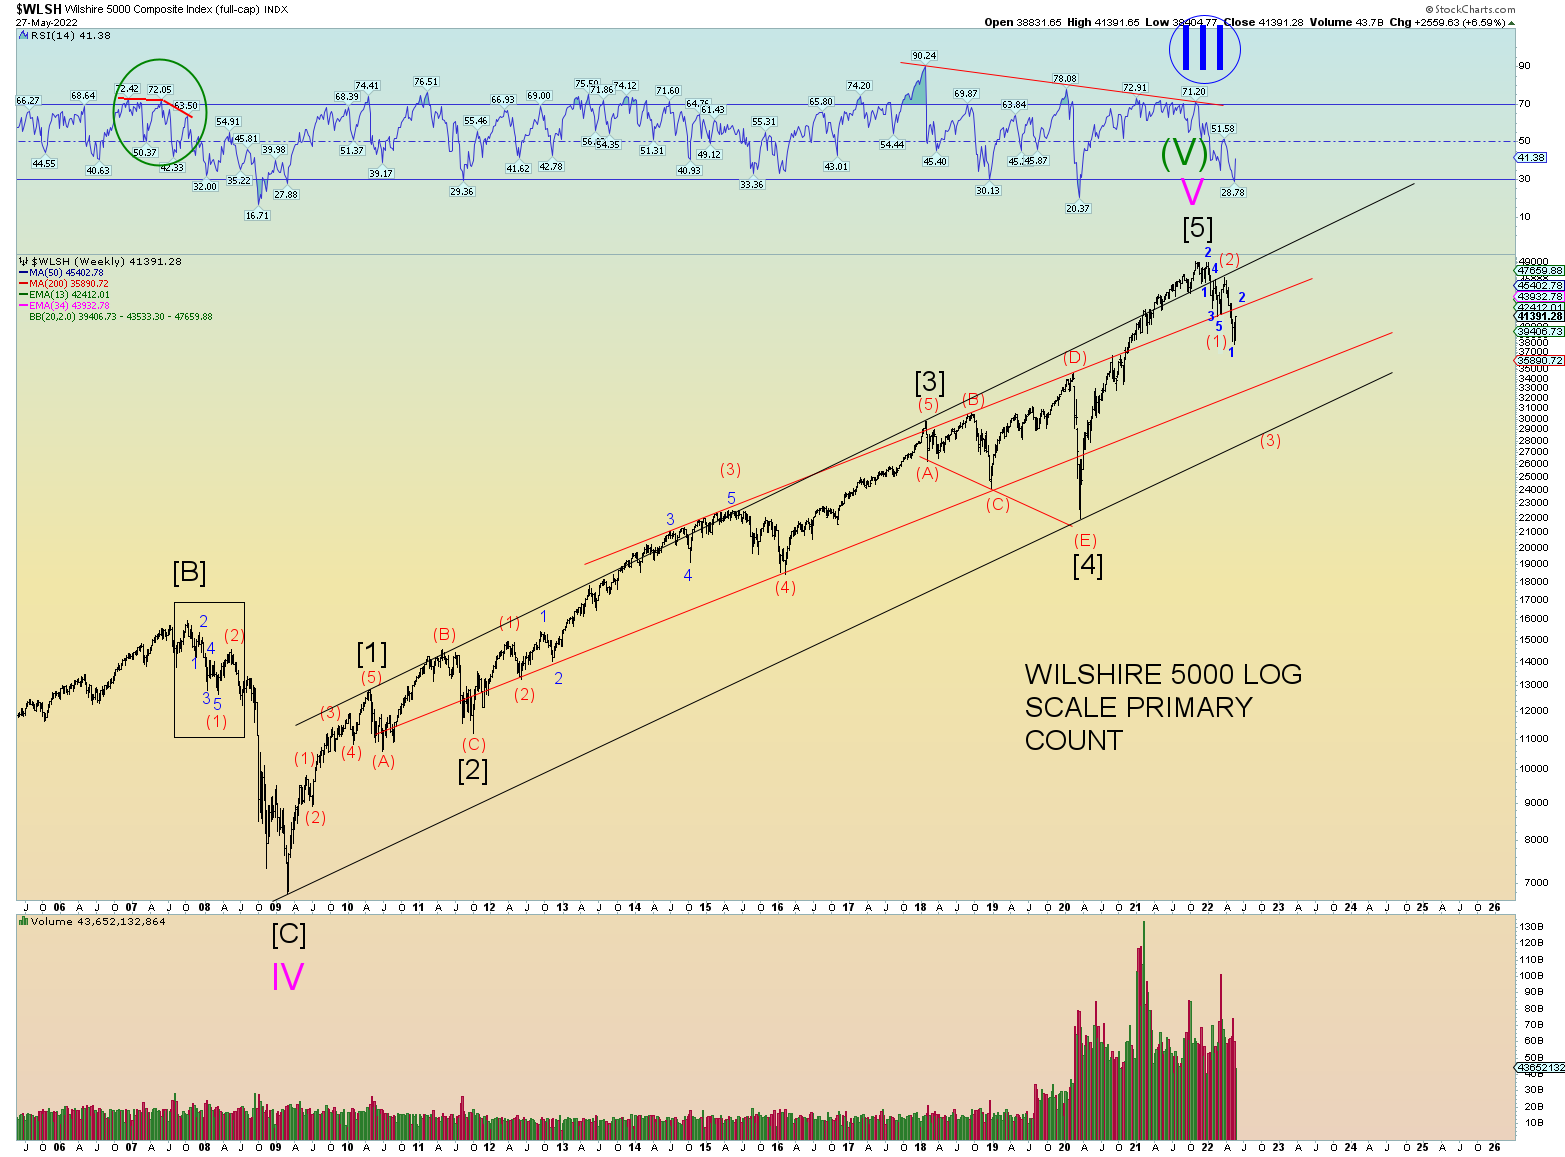
This next weekly shows where and how the red channel lines formed.
There is a bit of room to top out and backtest that line. That is the primary count.
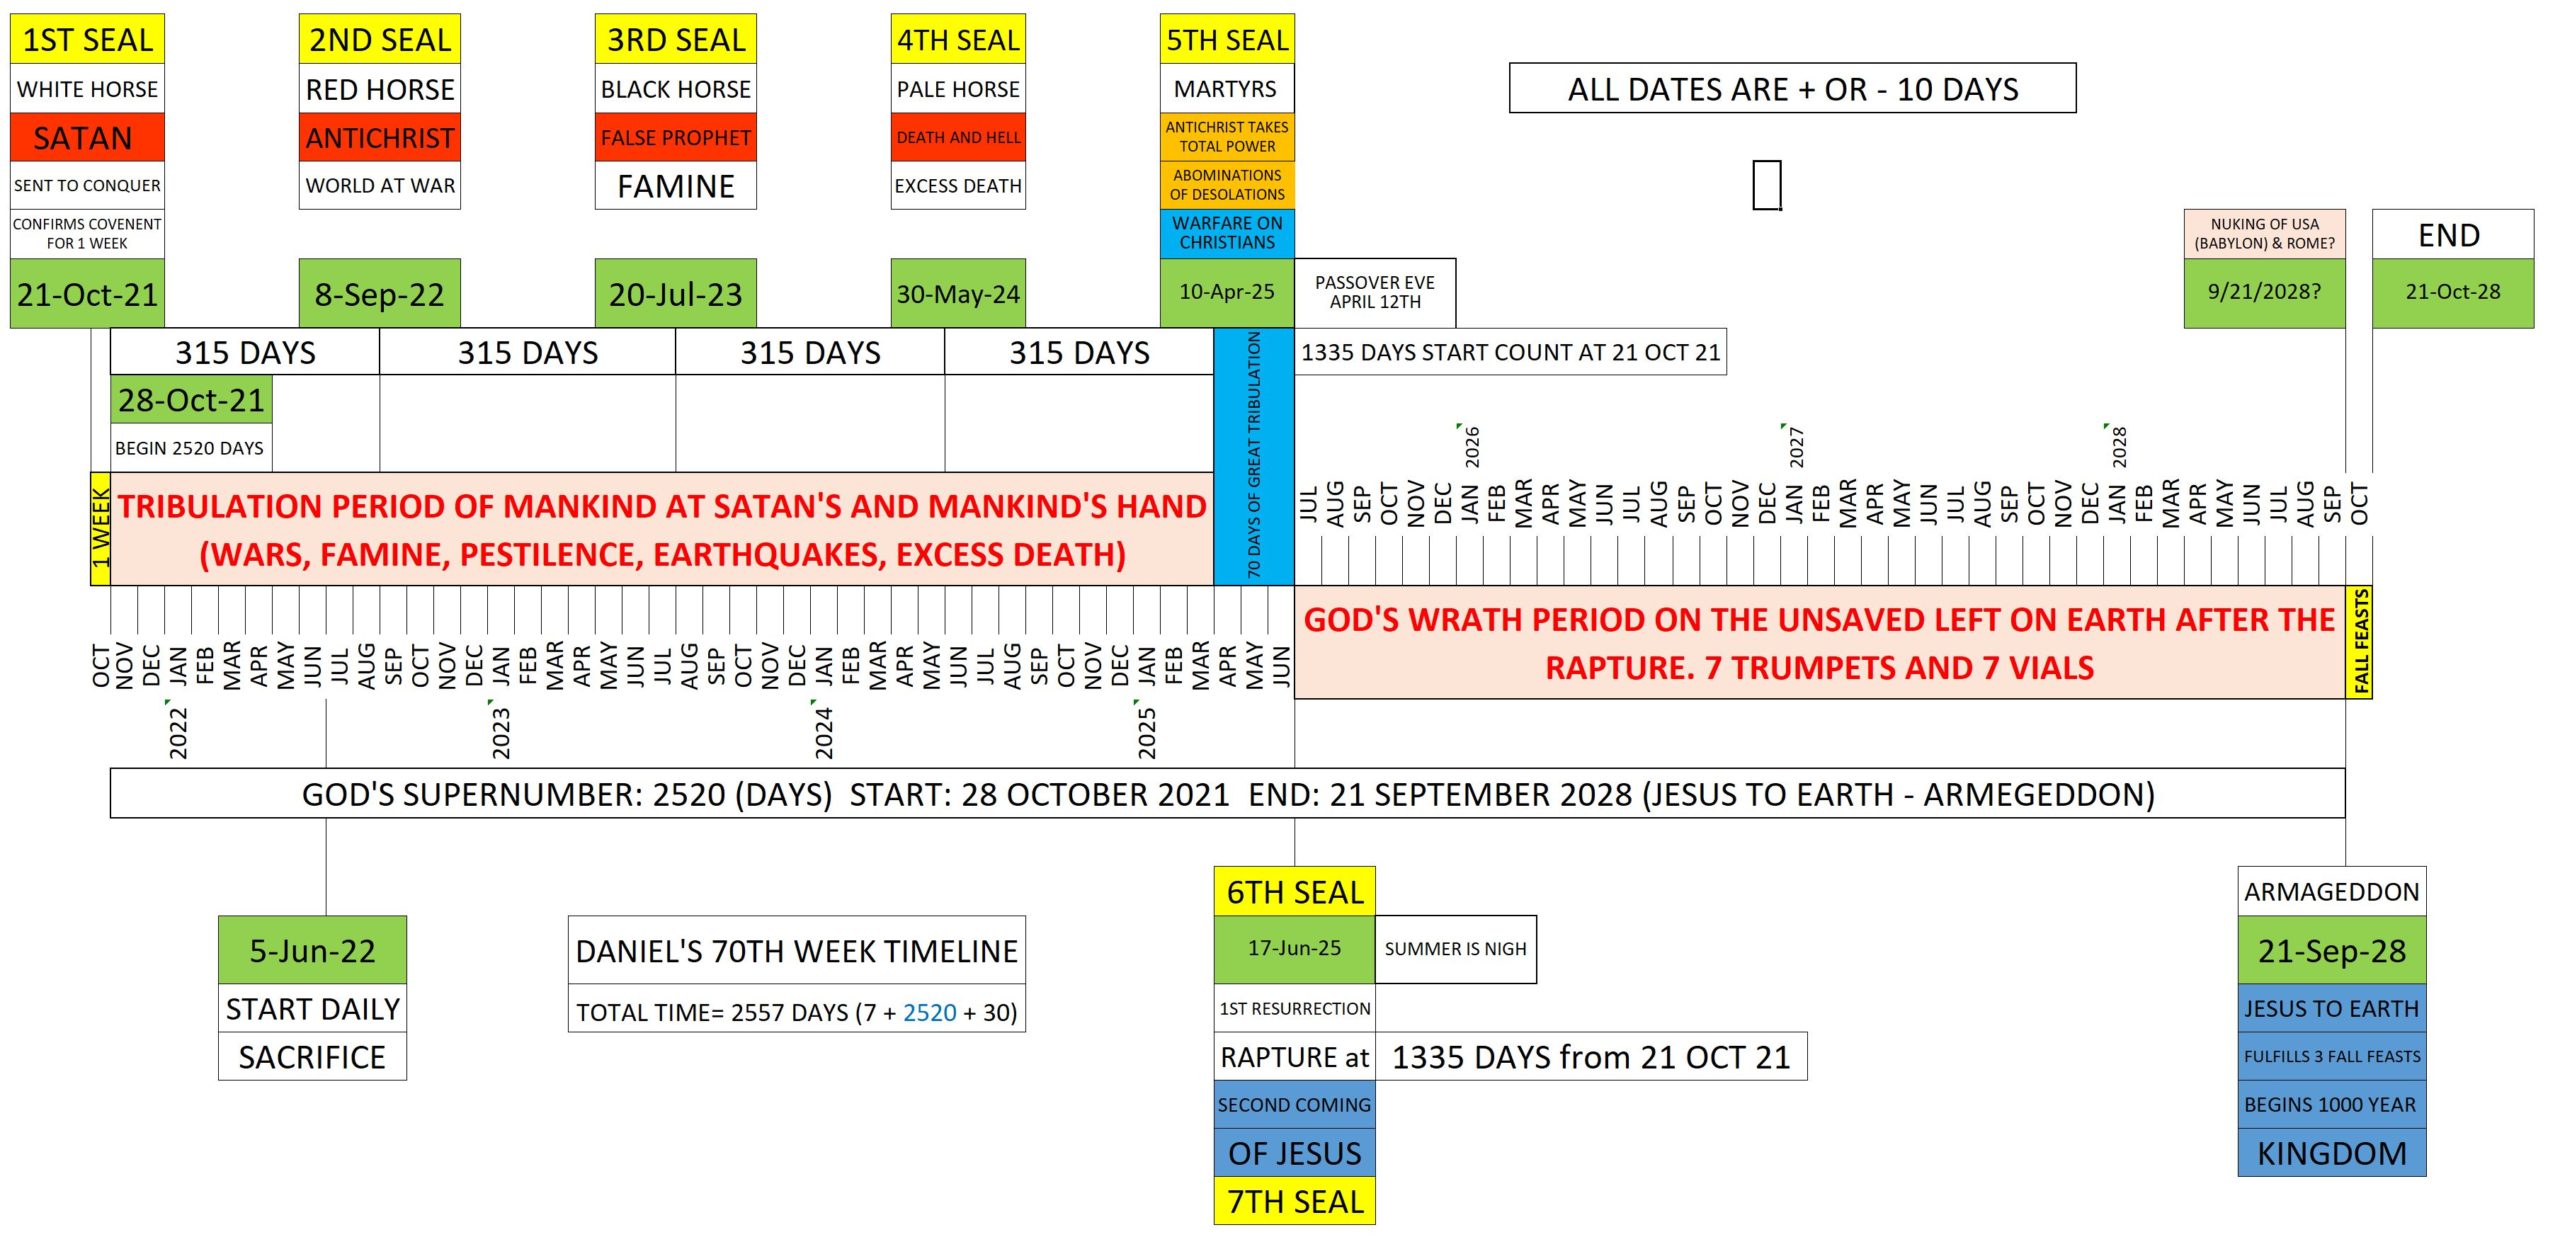
I have been blogging that the world may have started the beginning of Daniel’s 70th week (the final 7 years of earth as we know it) on or about the last week of October 2021. I have made the case that Volodymyr Zelenskyy could very well be the Antichrist of the Bible. Even so, I have been careful to state that this can only be true if the world finds itself in near total global warfare before the year 2022 is finished, even by September this year.
Like Elliott Waves, the theory is logical. The bible teaches that we are to look for wars and rumors of wars eventually leading to global war, famine, pestilence, earthquakes and then eventual excess death to determine if the four horses of the apocalypse has begun or not. So far, we seem to be on track.
It appears that the world media and Zelenskyy and the Ukrainian army may finally be acknowledging that the war is going somewhat bad for Ukraine. That they may lose the Donbass etc. This is to be expected. For the bible states that the world will eventually be in amazement and in “awe” of the Antichrist:
Revelation 4: And they worshipped the dragon which gave power unto the beast: and they worshipped the beast, saying, Who is like unto the beast? who is able to make war with him?
Who is able to make war with him? The “beast” of course is referring to the Antichrist. Indeed, that has not really been the case so far with Zelenskyy although through propaganda he has won a few military victories. Although he has definitely been supported and many world leaders have come and pledged fealty to him, at this moment in time, it appears the Russian army will eventually grind the Ukrainian resistance to a pulp. Indeed, that may happen.
The world is beginning to doubt Zelenskyy and the war with Russia. Afterall, the (NWO) world wants winners, and backs winners. And so far, Zelenskyy, despite the massive western media propaganda, is probably losing this war militarily. But is he losing it politically? What will be the final outcome? Will he make a military comeback?
Again, the political and military situation for Zelenskyy seems to be a little bit in doubt. If he “loses” Eastern Ukraine to the Russians, many people will blame him for the death and carnage and more negative publicity will be brought to the forefront. After all, if Zelenskyy is the Antichrist leader that the globalist Satanists have backed to the full, they will want results. The globalists-Satanist’s goal is of course to knock Russia down to be able to implement the New World Order. They expect results of Zelenskyy. They have given him an open checkbook.
And so, the current narrative is fascinating. Again, the simple logic is that IF Zelenskyy is the REAL Antichrist of the bible, THEN he will prevail over Russia. If he is not, then he is merely a “foreshadow” of what the real Antichrist will be. A warmonger, a “little” horn” who went up against a nuclear power.
My point is this: I expect major setbacks for Zelenskyy and Ukraine. For how will the world be amazed if they had not been already given up for dead, expected to lose the war? In fact, if Zelenskyy and Ukraine were on the brink of total defeat it is to be expected in the grand scheme of things. How else could Zelenskyy be deemed a “great warrior” that the bible describes if he has not been first on the brink of elimination?
David vs. Goliath comes to mind in the bible. And remember, Satan wants to copy and imitate everything he can in the bible. The story of the ultimate underdog overcoming the worst odds and defeating an enemy that no one thought possible. THAT is the situation where Zelenskyy finds himself in.
Again, prove me wrong. I don’t necessarily want this to be the end times of Revelation. If Zelenskyy is defeated and jailed or even killed, then obviously I was wrong. He has not only defied Russia to this day, but he also seems to be more determined than ever. Willing to allow hundreds and thousands of deaths and for what? And this is not a “normal” human trait, at least in this day and age. This is perhaps a trait of an Antichrist.
And what of Putin? Obviously, the devil is driving him also. He will not retreat. In fact, the real goal of Putin is to not only take eastern regions of Ukraine, the Donbass, etc. but Kharkov and Odessa. And militarily speaking, he is a long way away from that goal. So, the war will ebb and flow both real and imagined.
In the end, the logic is thus: IF Zelenskyy is the real Antichrist of the bible, THEN he will prevail over Russia.
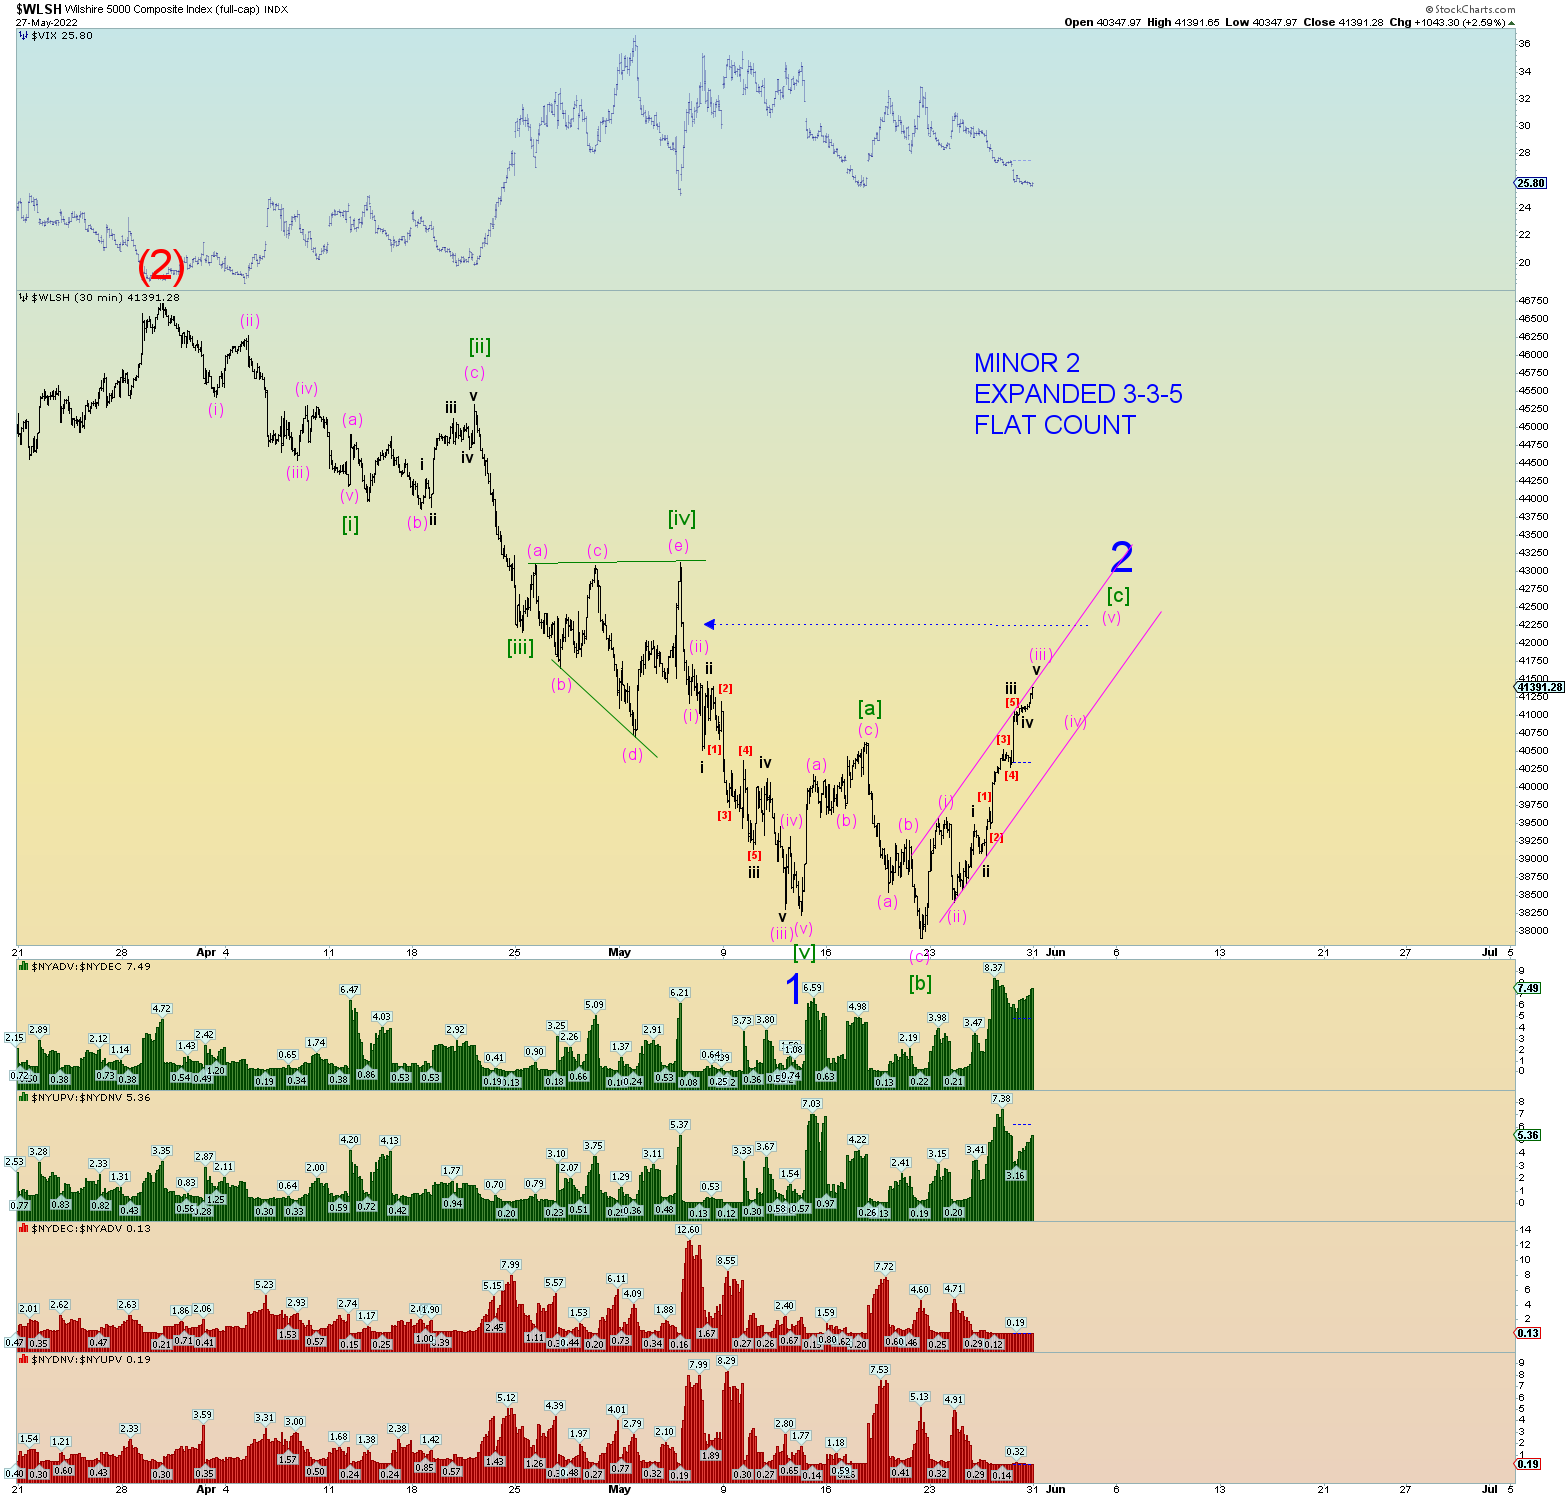
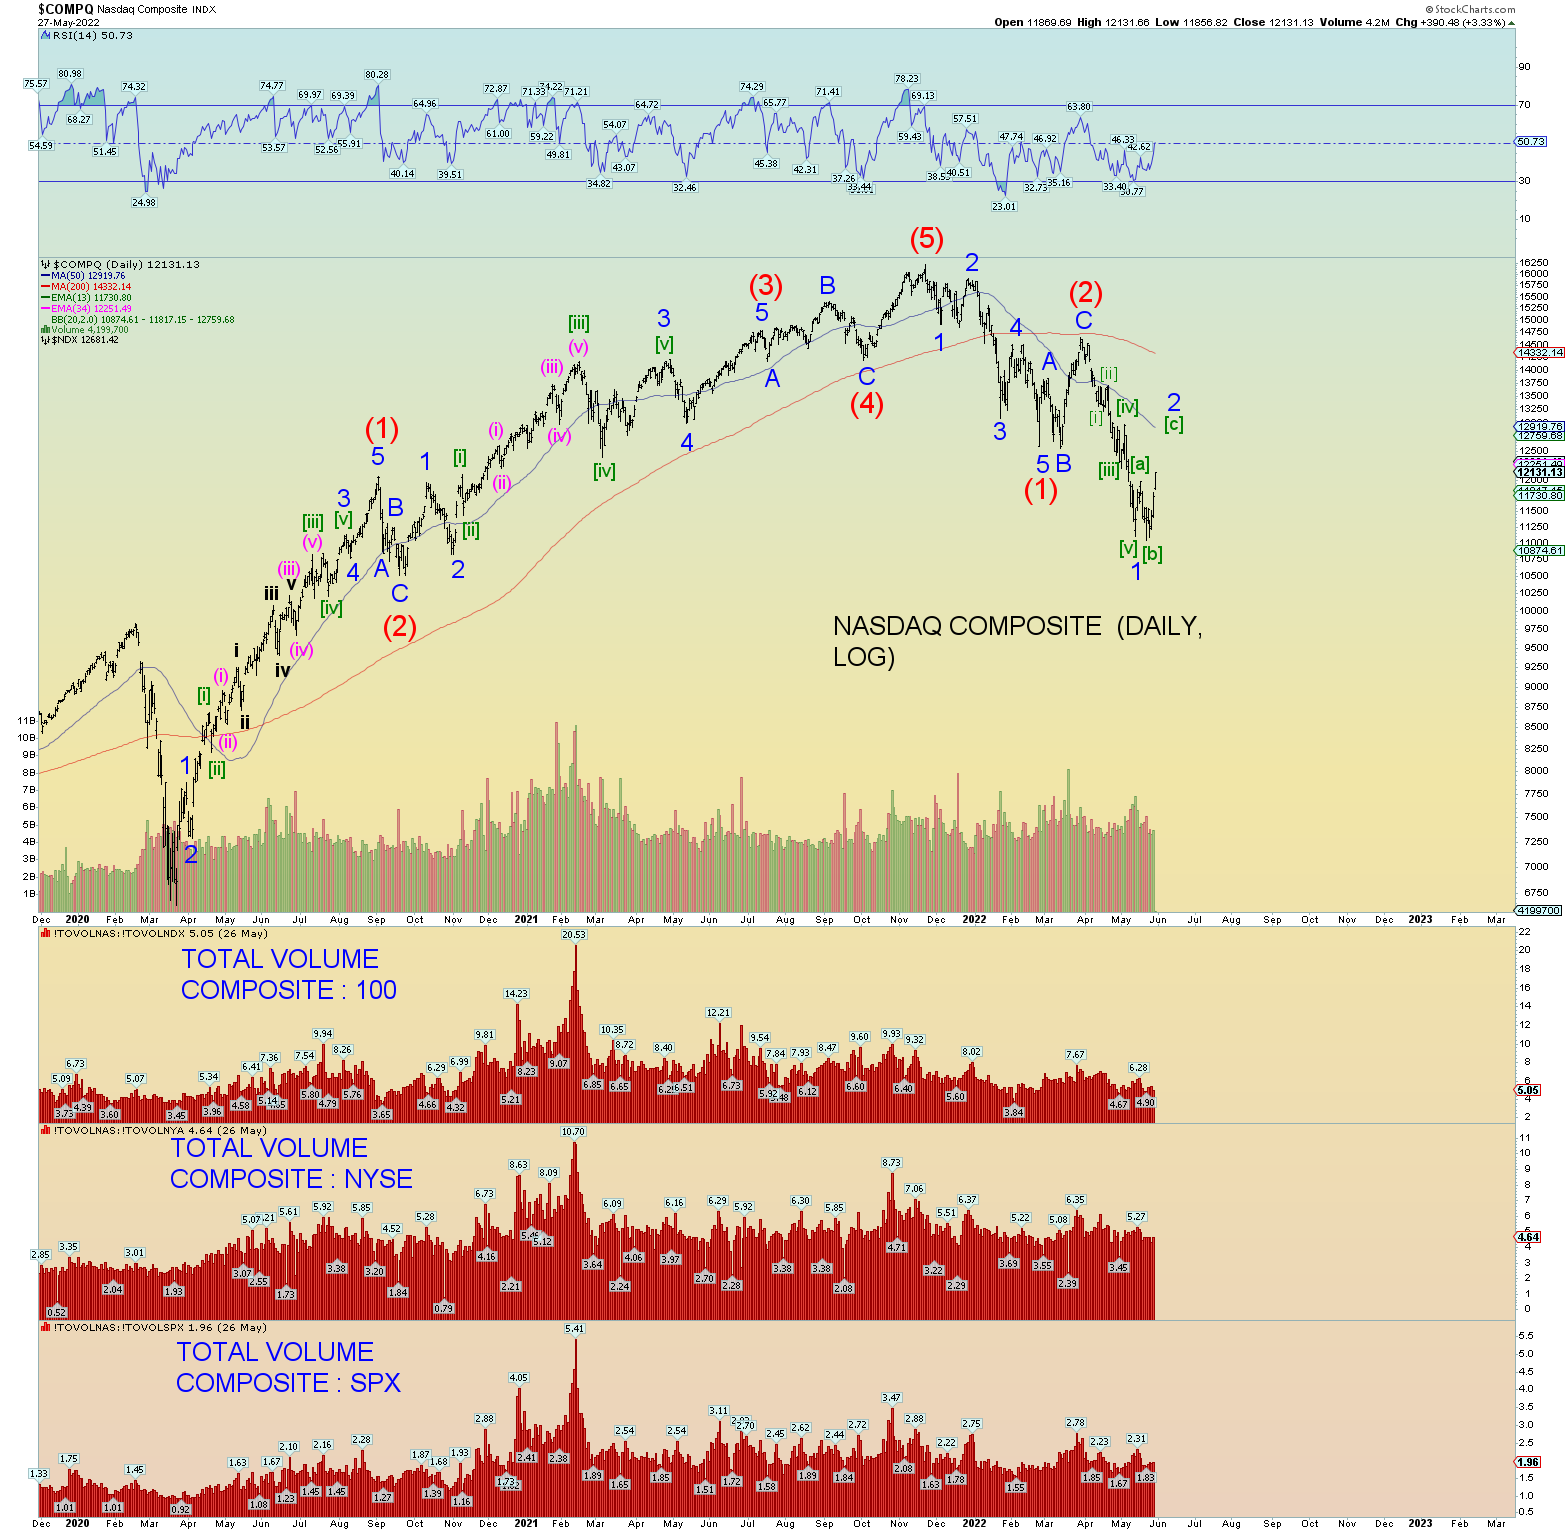
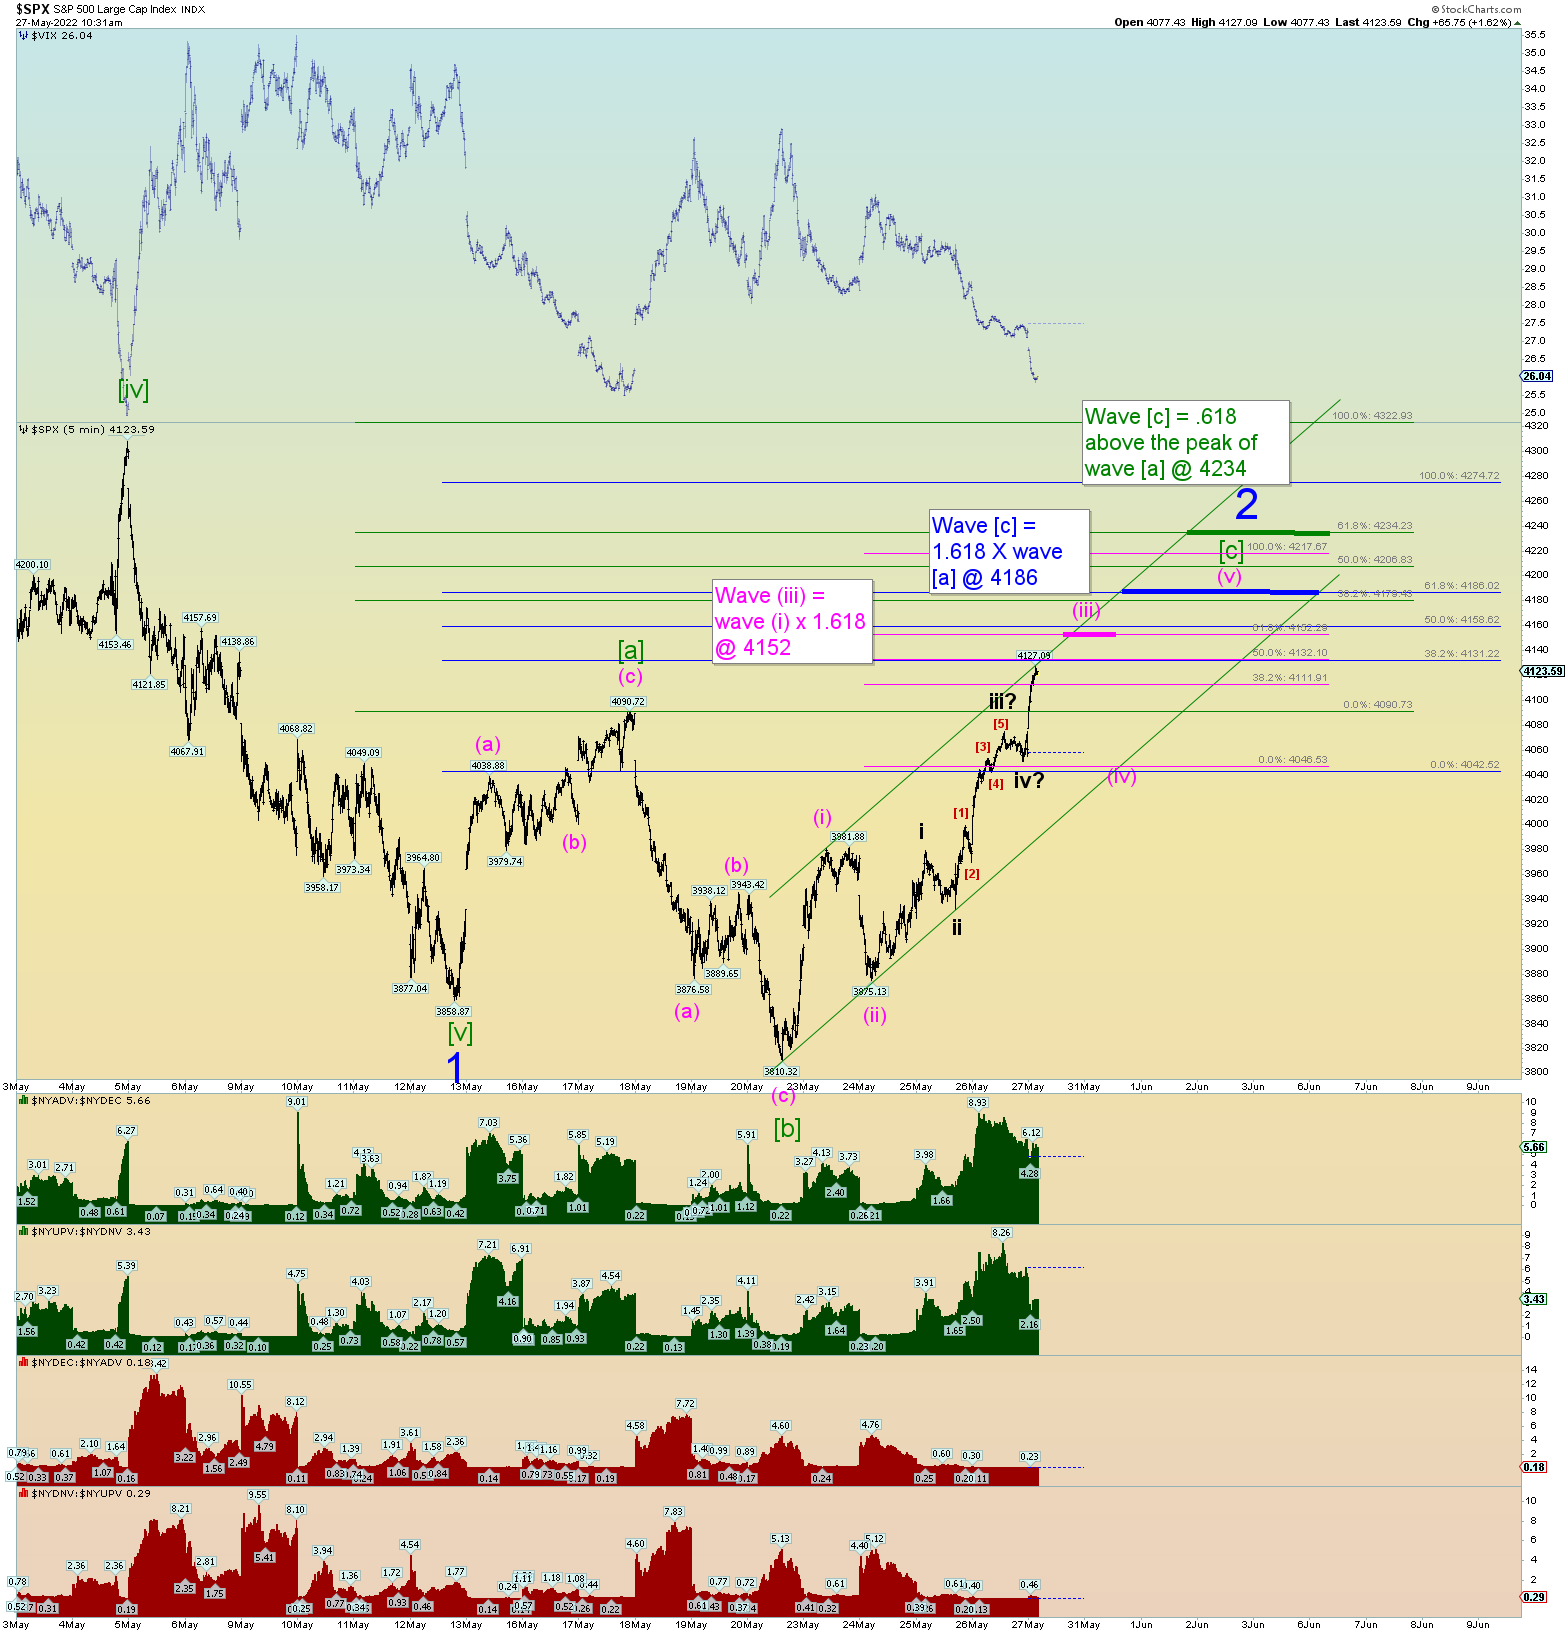
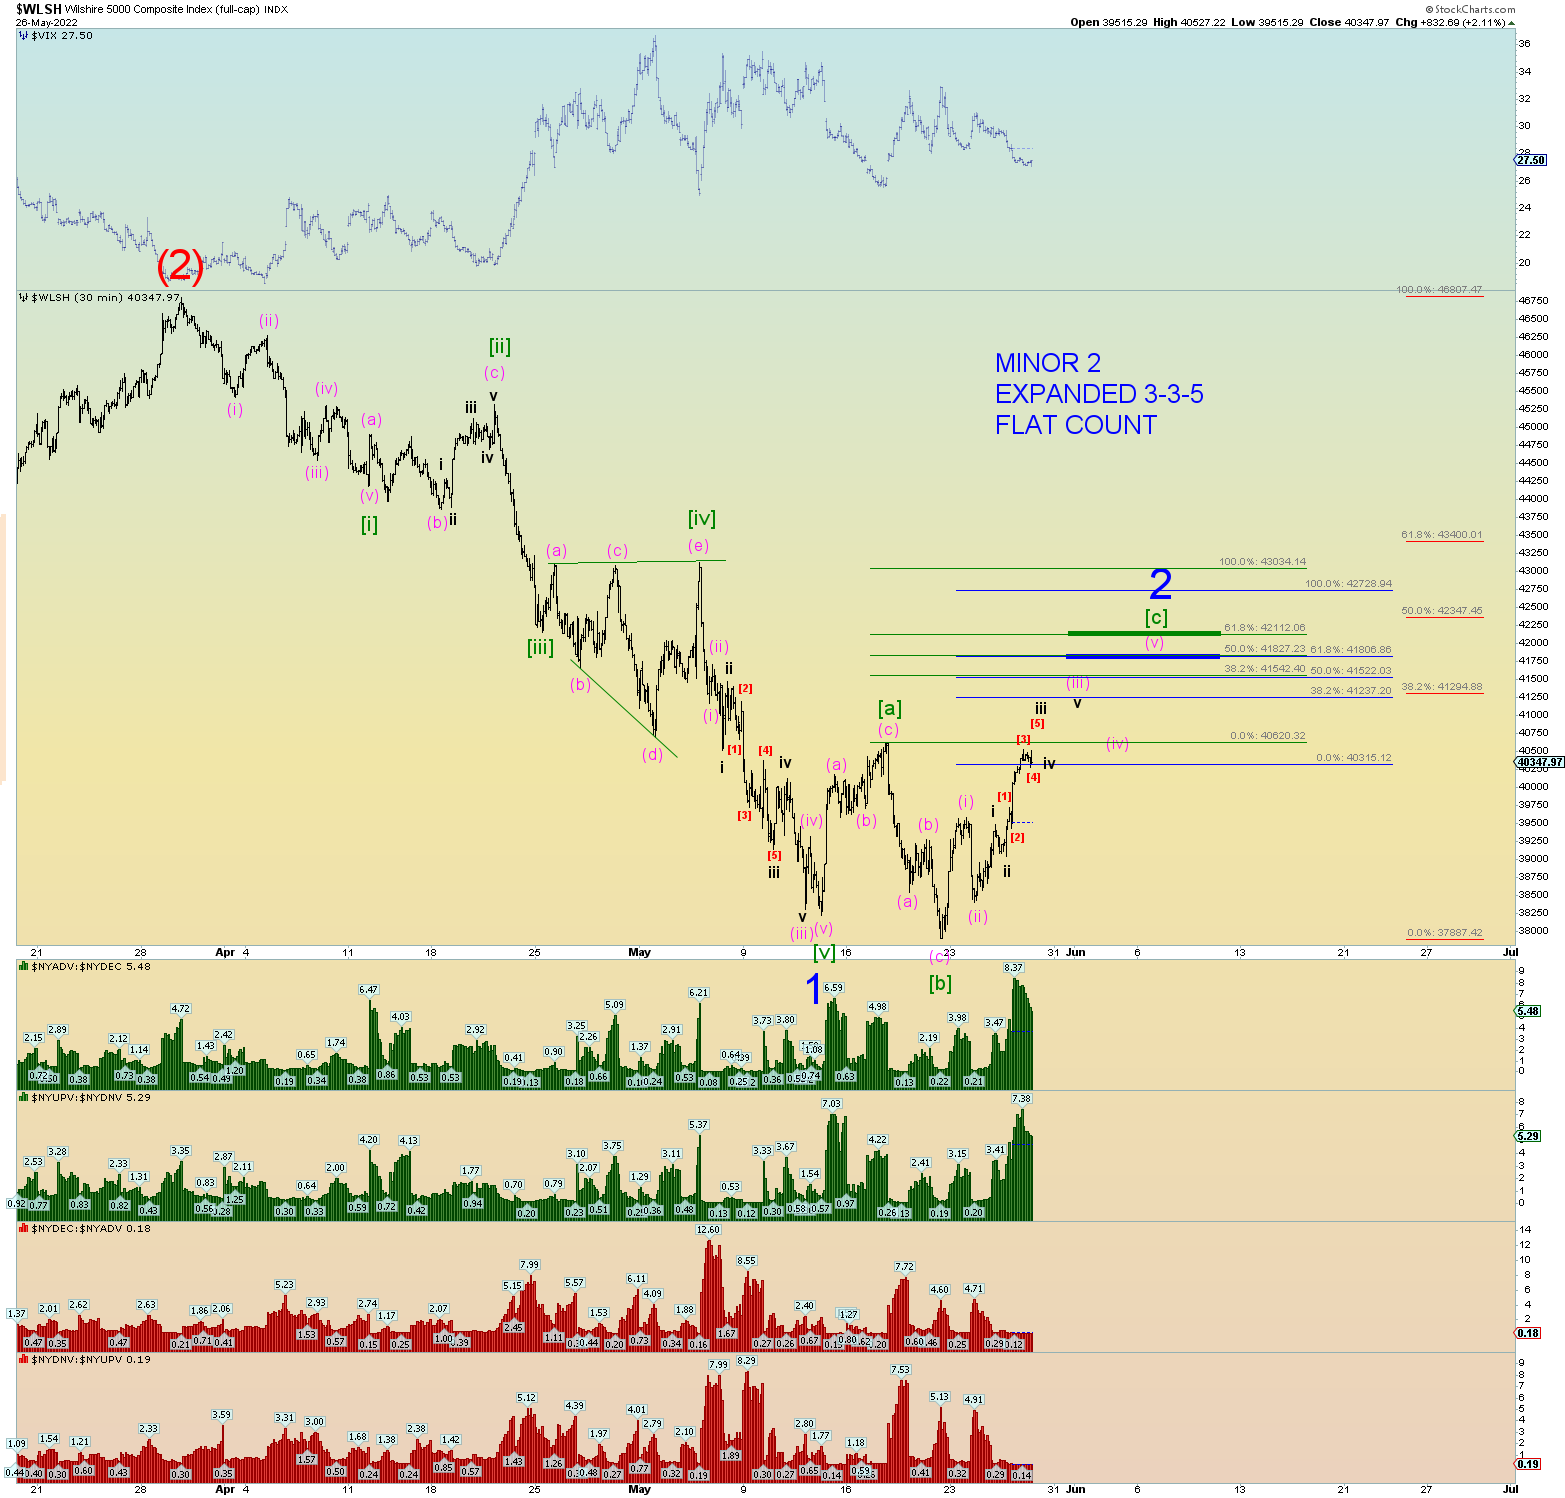
Lots of charts tonight. The primary wave count is Minor 2 of Intermediate (3). Minor 2 is taking the form of an aggressive expanded 3-3-5 wave count. This is where wave [a] and wave [b] consist of three waves and wave [c] is in the form of an impulse five wave move. So far that is panning out just as expected.
The overall situation is shown here on the Wilshire 5000 chart with 3 target ranges with explanatory notes for each:
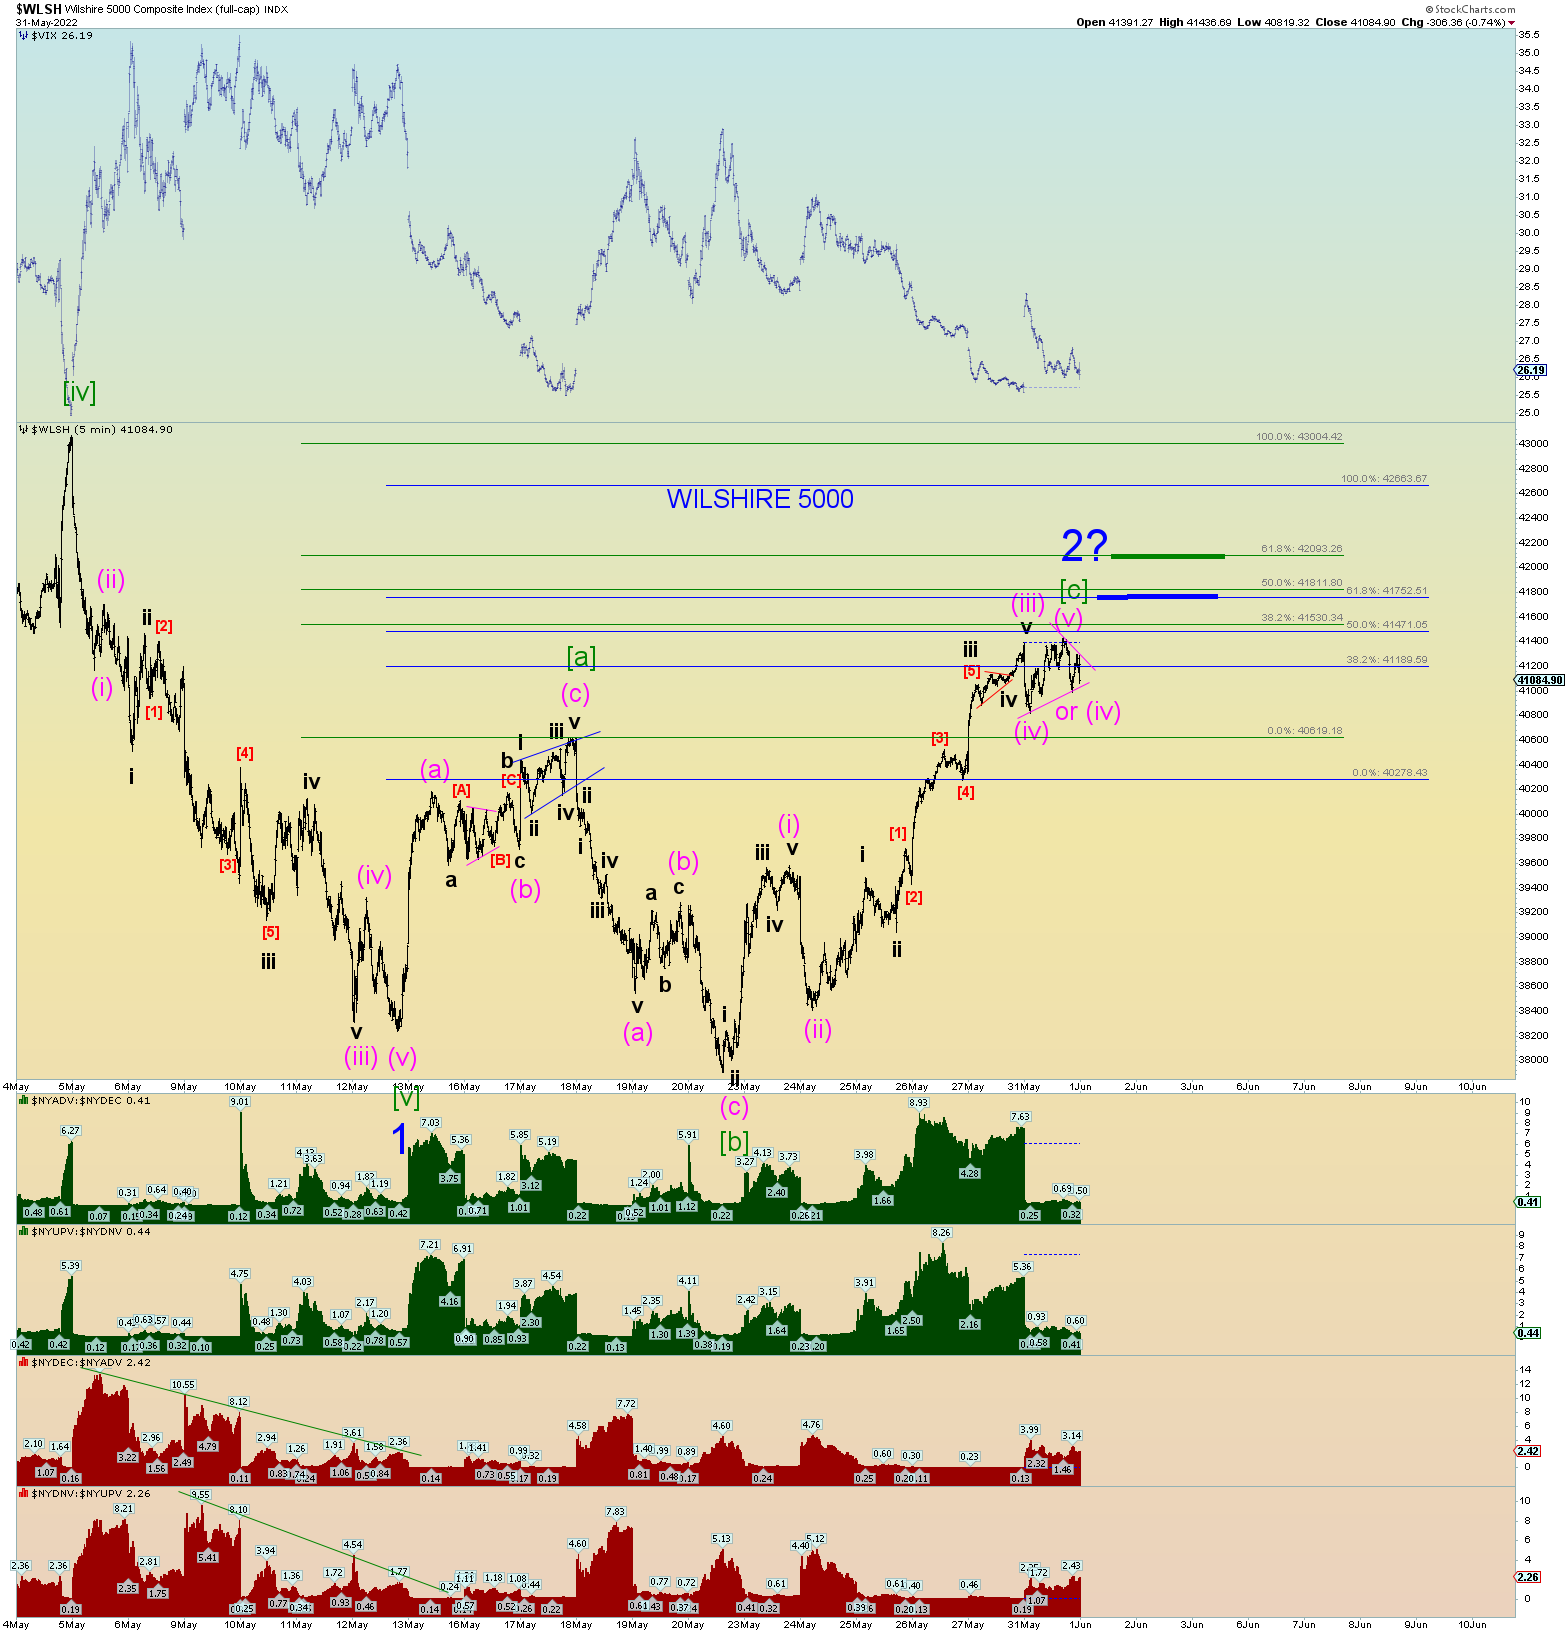
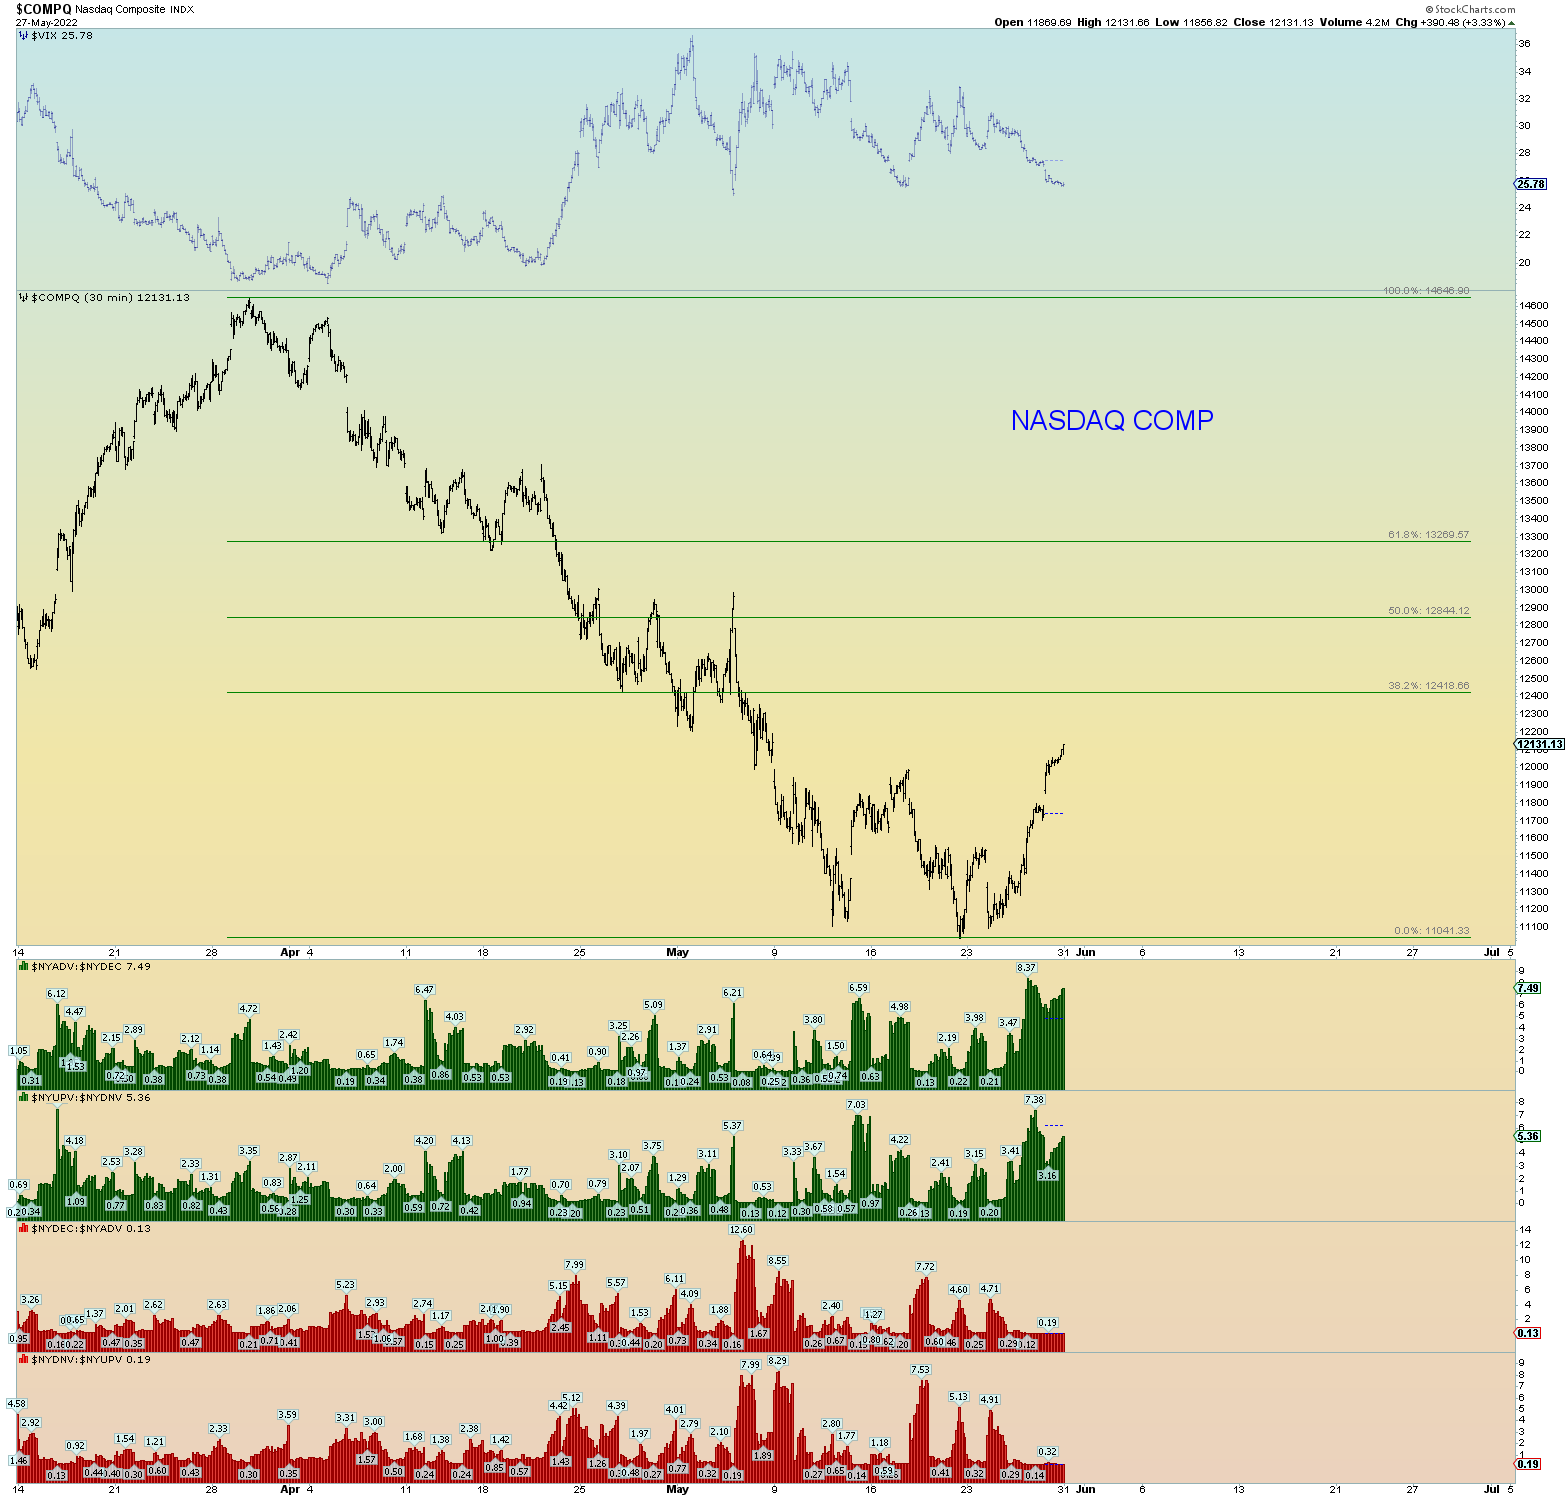
Swiggle counts. Overnight Monday futures going into Tuesday’s trading will help determine whether or not wave (iii) has been reached or not.
Again, a backtest seems correct.
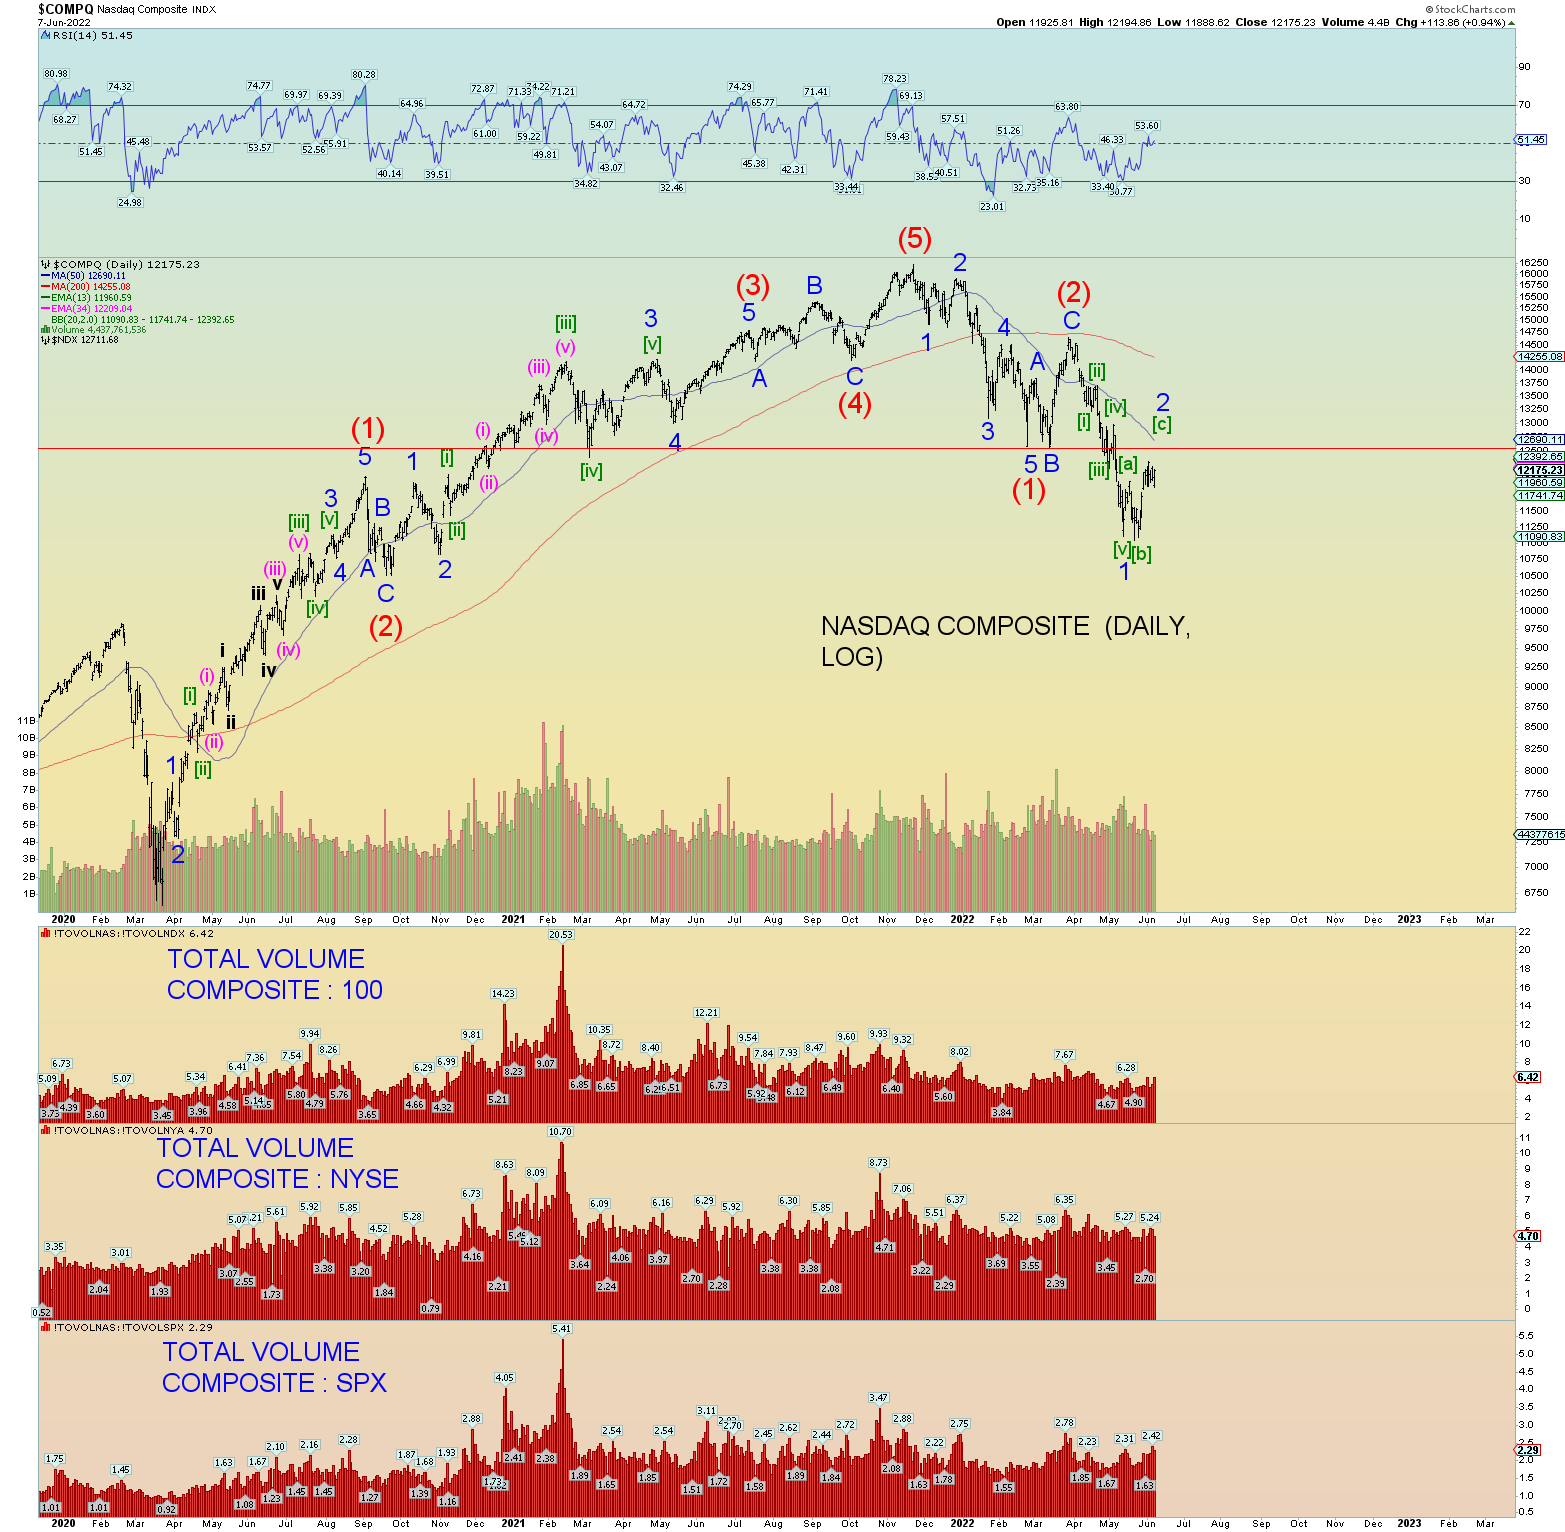
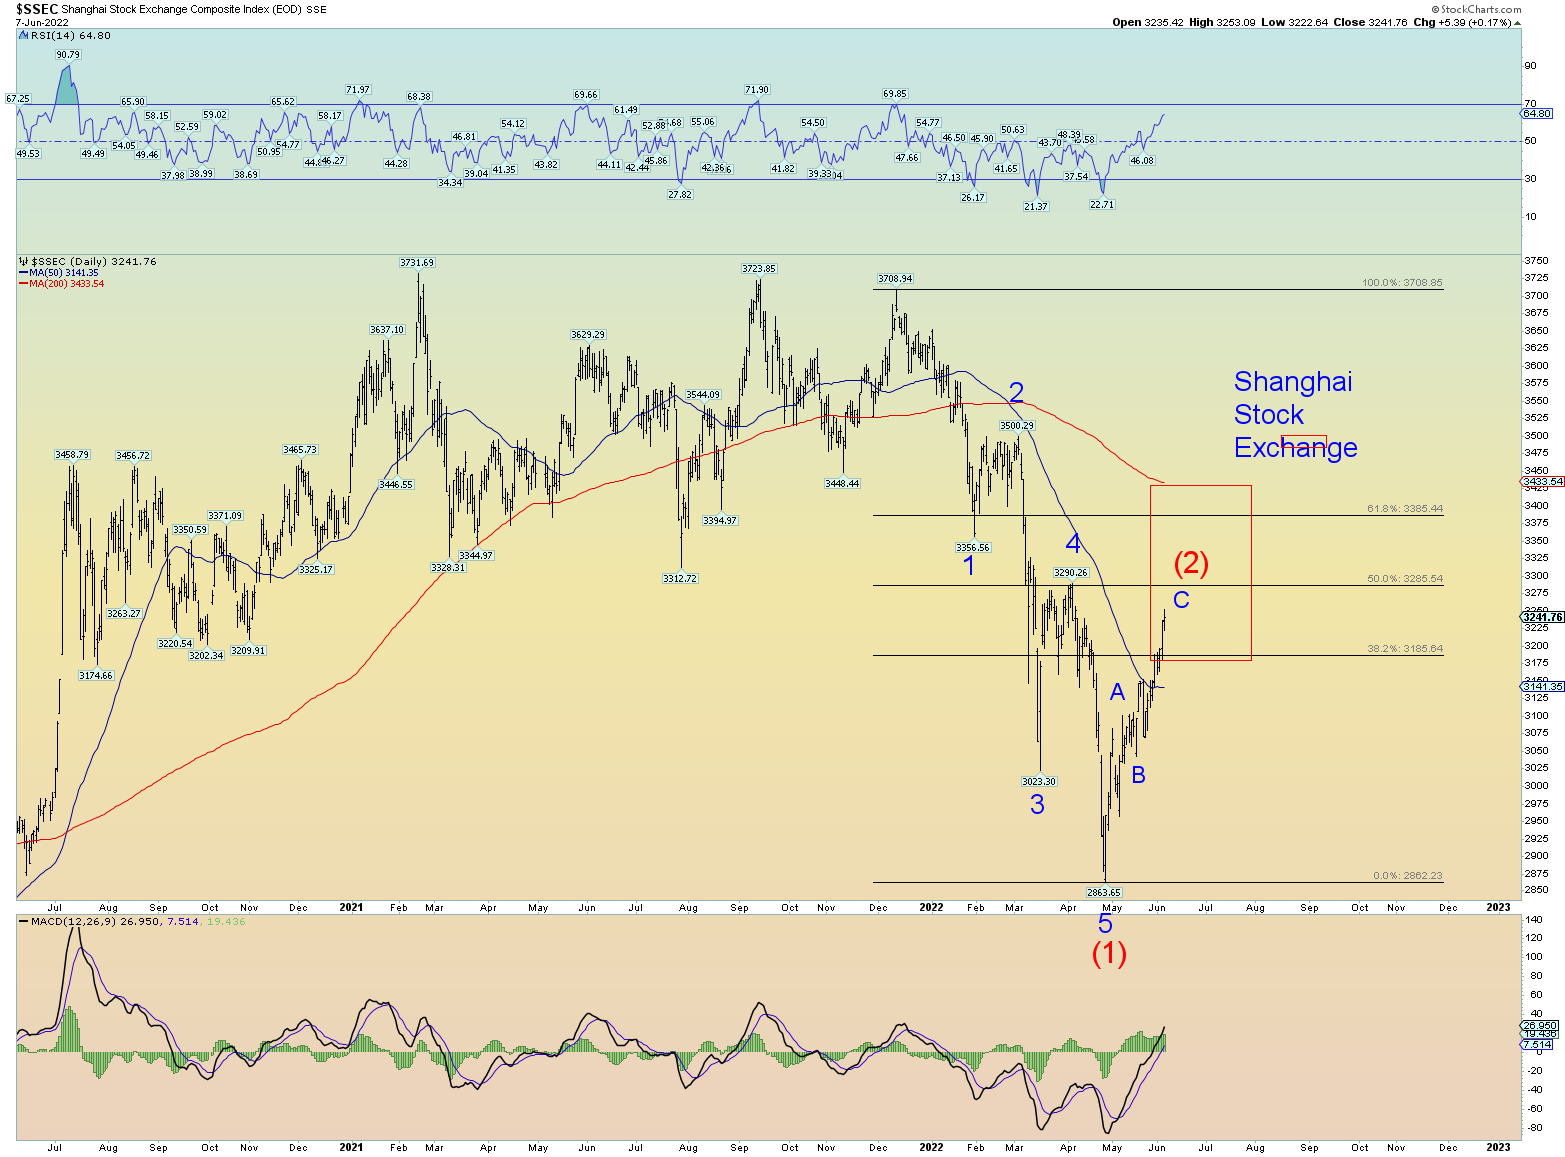
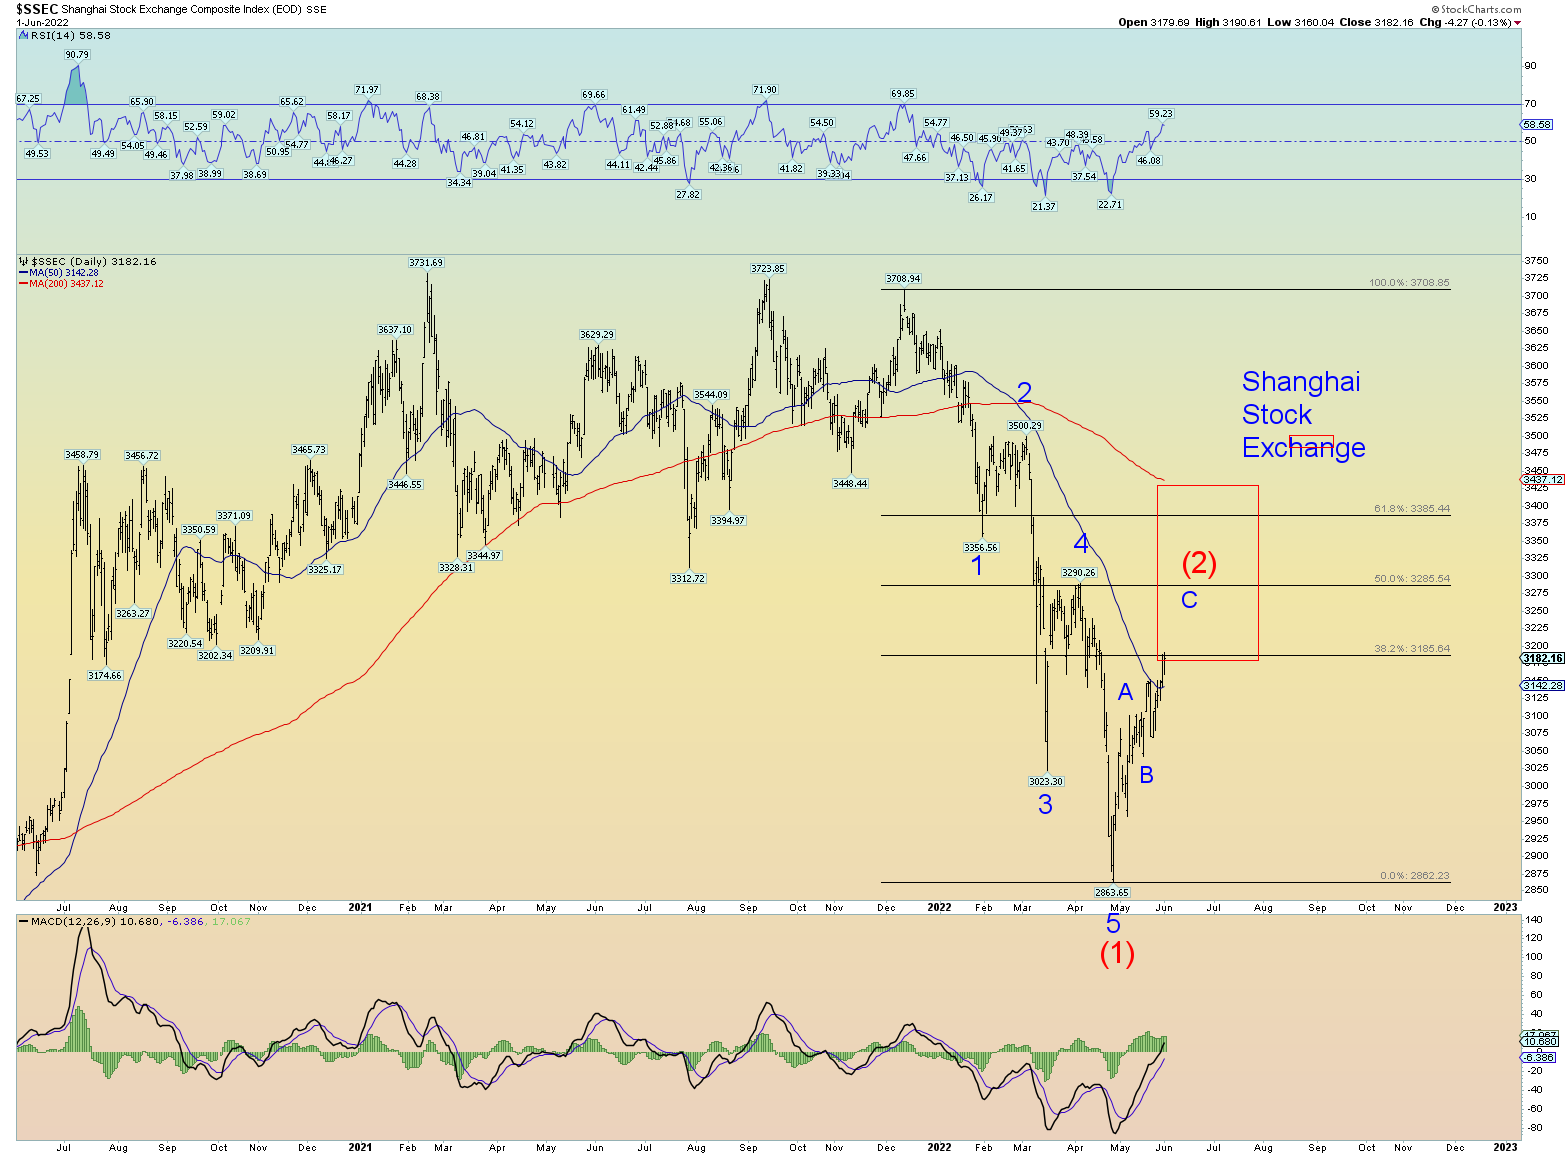
The Composite is still down 25% from peak and not yet even a Fibonacci 38.2% retrace from its wave (2) peak. So, despite the newfound bullishness, you can see just how far the market has fallen already and if people have visions of grandeur on a new bull market, well, it has a lot of work ahead of it.
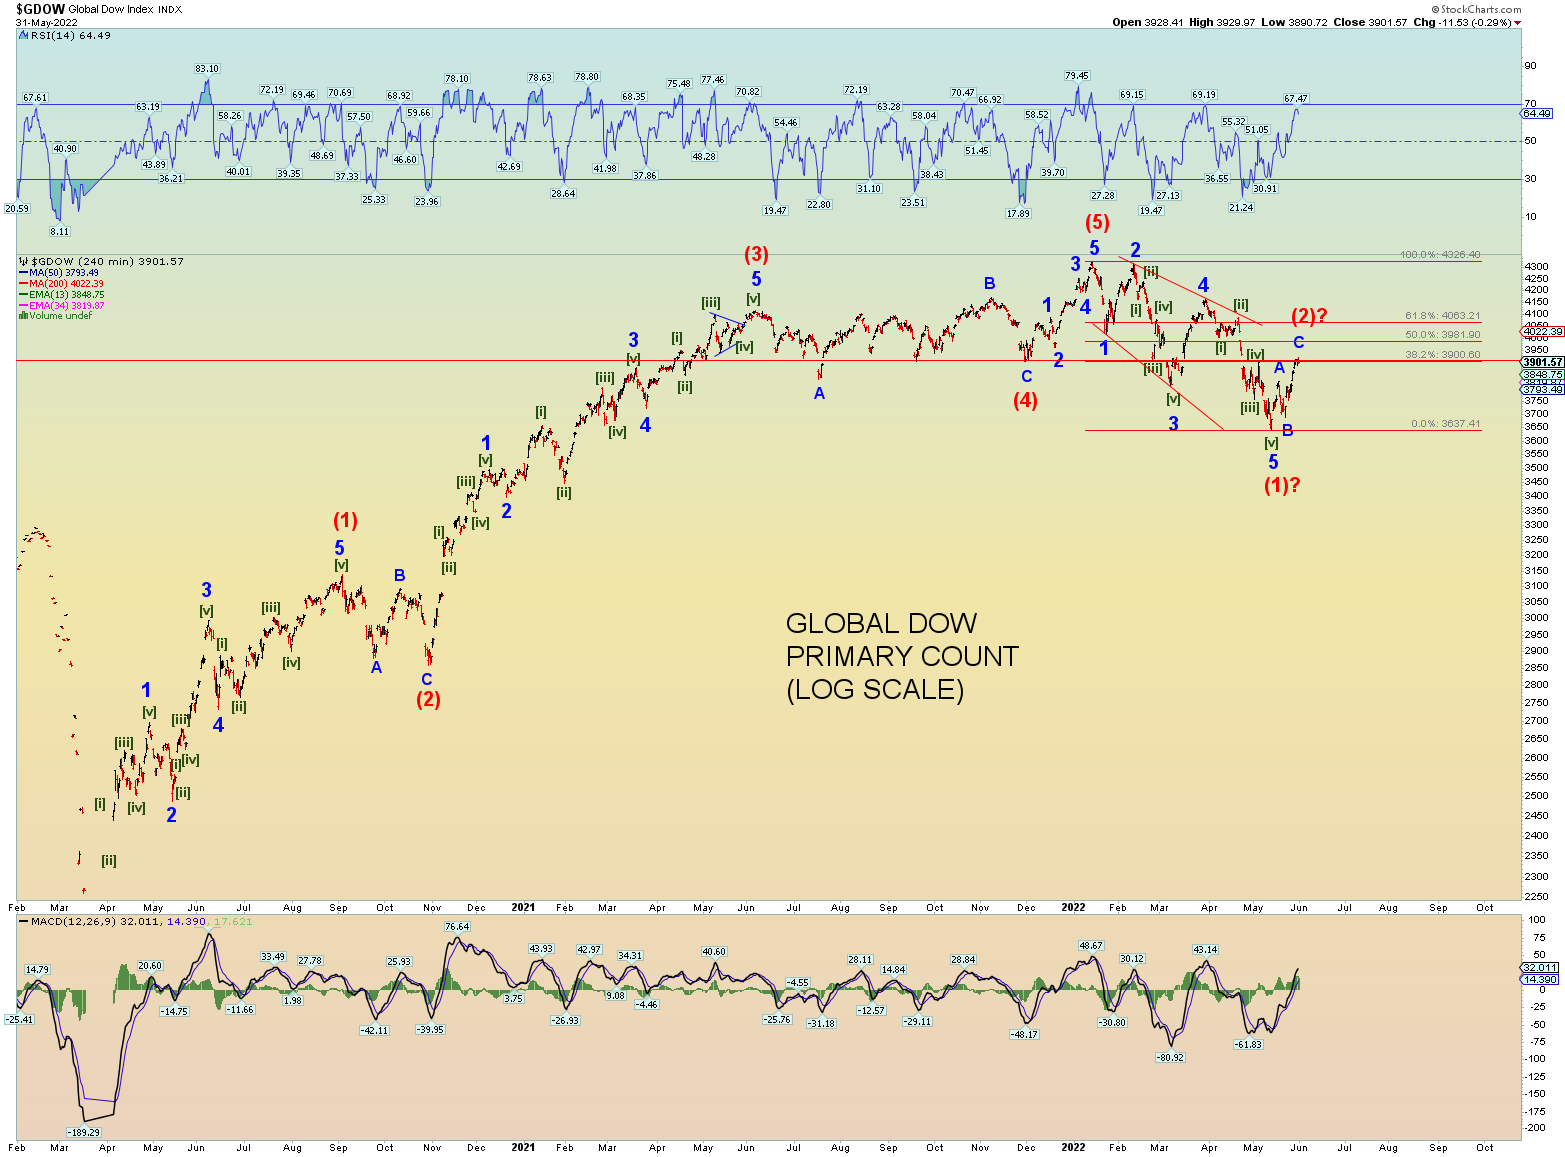
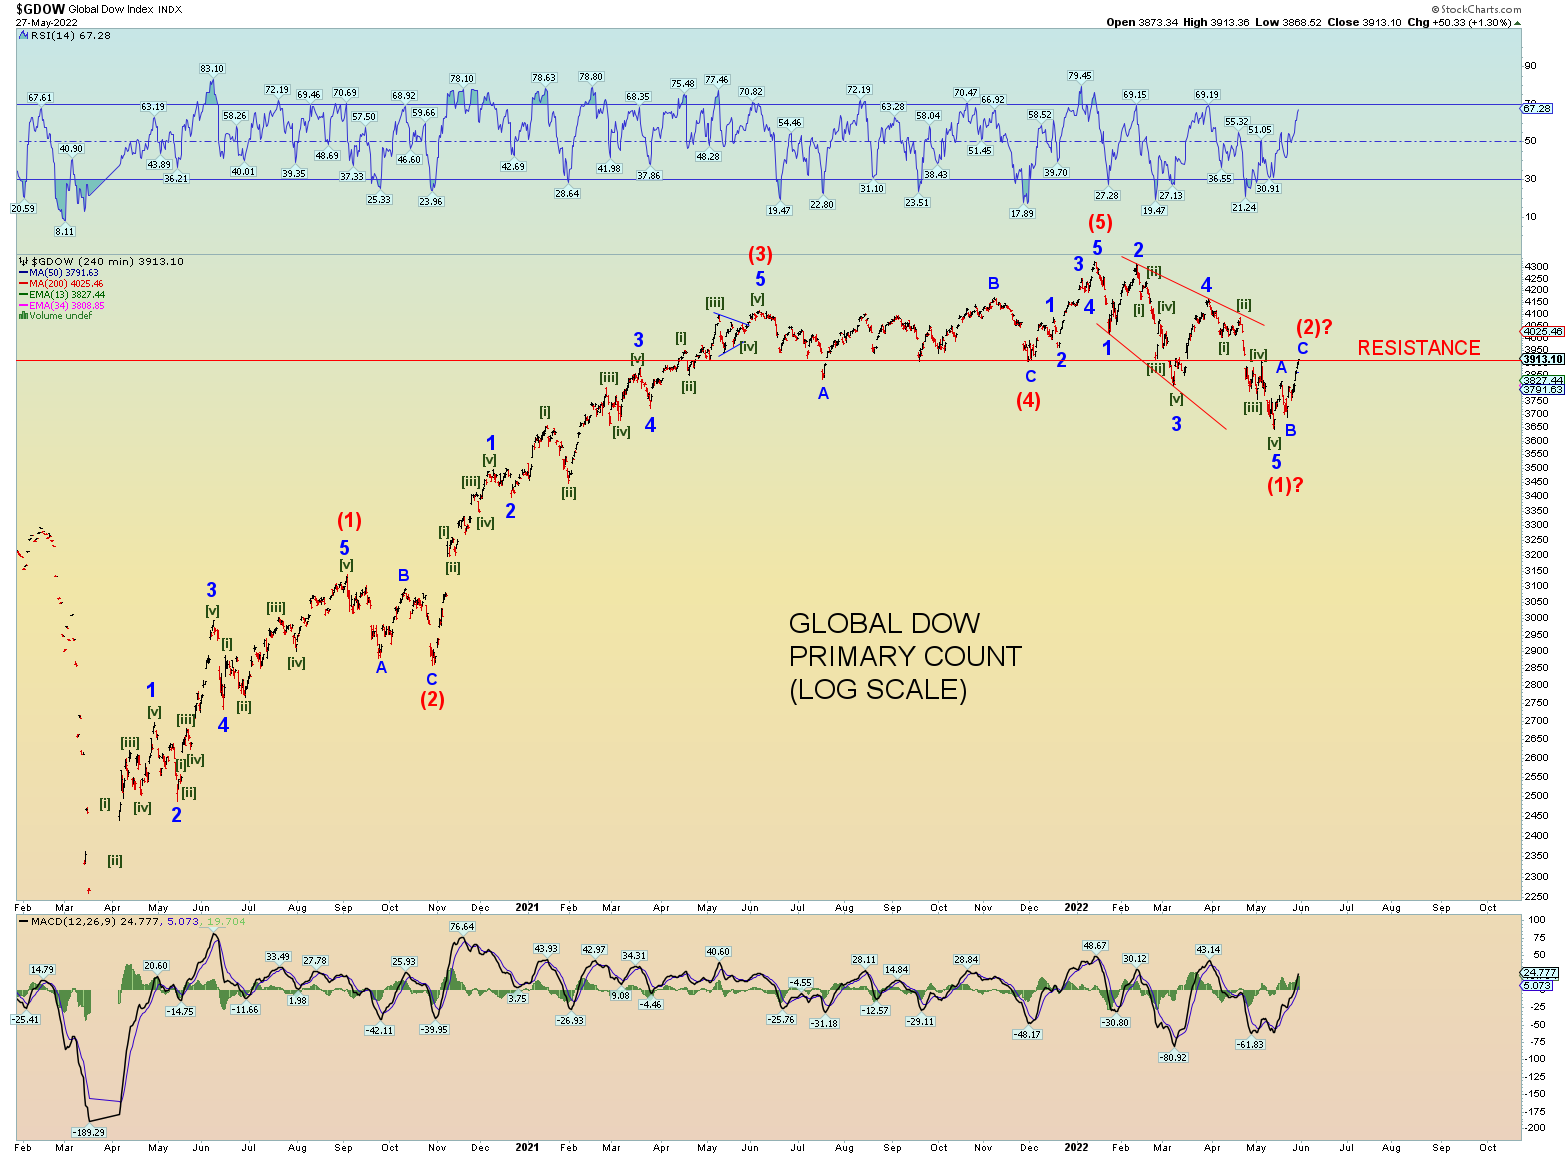
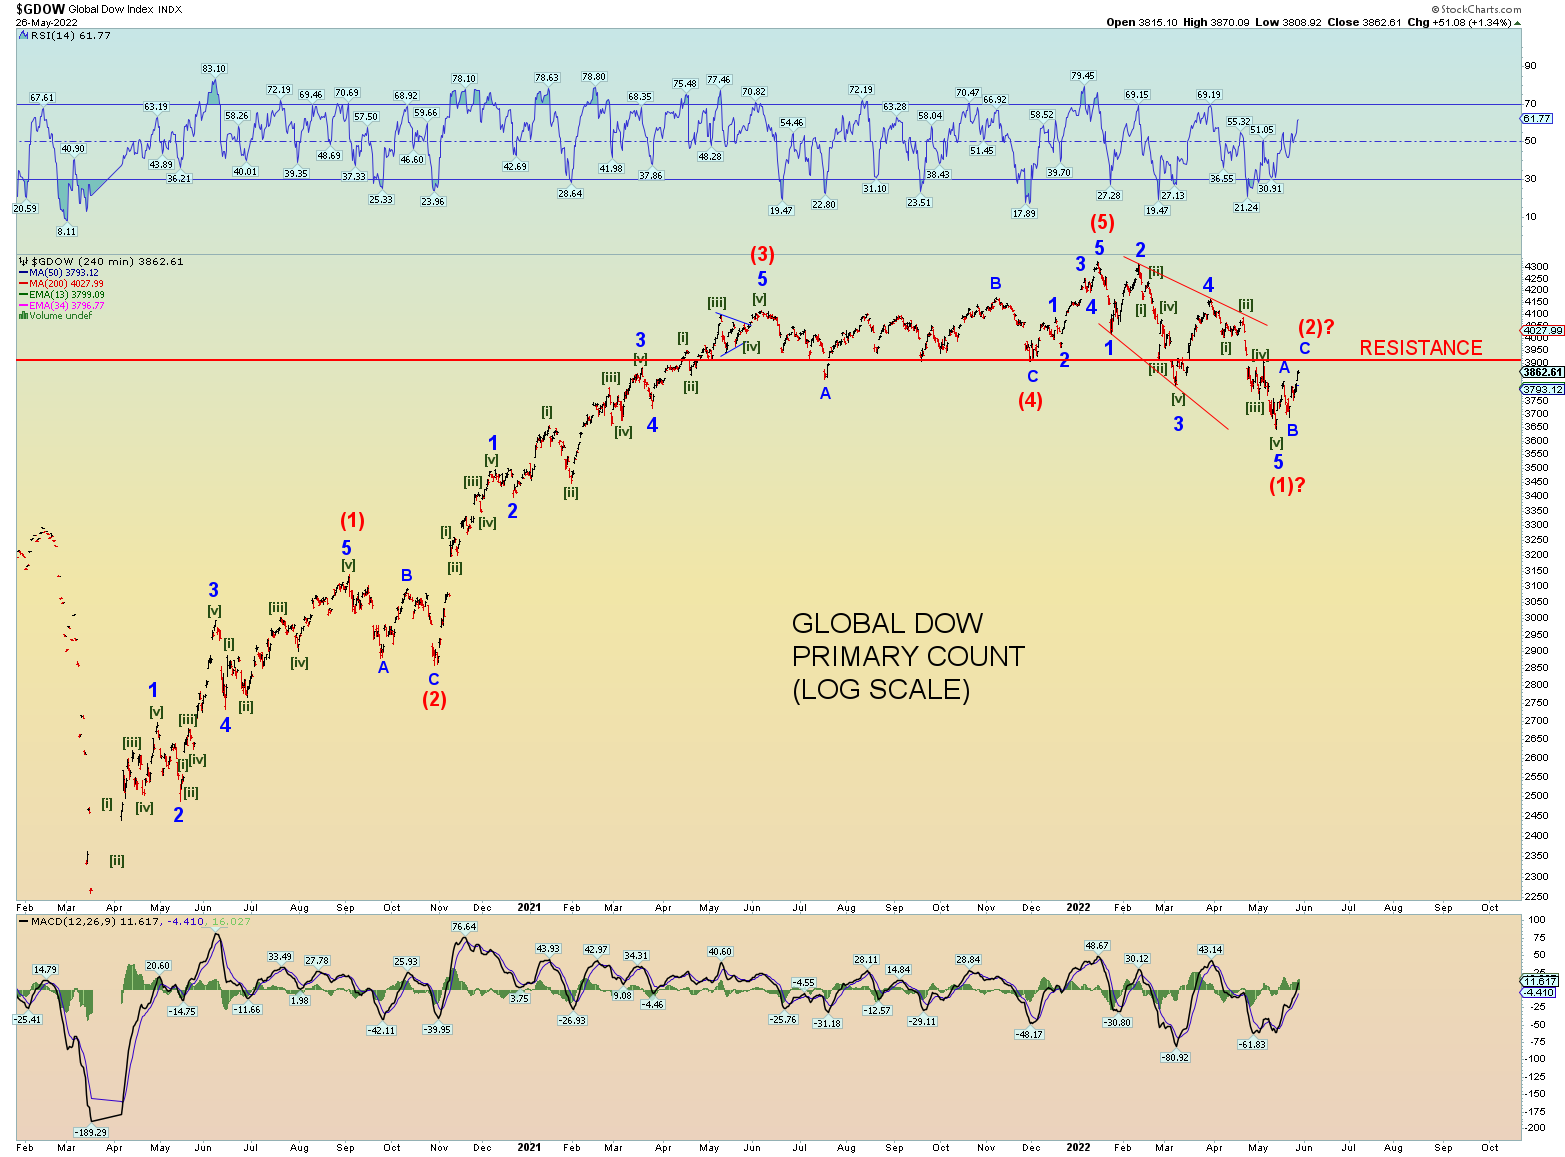
GDOW has met the resistance line.
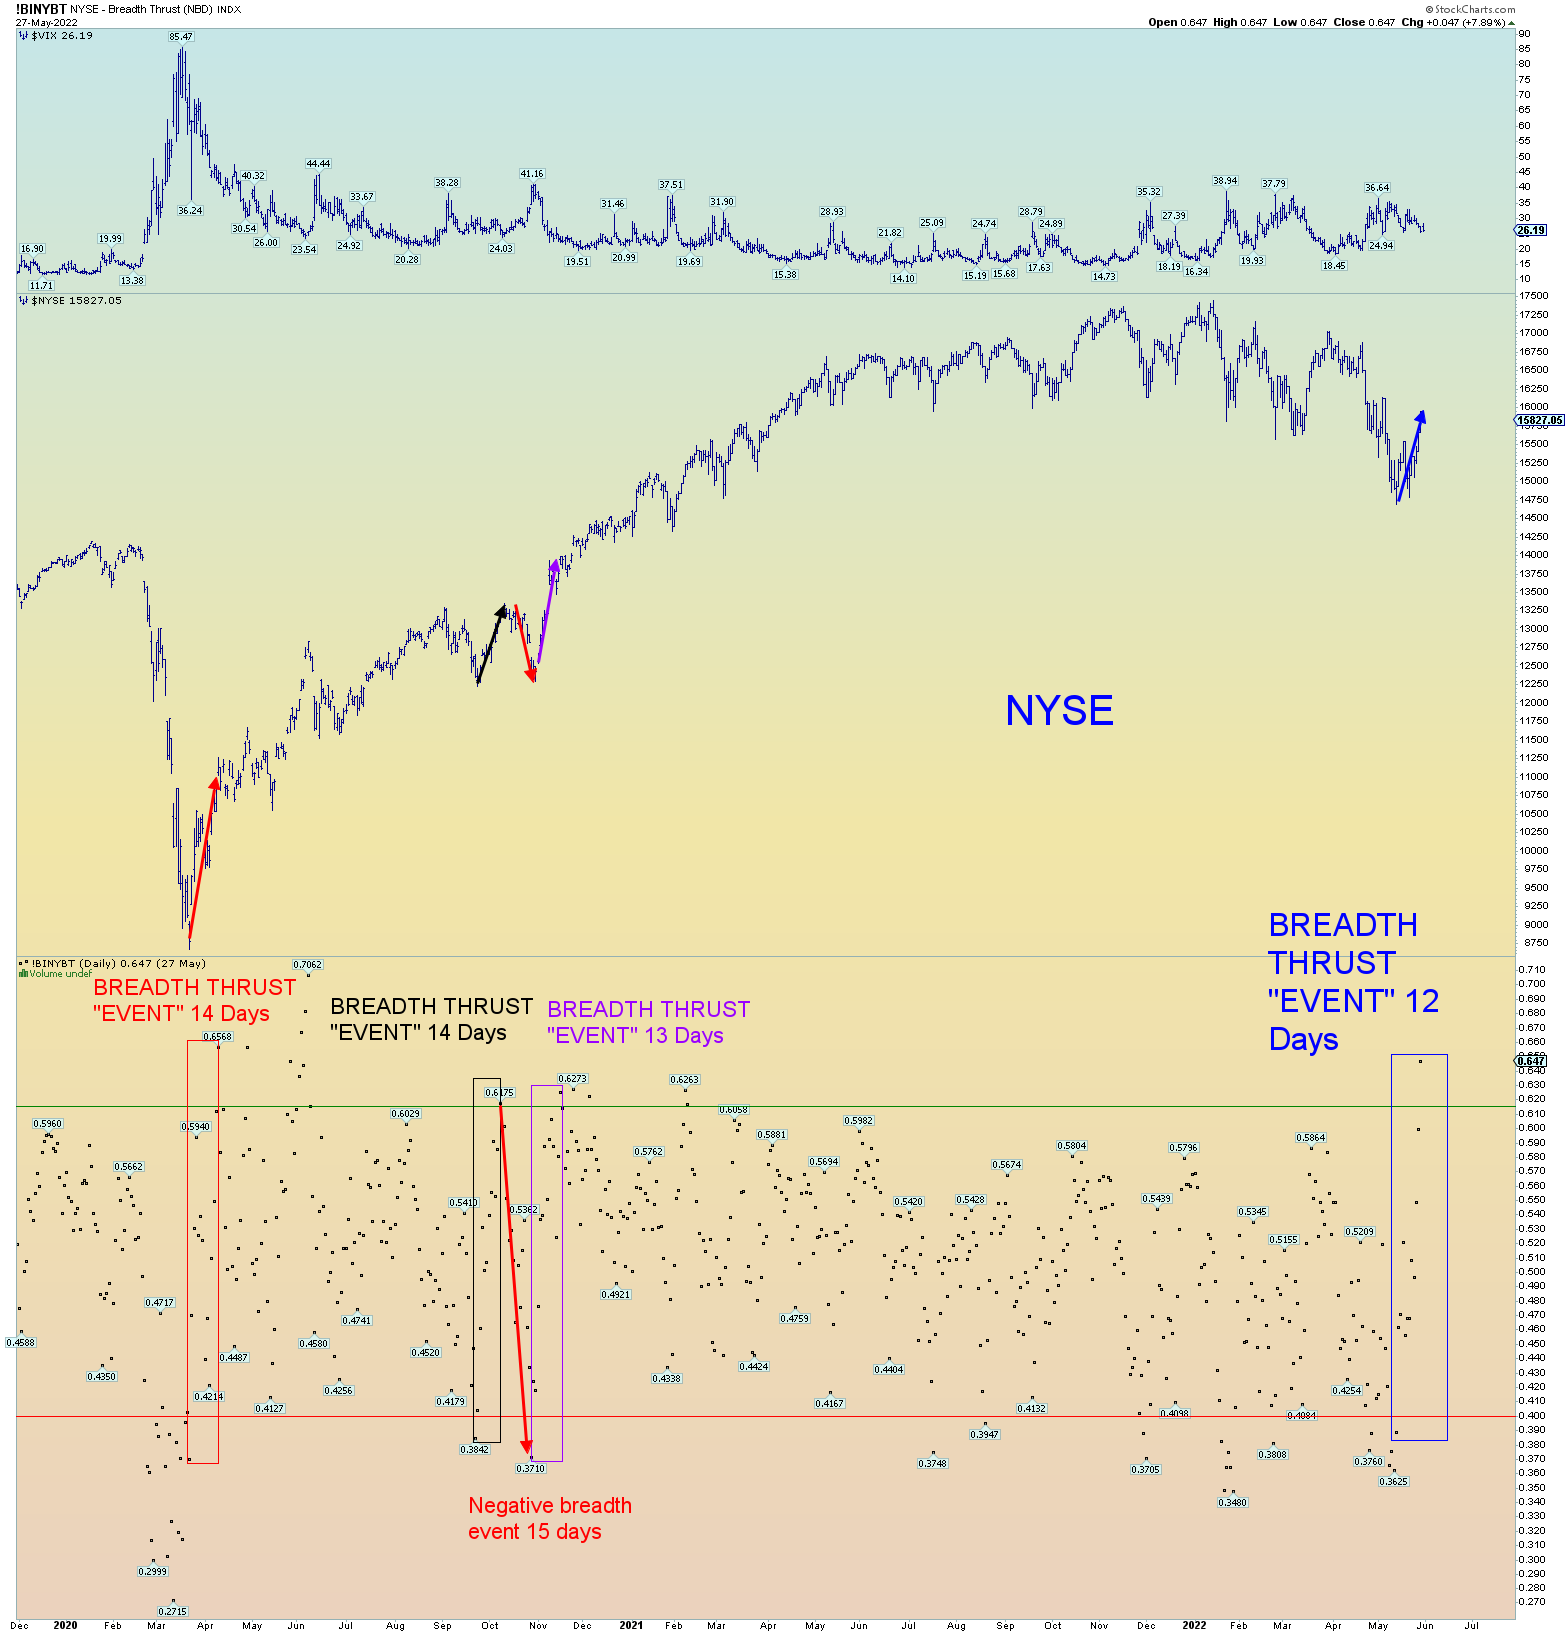
I won’t have the NYSE “breadth thrust” data tonight. But I am guessing a significant “breadth thrust” event has occurred. A close of the indicator above the .61 mark would be quite an event. 11 days from sub .40 to above .61 mark is just 1 day short of a “Zweig Breadth Thrust” event. But as I said, I won’t have that data just yet.
Is this a concern for bears? Sure it is. the remedy for a positive event is to follow it up with a negative event. A “thrusting down” event. The wave structure suggest this will happen. Basically, the “big big” money will ponder this weekend at the prospect of getting out of the market at good prices. “Selling the rip”. This week caught a lot of people off guard (not this blog) and they have 3 days to decide if they will take advantage of it.
Market internals are somewhat a result of how “mechanical” the market has become. Computers determining outcome.
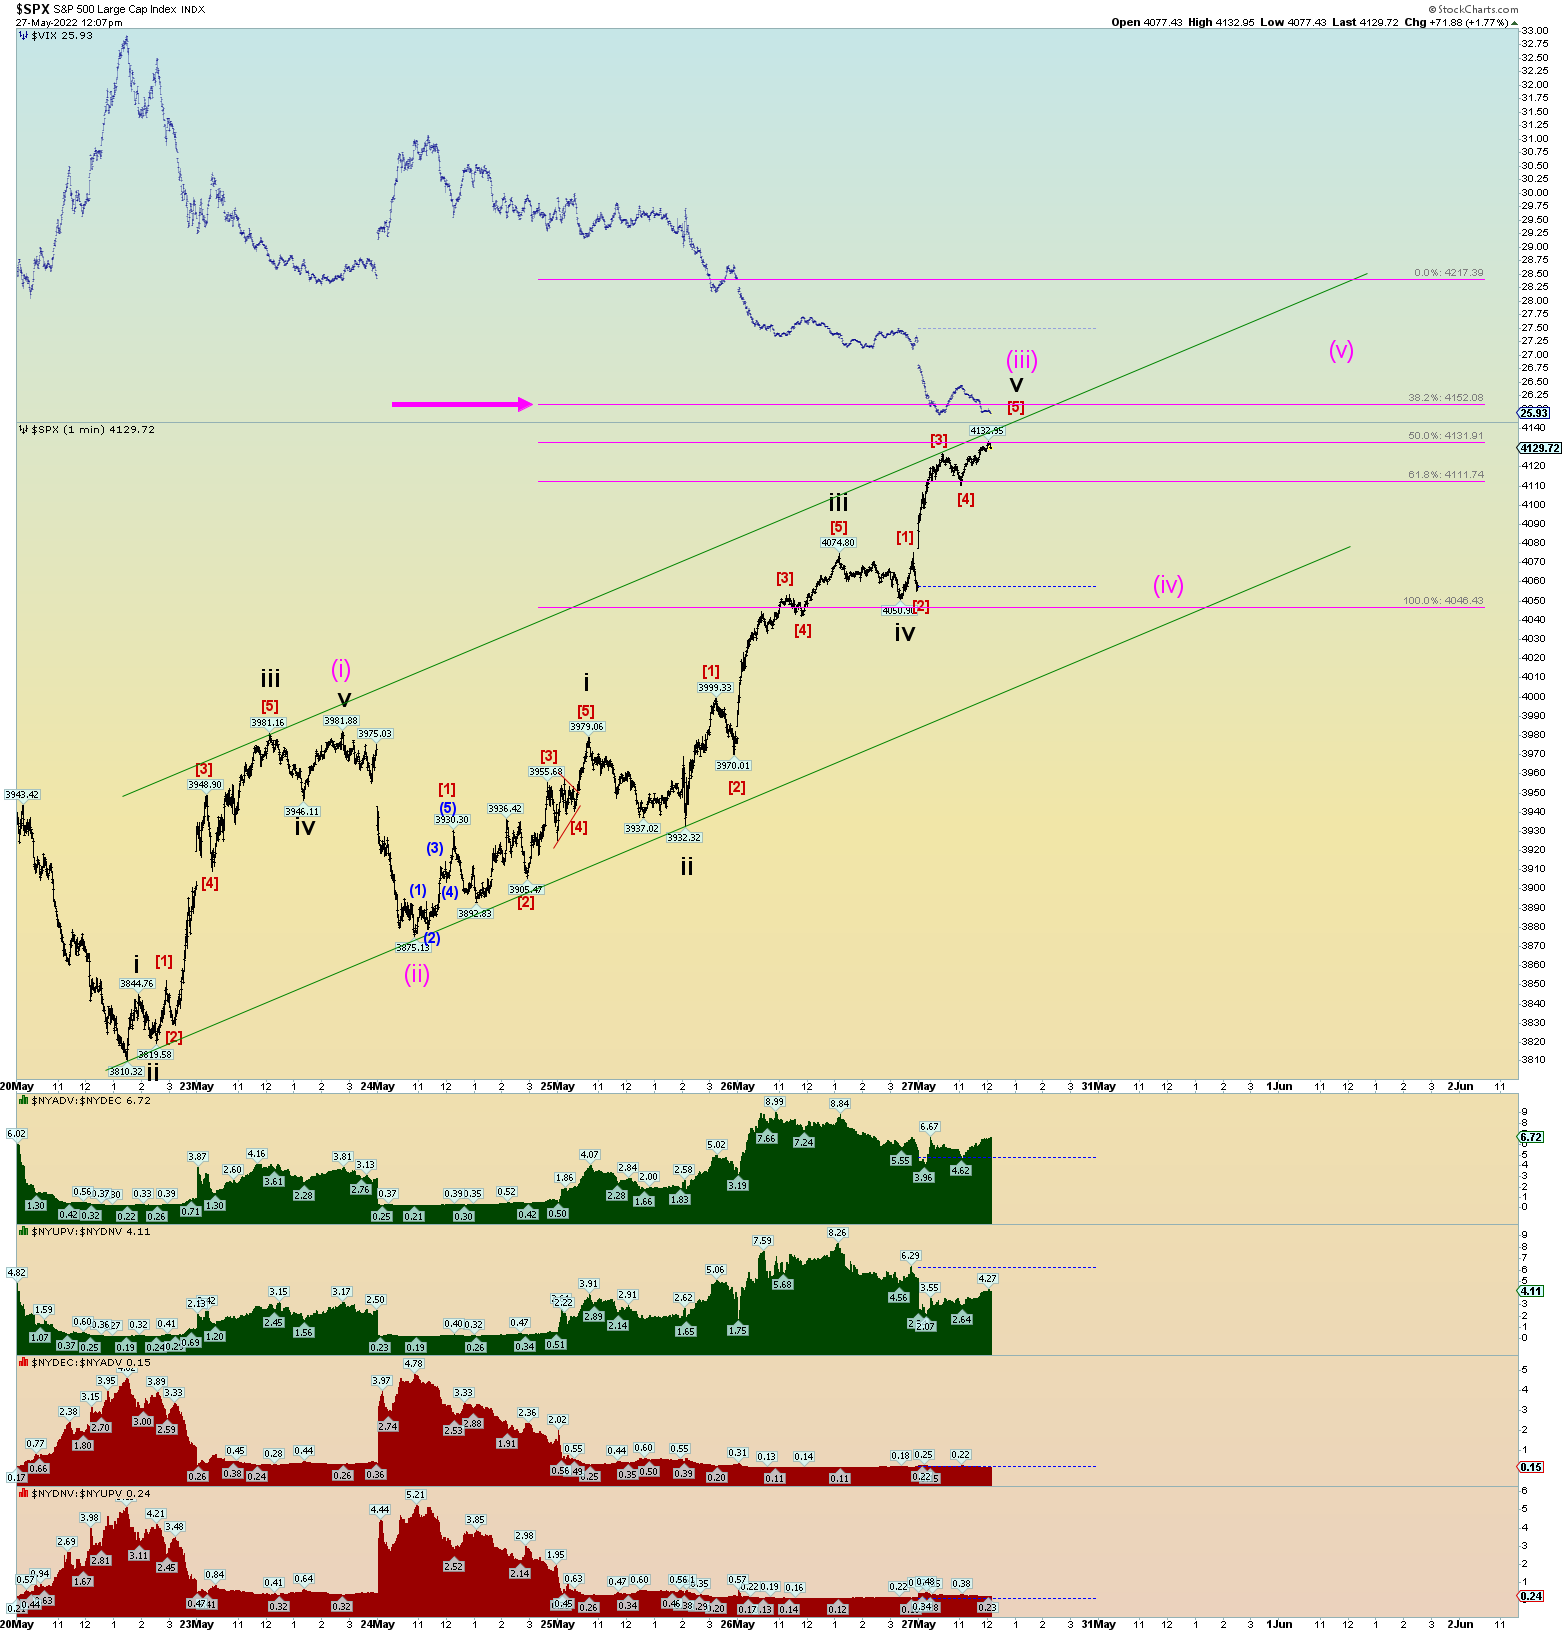
[UPDATE 15:08 EST] Looks like the market is determined to inflict as much pain on bears as possible. Squiggle count updated. The 1.618 Fib target resides at 4152 on the SPX.
[UPDATE 12:30 EST] IF this is nearing the top of (iii), then expect some afternoon weakness. An ideal retrace for (iv) is the gap area from this morning.
[UPDATE 12:11 EST] The Wilshire 5000 has reached a perfect wave (iii) = 1.618 times the length of wave (i). We may have reached the top of wave (iii).
[UPDATE 12:05 EST] I added a Fibonacci grid to show where wave (iii) is 1.618 times the length of wave (i) and that is at about 4152 SPX.
[UPDATE 12:02 EST]
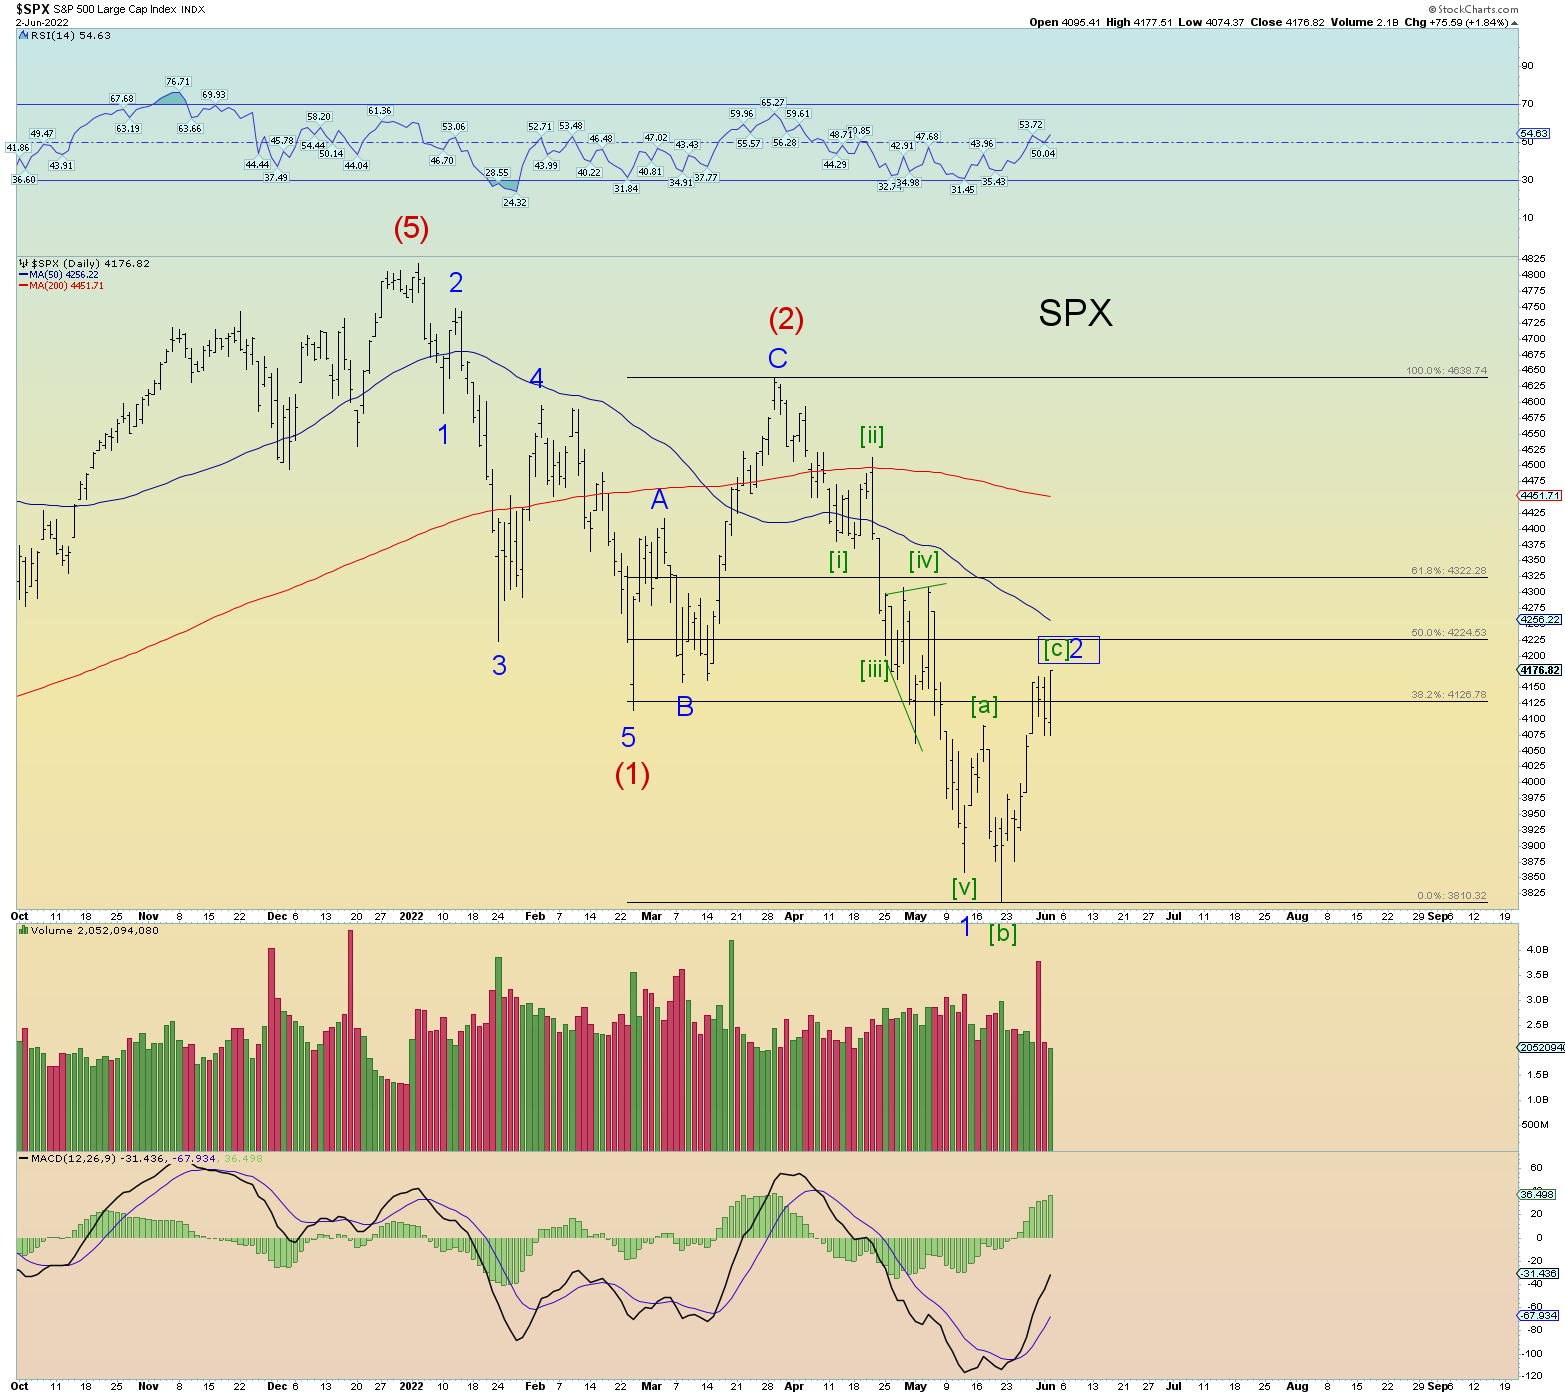
Total retrace and target area of Minor 2 in the SPX. Basically a challenge to its 50 DMA
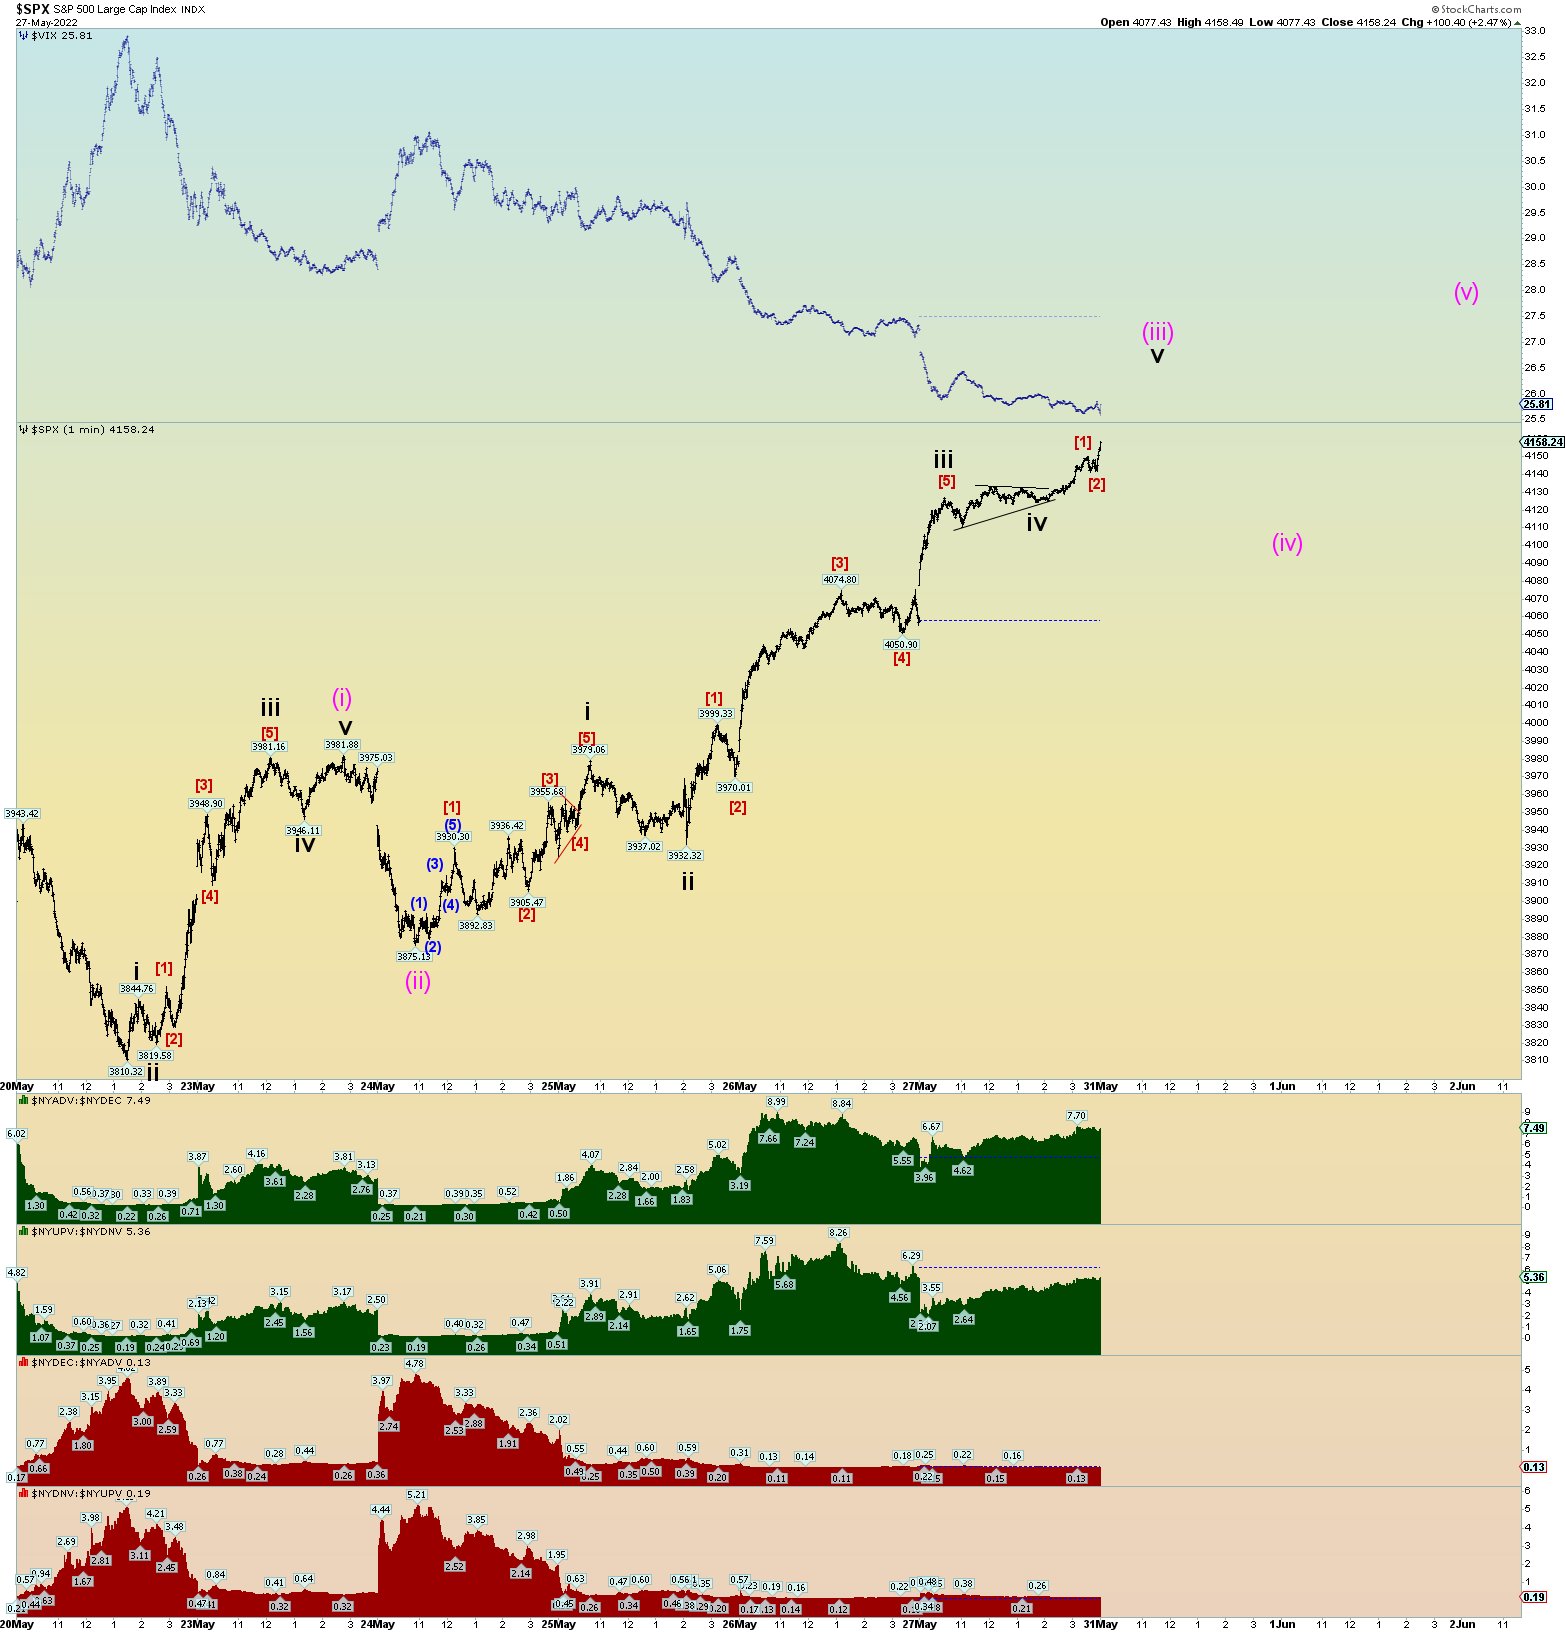
[UPDATE 11:55 EST] When is it appropriate to make a 1-minute squiggle SPX chart? When it has moved 300+ handles in the span of 5 days…
[UPDATE 11:38 EST] Updated SPX chart. The best count has us looking for the top of Minuette (iii).
I made a nice SPX 5-minute chart to track wave ratio relationship targets of the proposed Minor wave 2 expanded flat count. Best guess squiggle count below. We can adjust as more waves unfolds. Keep an eye on the wave relationship target for wave (iii) of [c] of 2.
Today was the strongest market internal up day in the last 10 days. Without yet seeing today’s NYSE “breadth thrust” data, the market had a very good follow through today. I’ll have the official data later tonight.
The preferred count remains intact: Minor 2 of Intermediate wave (3).
Here is an S&P 500 chart matching the same count as the Wilshire 5000 with the Minor 2 wave target range shown. The range is 4185 – 4233 SPX> The lower end of the range is some 2.7% + higher still.
The GDOW is forming a nice A-B-C rally. Note the heavy horizontal resistance. This, in theory, should be difficult to overcome. And thus, the count in that it will not be overcome.
Big “risk – on” again. Junk is soaring. But it was due for a violent bounce.
And finally, amazingly considering the market may have just experienced a significant “breadth thrust” event, the most bearish count is technically still not violated. It just goes to show you how deep the selloff has actually been so far overall.