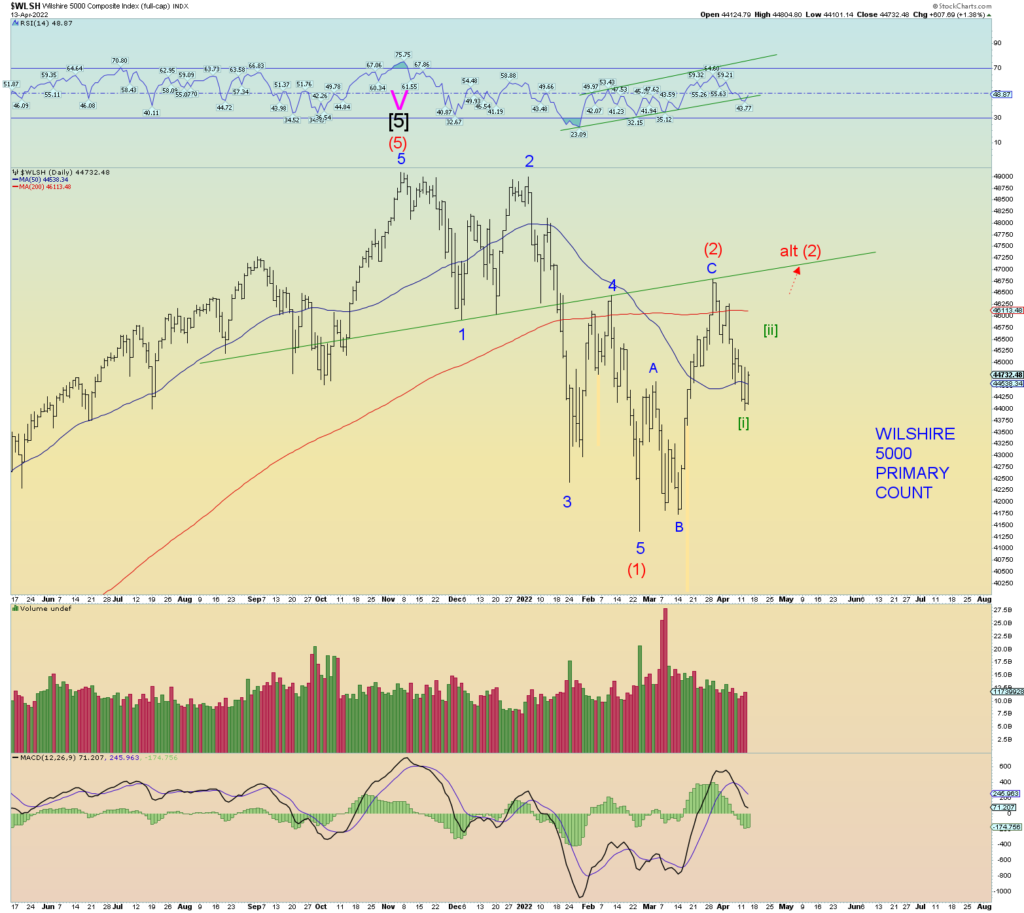
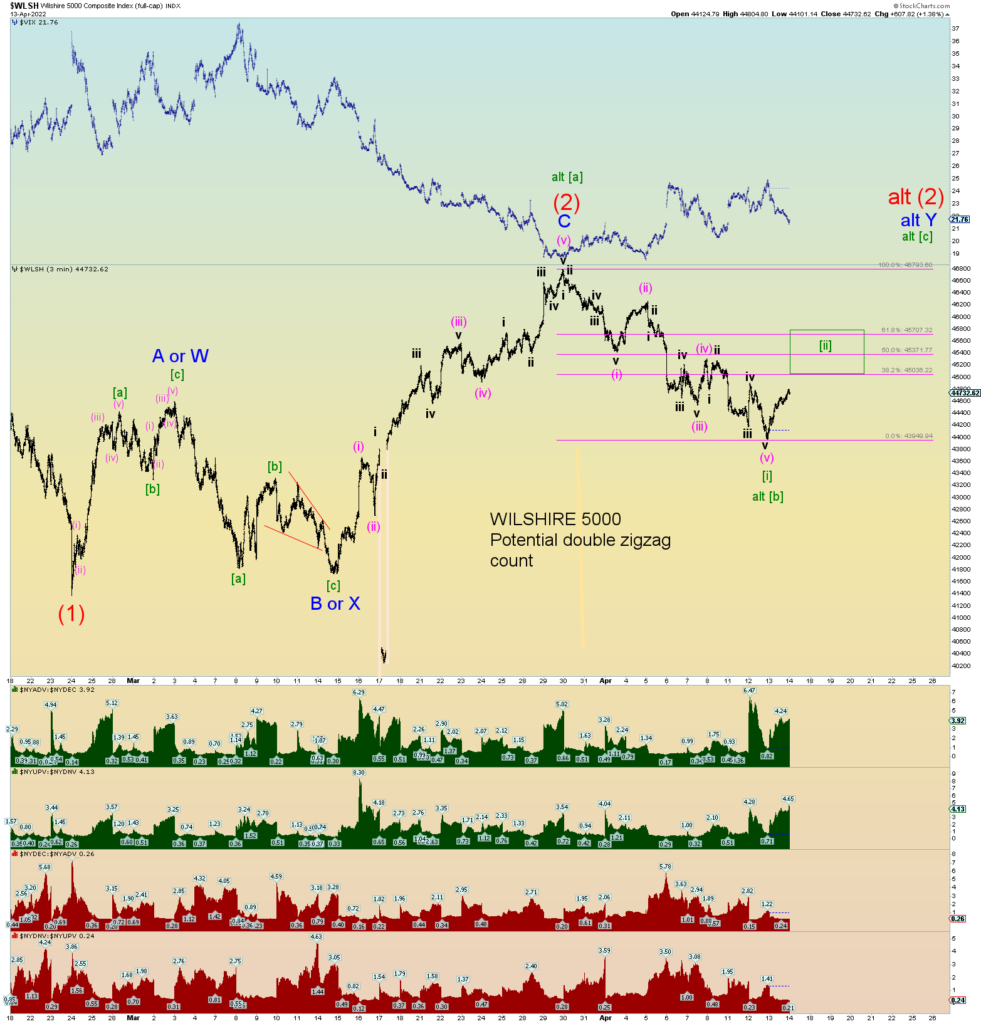
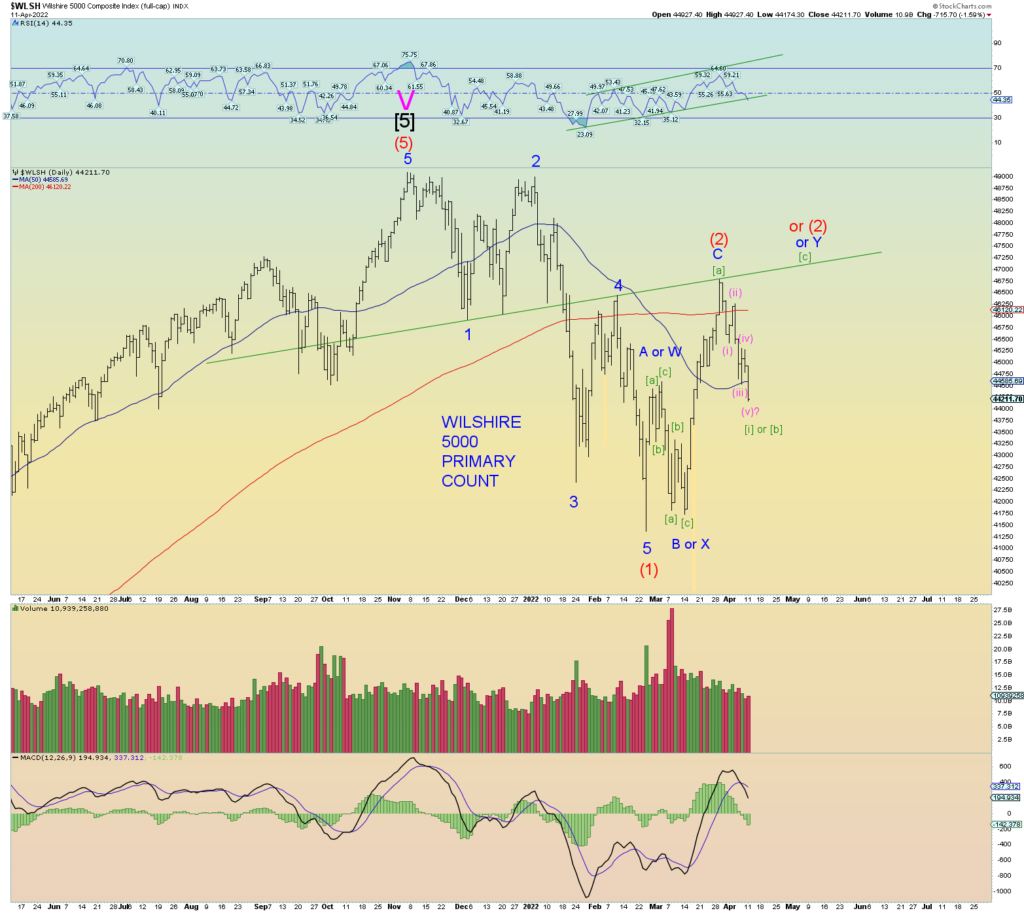
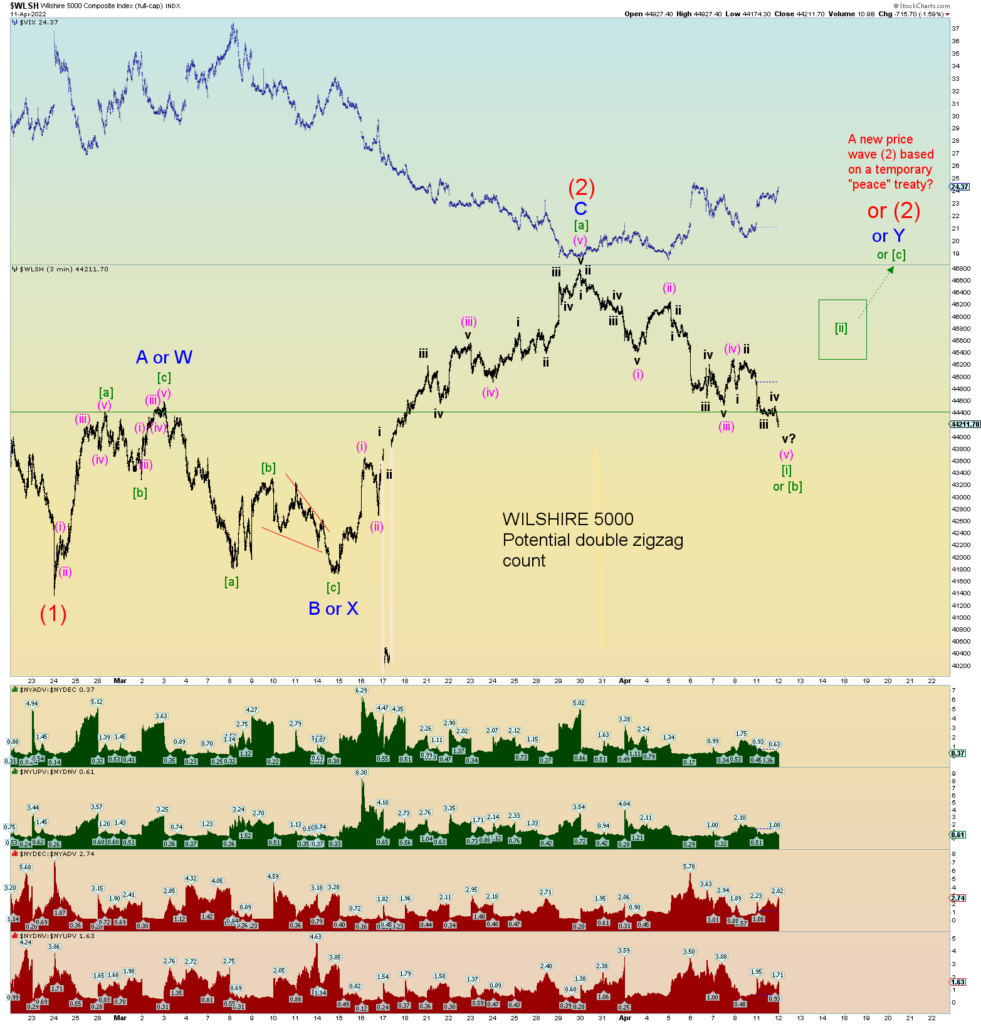
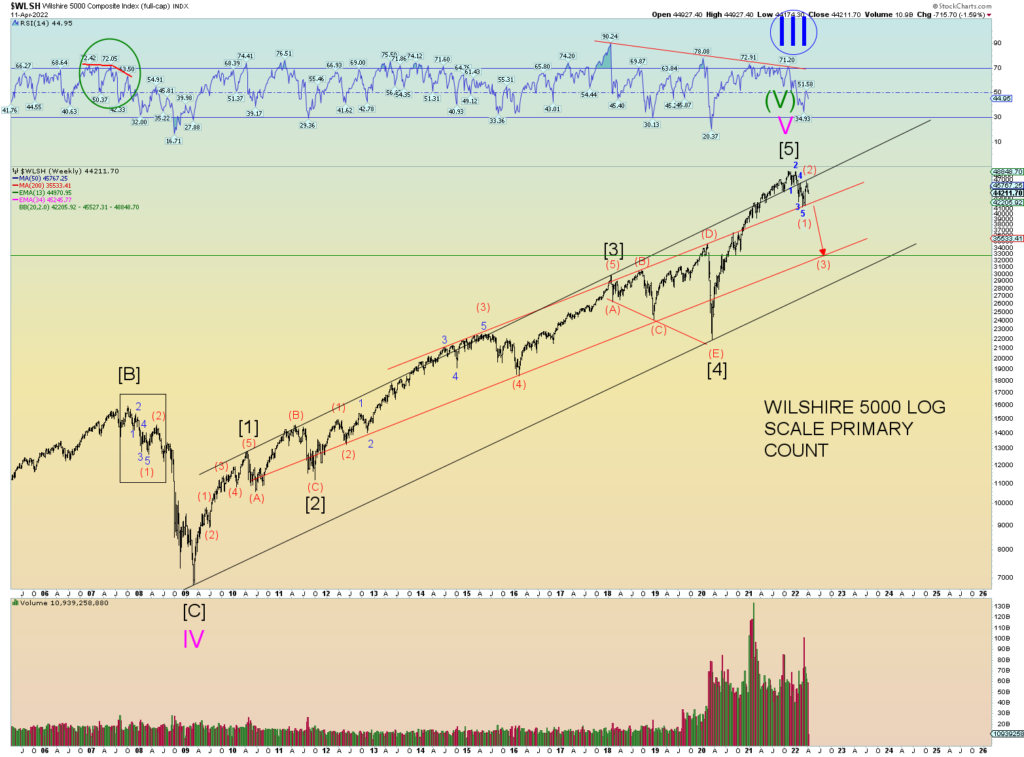
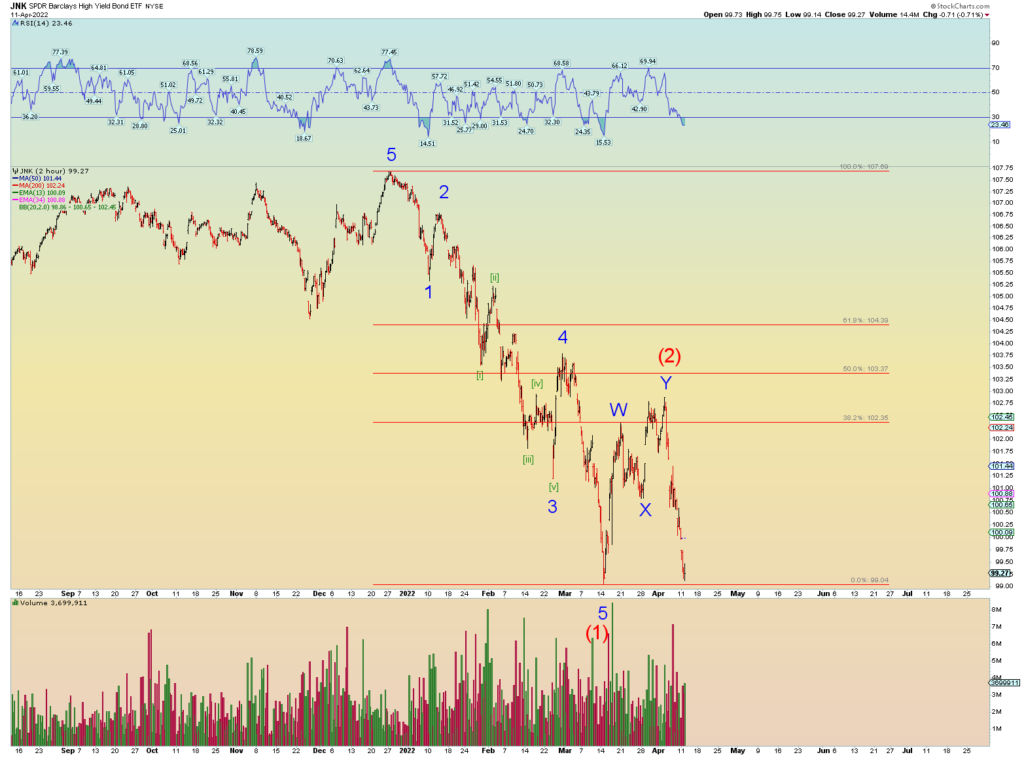
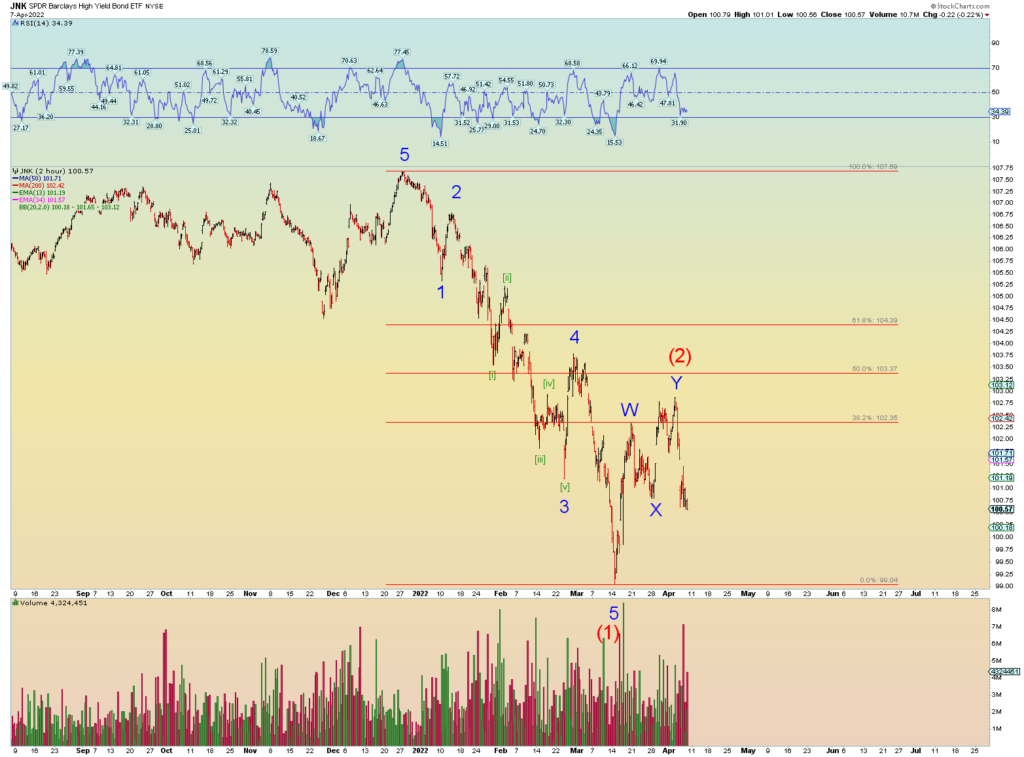
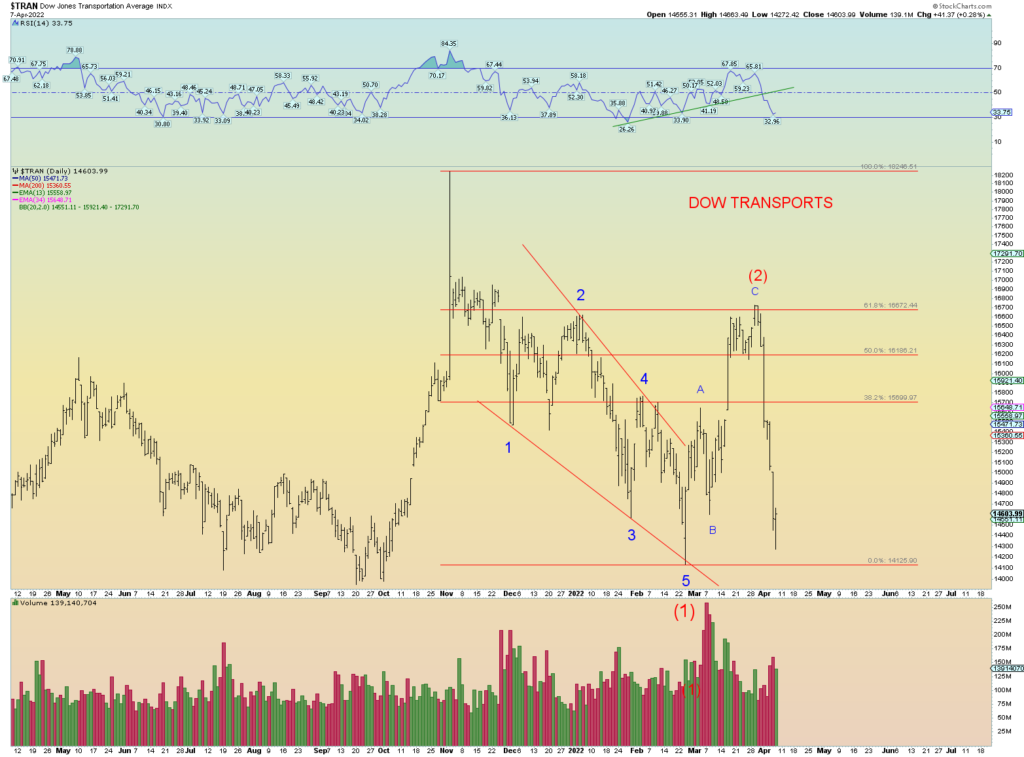
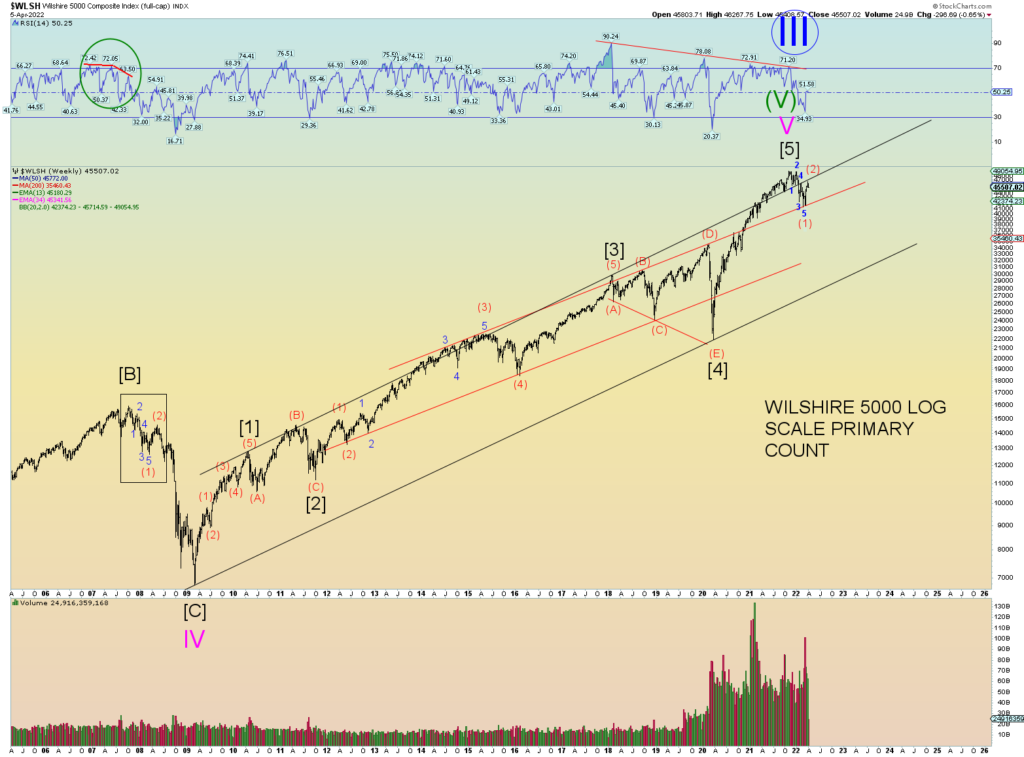
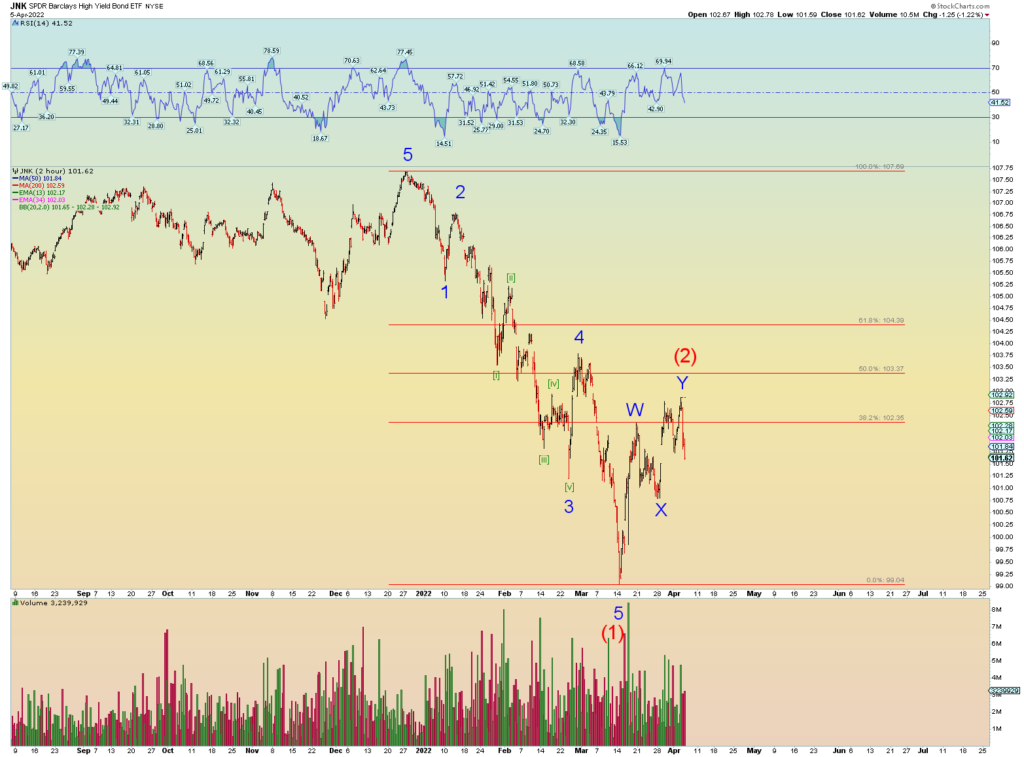
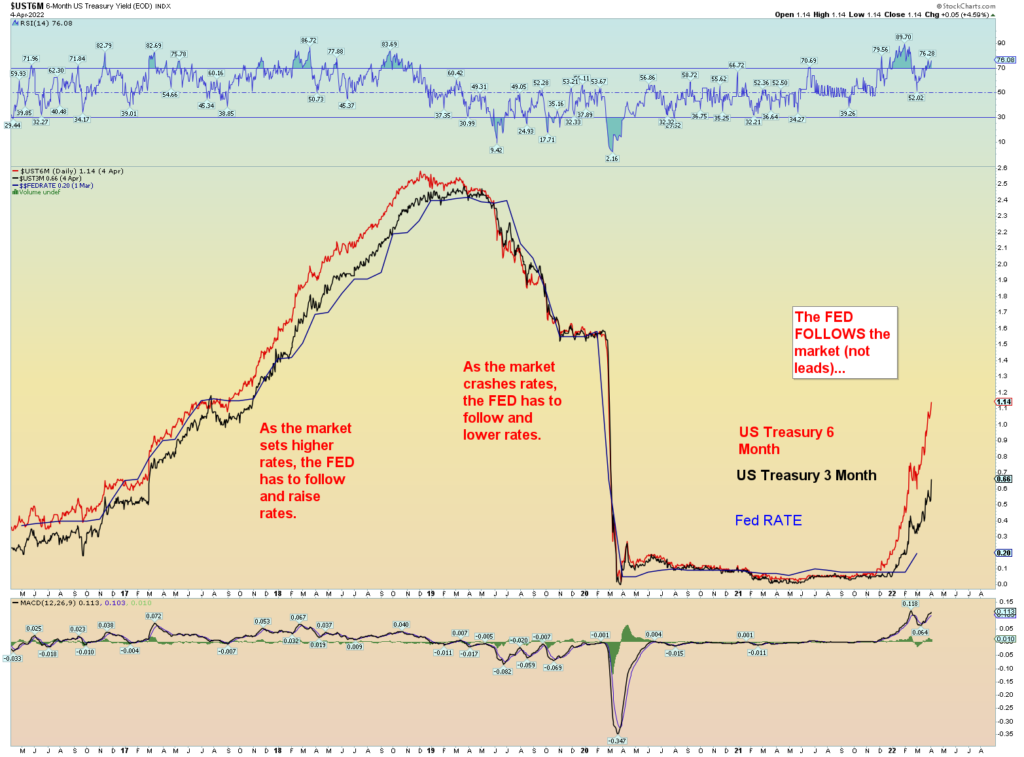
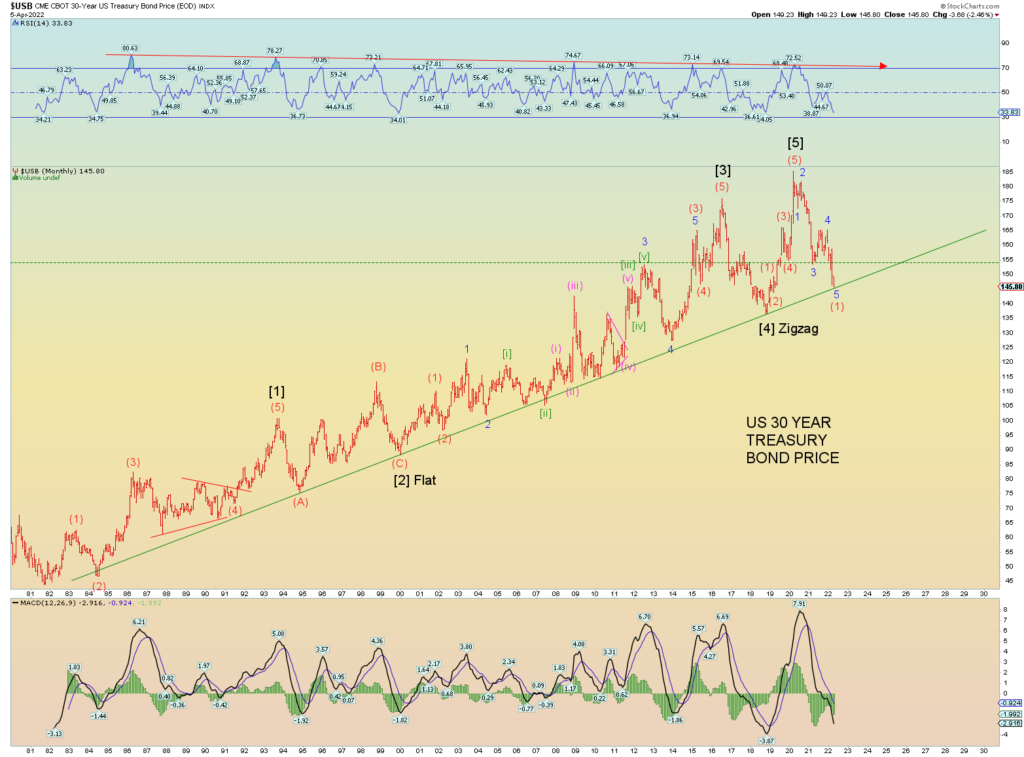
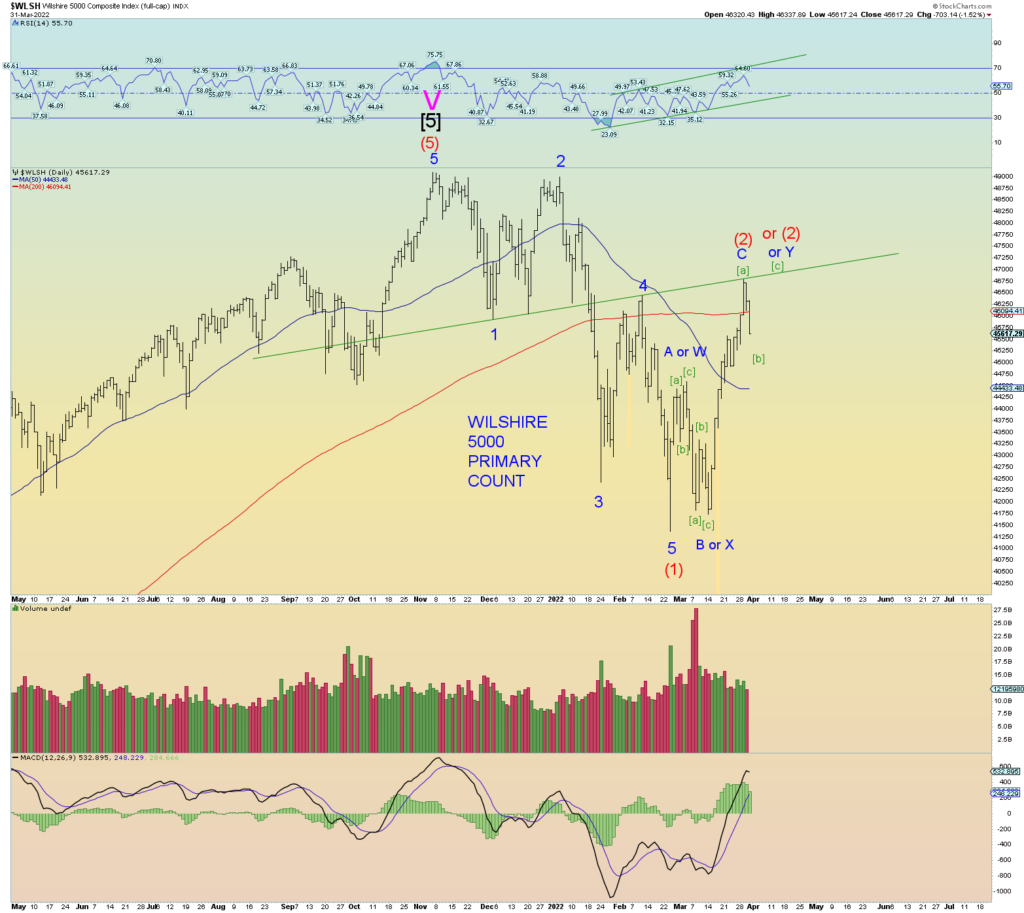
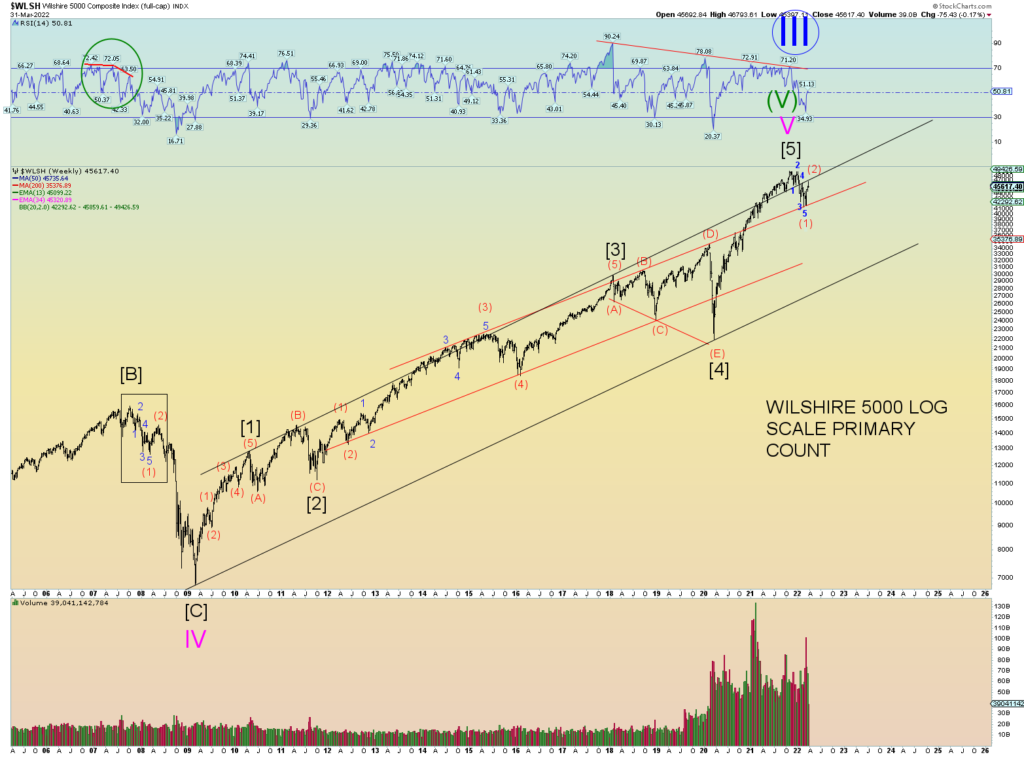
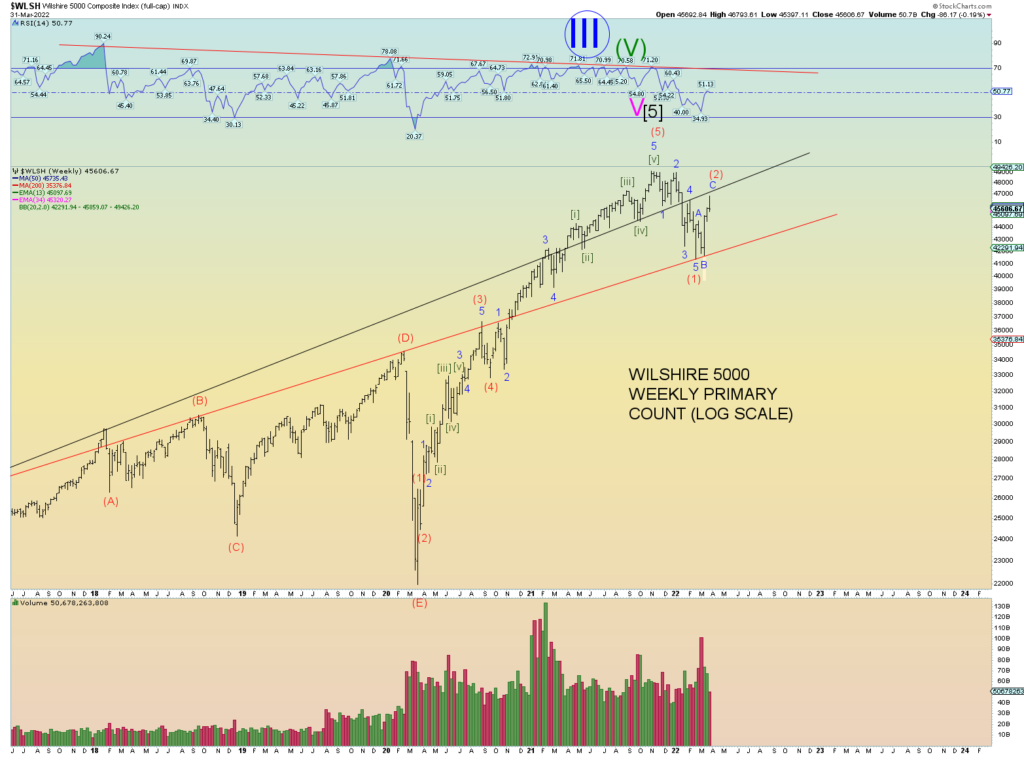
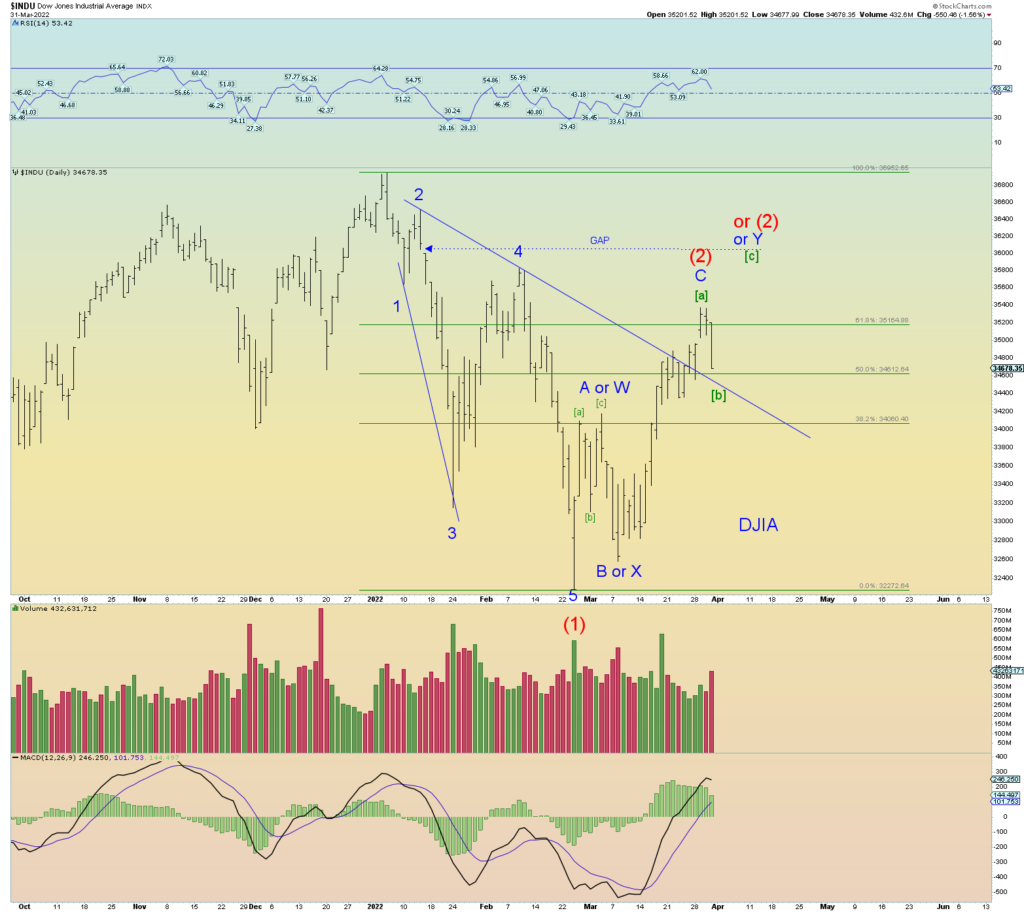
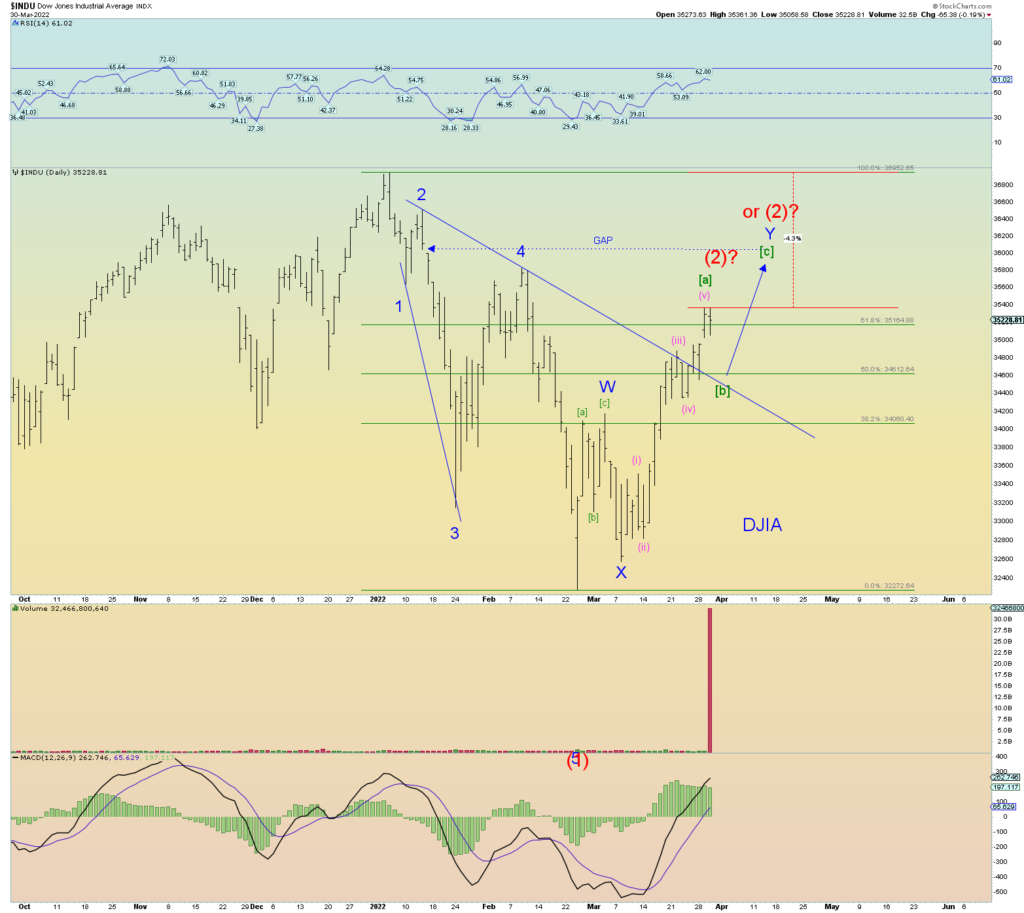
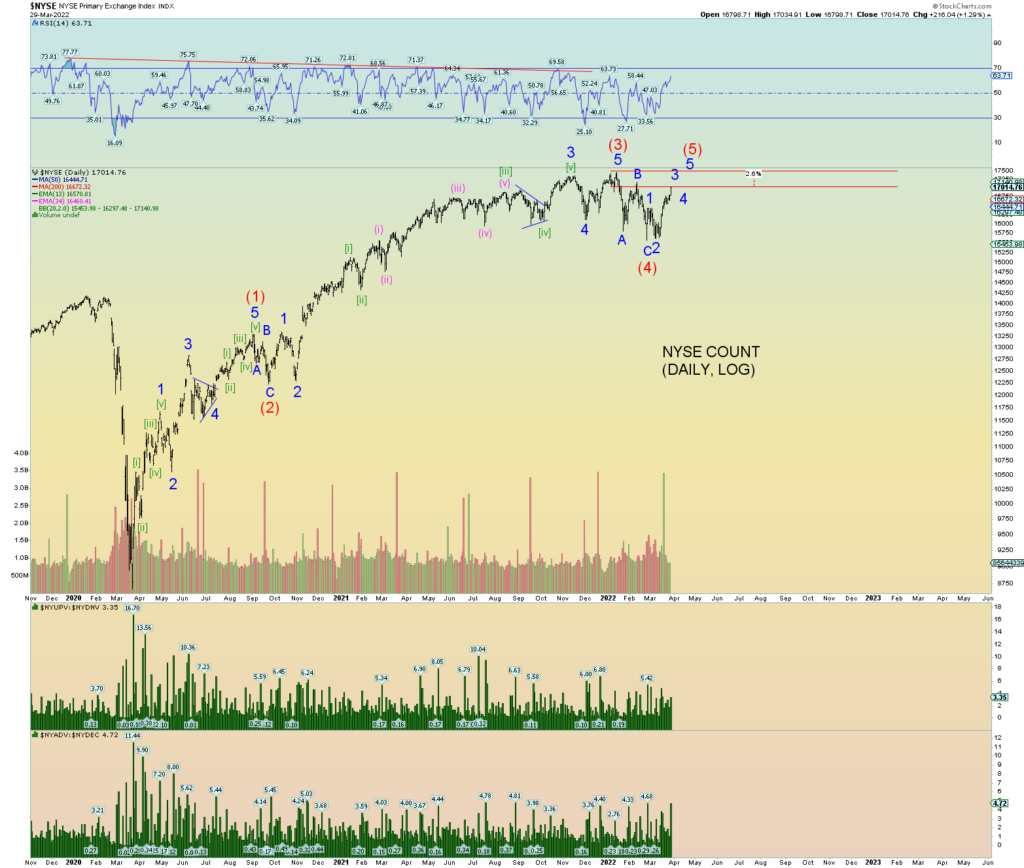
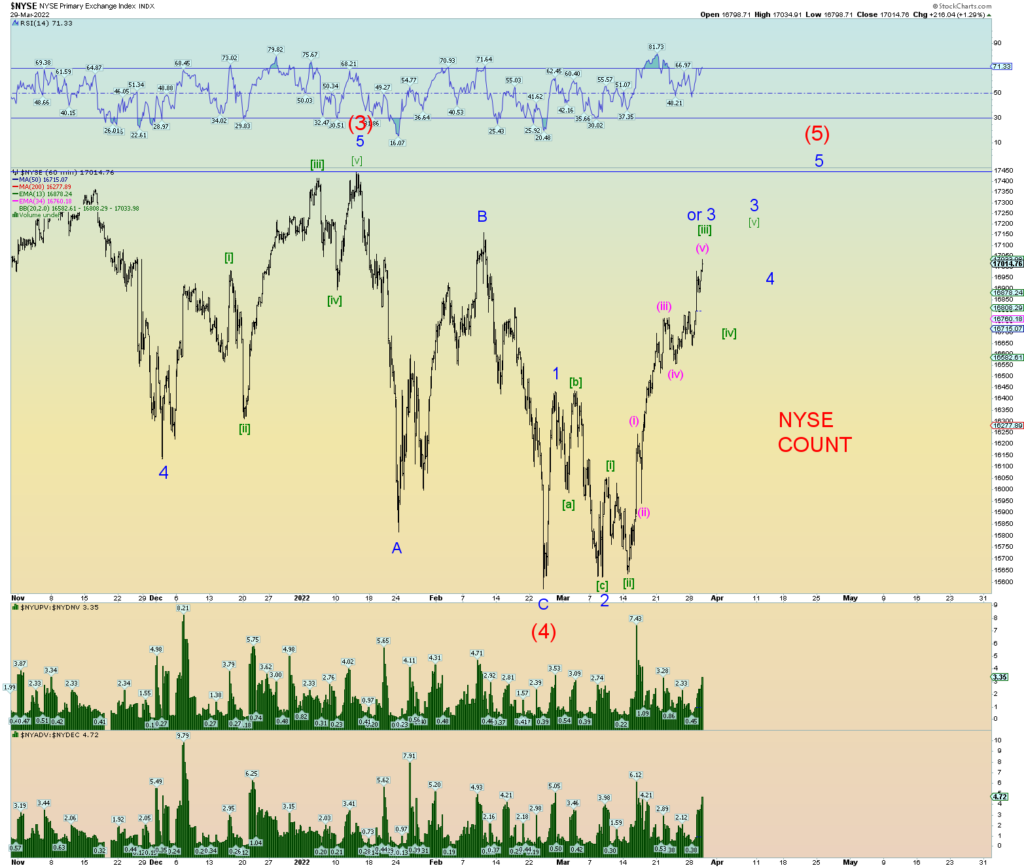
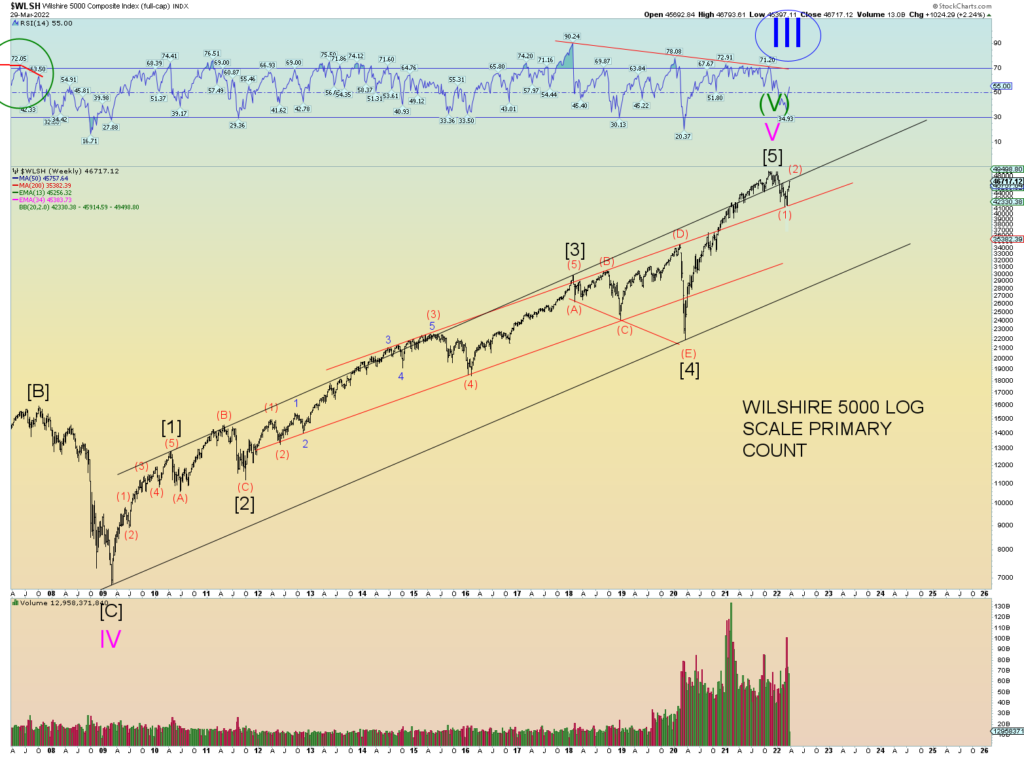
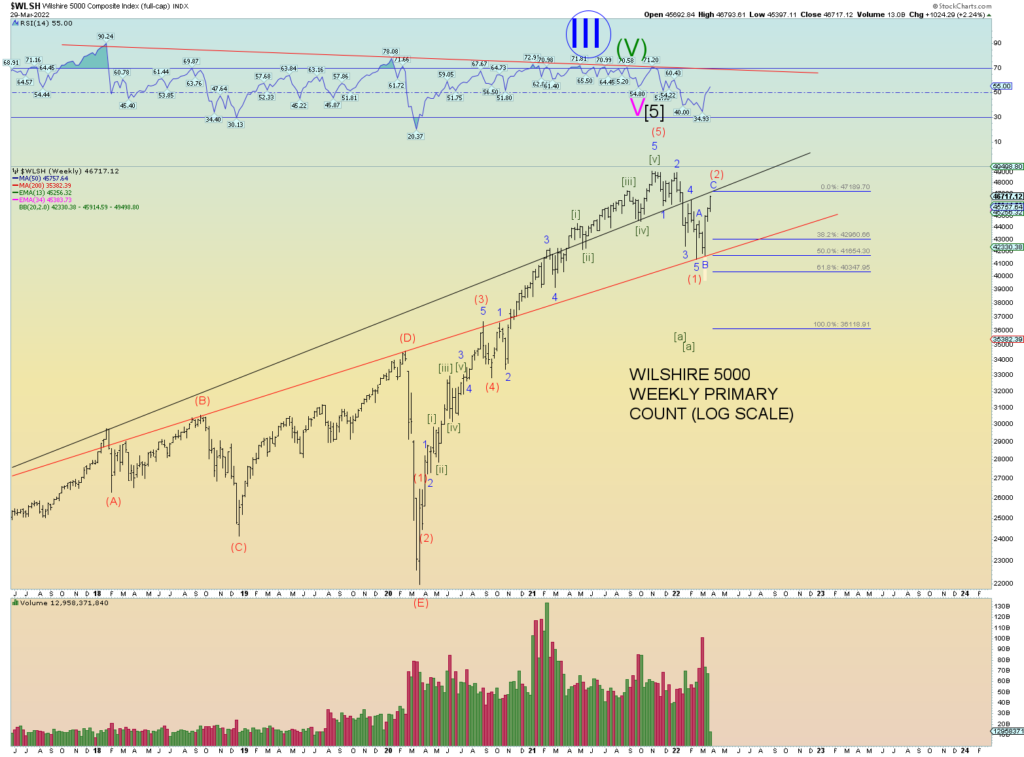
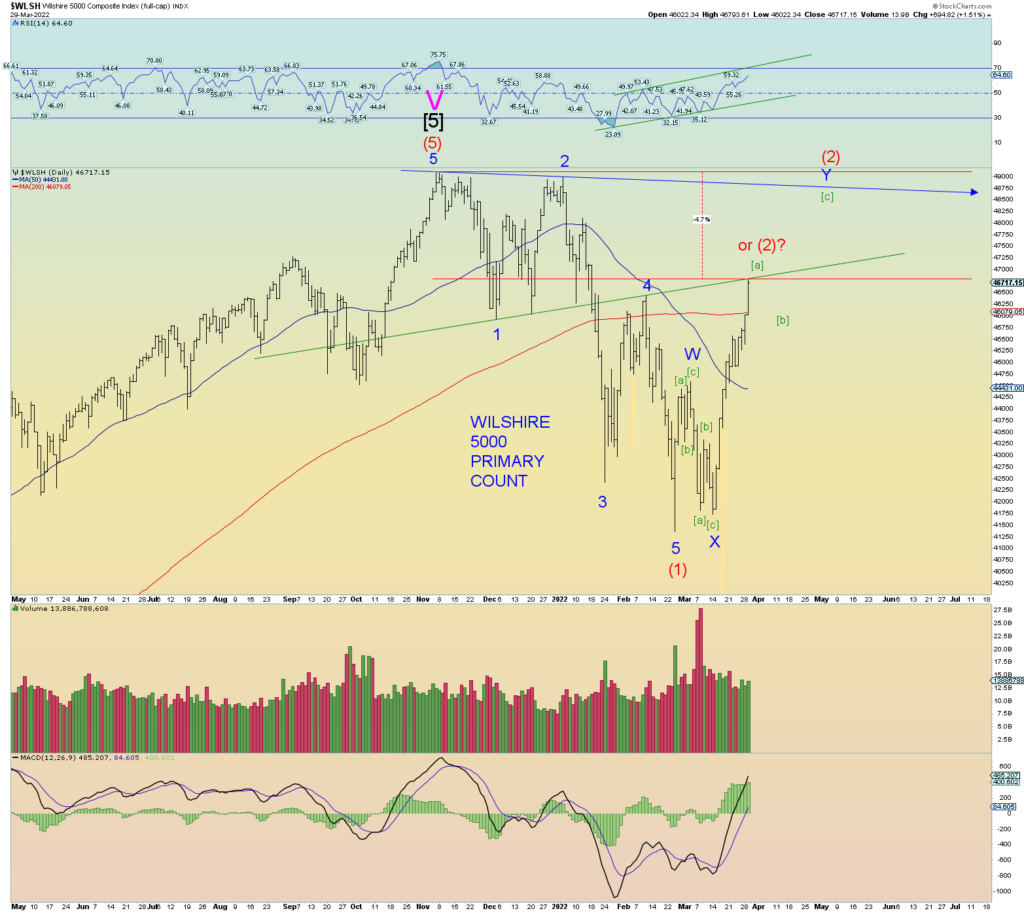
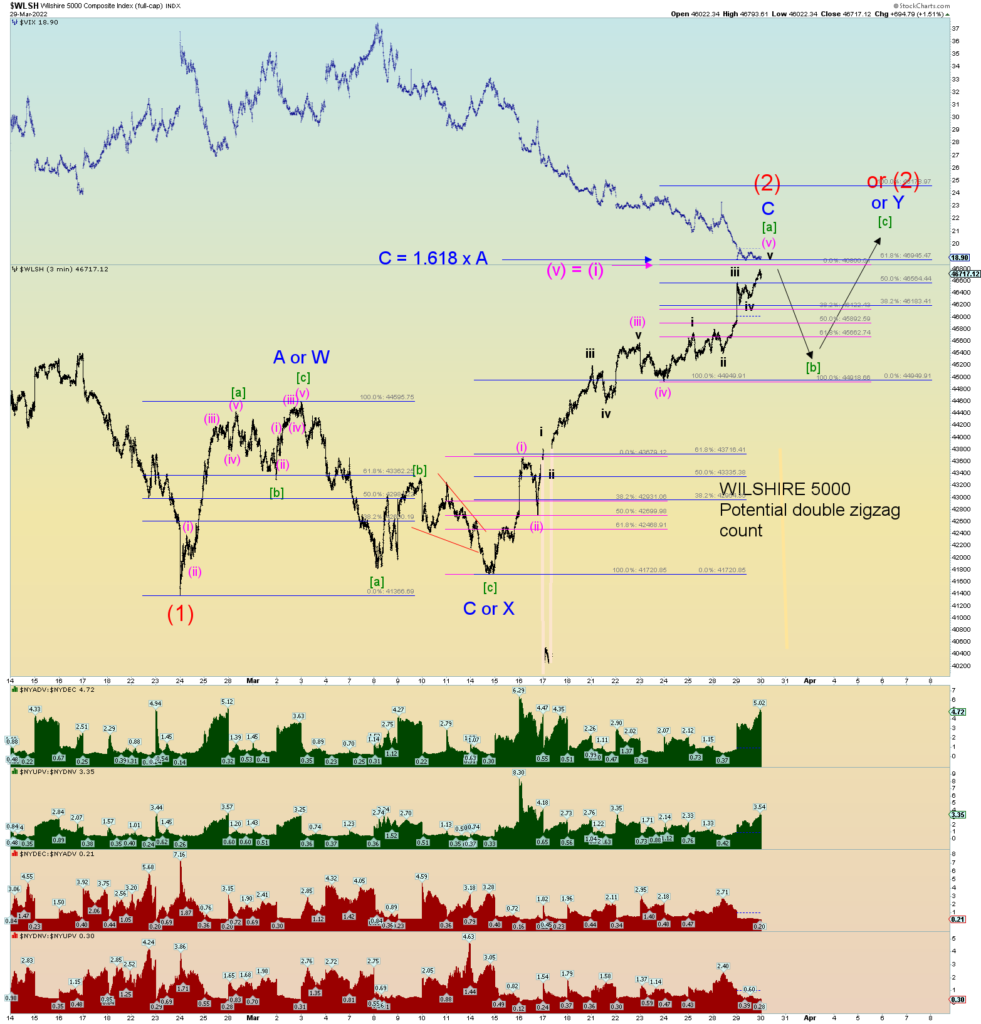
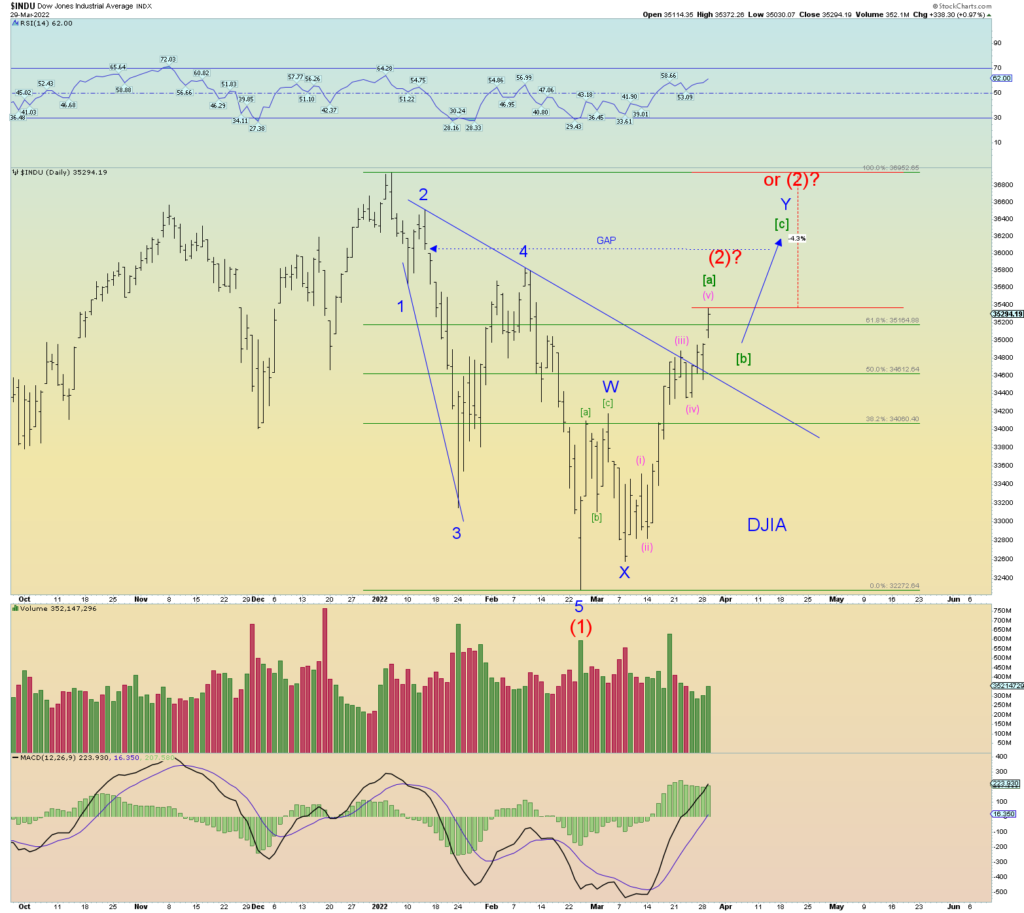
Update: Chart
Reposting God’s Super Number 2520 and the numbers that divide perfectly (God is perfect) into it. 2520 is the first number that can be perfectly divisible by 1 through 9 without any remainder. And if you are a Christian and read the bible, it is perfectly divisible with every prophetic number that God uses in the bible. Note the numbers on both sides of the = sign.
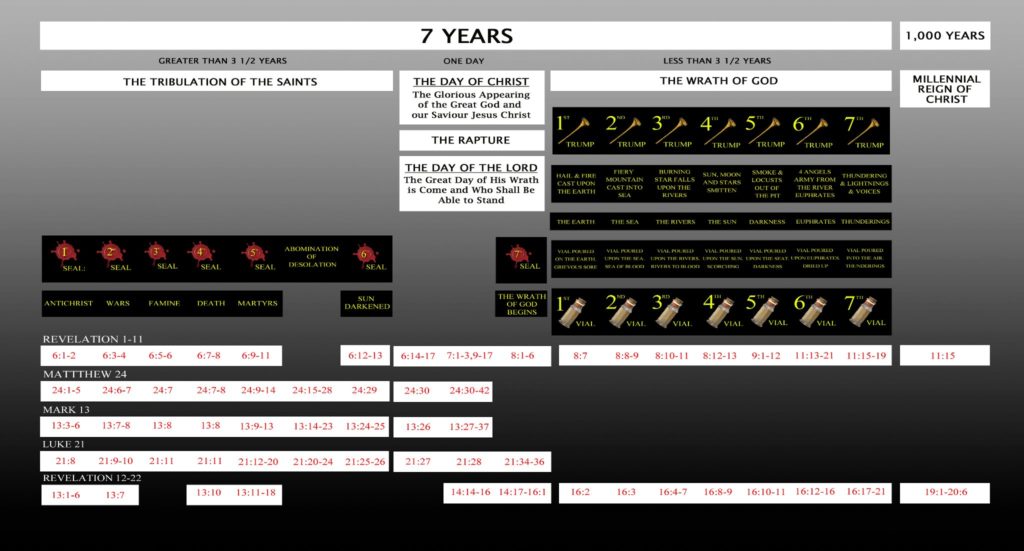
Note: to fully understand my blog post see this post on Daniel’s 70th Week here.
2520 / 1 = 2520
2520 / 2 = 1260
2520 / 3 = 840
2520 / 4 = 630
2520 / 5 = 504
2520 / 6 = 420
2520 / 7 = 360
2520 / 8 = 315
2520 / 9 = 280
2520 / 10 = 252
2520 / 12 = 210
2520 / 14 = 180
2520 / 15 = 168
2520 / 18 = 140
2520 / 20 = 126
2520 / 21 = 120
2520 / 24 = 105
2520 / 28 = 90
2520 / 30 = 84
2520 / 35 = 72
2520 / 36 = 70
2520 / 40 = 63
2520 / 42 = 60
2520 / 45 = 56
2520, I believe, is significant and the key to solving two prophecies in The Book of Daniel. It is the number that I have proposed that is the “handwriting on the wall” in Daniel Chapter 5 that tells us how long “Babylon” has until its destruction. I propose that it is a “dual fulfillment” prophecy. Daniel’s interpreting it to King Belshazzar in Daniel Chapter 5:
25 And this is the writing that was written, MENE, MENE, TEKEL, UPHARSIN.
26 This is the interpretation of the thing: MENE; God hath numbered thy kingdom, and finished it.
27 TEKEL; Thou art weighed in the balances, and art found wanting.
28 PERES; Thy kingdom is divided, and given to the Medes and Persians.
I am not the only one who has come to the conclusion that this prophecy has yielded the Super Number 2520. Note this web blog here: What Do the Words Mene, Mene, Tekel, Upharsin Mean (Daniel 5:25)?
They also view it as a dual fulfillment prophecy about “Babylon” but in my estimation, they are off the mark in the specific interpretation. God is more exacting in his prophecies. Yet nonetheless, I give great credit in that they see the same coming end result. They reach the same conclusion: Babylon will be revived, and it will not be a good thing and it will be destroyed again.
My interpretation is basically the same; Babylon kingdom, world empire #7 in biblical history, will ultimately be destroyed for the final time. However, I am more specific on times and dates based on the number 2520 which I think God wanted to be revealed in the end. He had revealed it to C.J Lovik, but C.J. is a “pre-tribulation rapture” believer, so ultimately C.J. is doubting and rejecting his very own work since 2021 has come and gone with no “pre-tribulation” rapture. So be it.
I have contacted Gabriel Ansley who also claims to know that Jesus Christ died on April 28th, 28 AD and insists he is coming back on 21 September 2028. But he is a post-wrath rapture believer (rare) who thinks Christians will be here not only for the 3 1/2 years of tribulation of Satan and evil men, but the following 3 1/2 years of the Wrath of God. Basically, he may have got the date correct – 21 Sep 2028 – but he is an idiot. Contacting him via email reveals he is an idiot x 2. He believes in post -wrath rapture. And that implies that Christians will be here for God’s wrath. He has no clue as much as C.J. Lovik. One is a “pre-tribber”, one is a “post-Wrather”. They are both ridiculous and follow false end-times doctrines.
Both have been blinded in a way. They both lack God’s solid gift of logic and hence they are in grave error in the end. One has promoted Christ’s coming “in secret” – the pre-trib rapture – and the other has promoted that Christians will be dodging fireballs from God and have to endure to the end in 2028. C.J. Lovik believed Christians would be “out of here” prior to 2022 (based on his Fall, 2028 end date) and Gabriel Ansley just assumes we are all going to keep going to the final wrath period right to the end enduring God’s Wrath. Note to both: We ARE appointed to tribulation and persecution at the hands of Satan and evil men, however we are NOT appointed to any wrath of God.
Oh, how have I linked myself to these “false prophets”! Yet I tend to think it was always in God’s plan anyways. He perhaps helped reveal correct prophecies to people who believe in wrong things and then tests and sees if they can overcome their other pre-conceived notions and come to better conclusions based only on the Word of God. Both have failed miserably so far. Both are stubborn. Which I predicted in my mind.
So that leaves me in that grouping of three that believes in a Fall September 2028 final date.
[UPDATE: Let me be clear, because I may be coming across with a false sense of “righteousness” – NO! I am an idiot just as the other two I have written about! Nobody should willy-nilly the prediction of the Coming of the Lord! – I am just writing about my experiences with the other two I have written about. And I am actually giving the credit to them because I didn’t initially come up with Fall, 2028….they did. Yet it is an appealing date, so I am going with it until it proves otherwise. All I am saying is that they are wrong on the rapture which is completely key to everything. In the end, date setting is futile, and I would not die on this sword if there were no primary signs mainly global war!]
One who interprets the bible to a “post-trib/pre-wrath” rapture event based on a September final end 2028 date and the start of Jesus’s 1000 year “millennial” kingdom. The pre-tribber is scrambling for more “clues”, the post-Wrather is awaiting God’s destruction, I guess. I will say it now: They are both retarded and need to find wisdom. I pray for them both. But I won’t throw out the baby with the bath water. I still like the 21 September 2028 “end of the world”, end of nations date. I have recently been squirming and trying to come up with an “alternate” count. But I cannot it keeps coming back to that same date or at least the season and year of Fall, 2028.
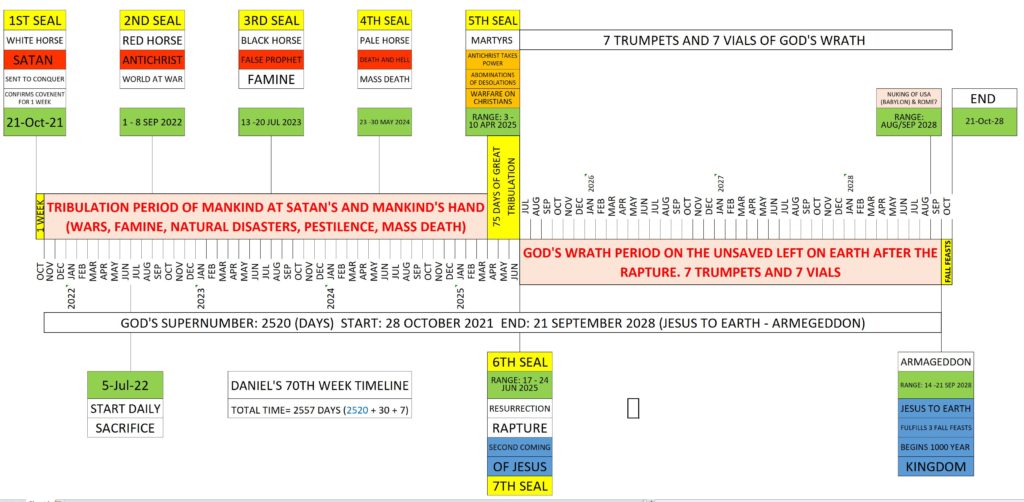
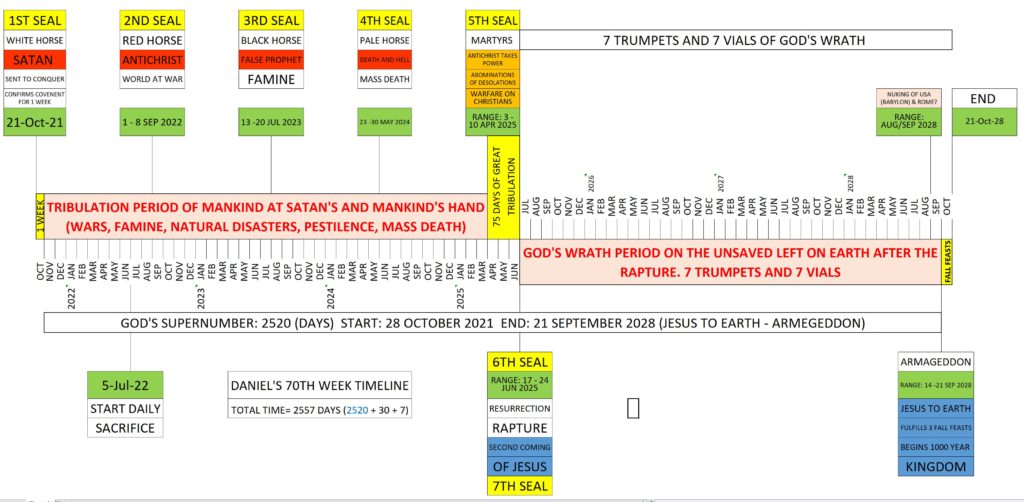
Why? Because the (general) date of 21 September 2028 (+ 0, – 30 days) links with two ancient prophecies in the Book of Daniel that can only be solved by God’s Super Number: 2520. The first prophecy is the “handwriting on the wall” and the second is the solving of “Daniel’s 70th week”. I propose today that both are linked to 2520 and both link the same end game date: the day of the “final Trumpet” of Jesus Christ when he comes down on His glorious white horse with all his saved following on our own horses to do battle with Satan, the Antichrist, and the False Prophet more or less on the date of 21 September 2028.
So why would you believe me if I have presented the “false fruit” that others have claimed? In addition to me, both C.J. Lovik and Gabriel Ansley have claimed the date of Jesus’s crucifixion death of 28 April 28 A.D., arriving to that conclusion in a completely separate fashion. They likely don’t know each other exists. One is a typical “Dispensational” Pastor who believes in the pre-trib rapture, the other has claimed to have visions and came to some pretty nifty bible conclusions of what I will call “Dispensational Lite”. There is truth in what Mr. Ansley writes in his books. His book connects the symbolism of the bible in wonderful ways and that is a gift. The bible is so deep in interconnectedness, that one can read it for 100 years and not find all the mysteries. But in end-times specific events, he is clueless as much as C.J. Lovik. I propose a middle path to both. I actually just read the bible for what it plainly says, nothing more, nothing less. Perhaps I have a better cold gift of logic and they do not. That is not to boast, God forbid! If they are wrong, that makes me just a tad wiser by default. See? Logical.
The solving of “the handwriting on the wall” is ultimately a dual-fulfillment prophecy. The near term was fulfilled that night when Belshazzar, the King of Babylon was slain, and the Medo-Persians took over the empire. The second fulfillment will be the final destruction of “Babylon” kingdom #7 – the New World Order – as explained in last night’s post here: New World Order, Antichrist, Mystery Babylon. Bible Symbolism. 2520 = God’s Super Number
Yet when it comes down to it, the date of Jesus’s crucifixion is KEY to unlocking Daniel’s two most cryptic prophecies. Can anything be solved without Jesus? (of course not!) Jesus’s hypothesized crucifixion of 28 April, 28 AD is the key to both prophecies’ timeline fulfillment. (Note: “28” is on God’s special number list”)
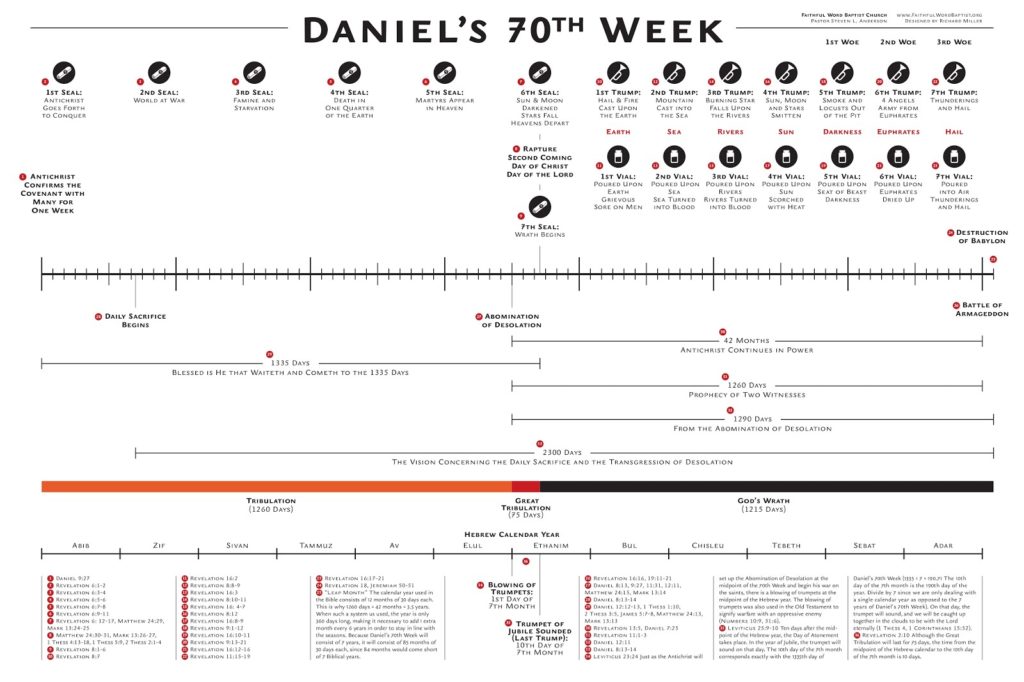
The solving of “Daniel’s 70th Week” is also solved via 2520 as explained in this blog post from last summer here: Daniel’s 70 Weeks of Years. I write about both C.J. Lovik and Gabriel Ansley.
Last night’s blog post expounded on the meaning of the bible symbolism (7 heads, 10 Horns/Toes) of the Book of Daniel – an Old Testament “Revelation” of Jesus Christ – and the Book of Revelation of the New Testament, the final book of the bible. The main theme was that all the symbolism, although seemingly confusing and endlessly complicated is actually not at all. That the main theme is that God is telling us that there has eternally existed a “Babylon” empire since the time Noah got off the ark – and God doesn’t like it – as empires only bring out the worst in man. God does not want us to be “united” in a one world nation (government).
“2520” links to both of Daniel’s two most cryptic prophecies:
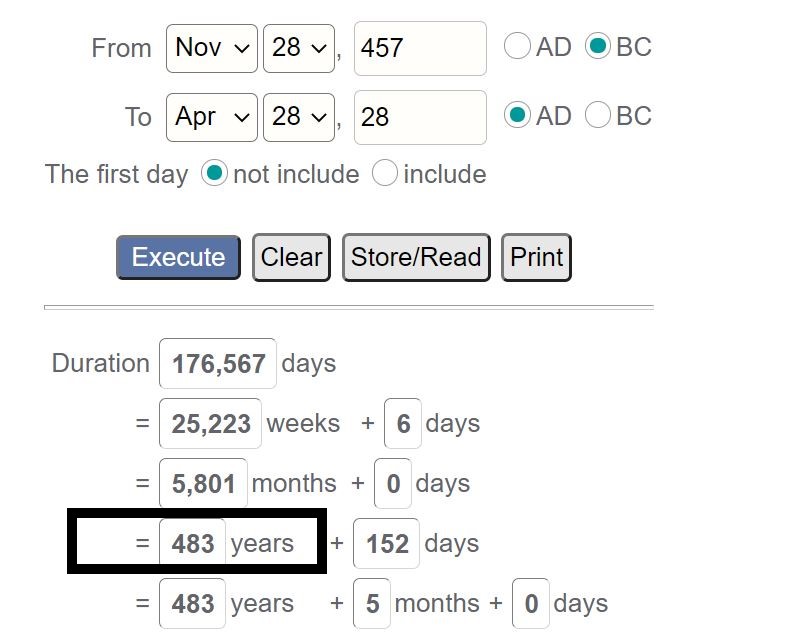
1) 2520 prophetic years (of 360 days) from the “decree” of Artaxerxes in the Fall of 457 BC to the time Christ is anointed King (starting his millennial Kingdom). I propose that final date is 21 September 2028. That fulfills Daniel’s “70 weeks of years”.
2) A permanent destruction of “Babylon” kingdoms, of which there will be 7 total.
The end date of 21 September 2028 gives us a final end date result for both the time Jesus is anointed King on earth (70 weeks of years) and the very date the “final” Babylon kingdom is destroyed for good (Handwriting on the wall). And both are based on the decree of Artaxerxes of 457 BC which is derived by counting backward in time from the season and year of Jesus’s proposed crucifixion – the Spring of 28 A.D.
Jesus’s proposed crucifixion date of 28 April 28 A.D. unlocks both prophecies.
We go backward in time 69 weeks to get to the day of the decree of Artaxerxes: (for sake of illustration, I use 28 Nov 457 BC as the decree date – we don’t know the exact very day) We only now that after 69 weeks (483 solar years), Jesus died:
And for the final “end” of “Babylon” – biblical world empire #7 (and the final) is “weighed and judged”; a prophetic 2520 years. For the same day Jesus is anointed King of the Earth (proposed, 21 Sep 2028), the final Babylon Kingdom of the Antichrist is destroyed. So yes, Babylon has indeed been “numbered”:
26 This is the interpretation of the thing: MENE; God hath numbered thy kingdom, and finished it.
Since we know that the actual Babylon Kingdom was really only Kingdom #3 on a biblical timeline of 1 through 7, we can expect that the number “2520” must be involved with its final destruction for good since we think 2520 is what is written on the wall. And in Daniel’s 70th week prophecy we get the final answer. Therefore, both are linked. The solving of Daniel’s 70th week of Fall, 2028 matches the final solving of the “2520” handwriting on the wall prophecy of when the “Babylon” Kingdom will finally end for good. They both point to September 2028.
They both point to the same end date. The “70 weeks of years” prophecy (until Jesus is anointed King on earth) is solved by using the 2520 from the “writing on the wall prophecy”. And the writing on the wall prophecy (final destruction of Babylon) is solved by the determining start date (decree of Artaxerxes) of the “70 weeks of years” prophecy. They are both eternally linked.
God’s Super Number 2520 and the proposed date of the crucifixion of Christ – 28 April 28 A.D. – are key to both prophecies. The “70 weeks of years” gives the true end date but when we apply that back to where we got the number “2520 to begin with, the handwriting on the wall, we can see that also is solved for when the final “Babylon” world empire kingdom will be destroyed. I propose on or about 21 September 2028.
ARE THERE POSSIBLE OTHER ALTERNATE YEARS BASED ON THE ABOVE?
Both yes and no. And the answer is mostly based on the proposed crucifixion of Jesus Christ. Change your crucifixion date and that starts to make things go off by 3 or more years and does not match the bible. It not only changes the proposed date of Jesus’s crucifixion, but it also changes the date of Artaxerxes decree significantly. I have wrestled with alternate years based on 2029 through 2031 and beyond and it has been difficult to make everything work which is why I haven’t faltered.
Note this study on the 28 April 2028 proposed date of crucifixion of Jesus:
If you read the above PDF, I do not agree on everything it says – particularly its brief mention of how it interprets Daniel’s 70th week and its end target date, yet on the whole, it presents a lot of good truth. For one, God specifically told us the stars and sun and moon were meant for the marking of times and seasons. He WANTS us to use that to gauge events in time and the celestial study narrows down the crucifixion date to a very narrow range.
The answers to the end of the world are indeed embedded in the bible. Yet God did want us to record seasons and years to mark events past and future. So, I am trusting in some things that were studied by man. When celestial events happened in the past. We have computers now that can reliably and accurately date celestial comings and goings. I trust in that because God specifically told us that we should. God never said trust in blood injections of poisons (so-called “vaccines”) but he DID tell us to trust the heavens for signs and seasons and prophecies. So I will.
There can be only a few proposed dates for the crucifixion of Christ based on celestial events alone versus all the other clues from the bible. The window is actually narrow. One thing I do know is the bible prophesized he would be buried 3 days and 3 nights. That is a perfect 72 hours, and you’ll note that is a number divisible into 2520 and then having a perfect remainder. So, a Friday crucifixion and then Sunday resurrection and ascension to heaven does not match mathematically to what most Christians are taught and believe. The bible tells us 3 days and 3 nights. Therefore, I whole heartily believe in the Wednesday date of crucifixion to fulfill that prophecy. This is the whole purpose of prophecies to begin with! So, we can see and know that God’s word is true and perfect!
God doesn’t want us to be confused. Note that there are no “Fibonacci” numbers in the bible (other than the first few 1,2,3,5,8,…21). Infinity-type numbers are reserved for the eternity and mystery of God. Mankind chases it in a futile attempt (perhaps I am guilty too) but will never find the end of that rainbow, Like the number “Pi”, there is no solving it. This is proof that God made his universe in a very complicated thing that can never be solved by man. Yet the Kingdom of heaven can be solved simply by man. 2520 and all its simple easily divisible numerical products is proof.
And salvation is simpler than that: Just believe on the Father’s Son, our Lord and Savior Jesus Christ!
God wants it simple. Revelation is simple for those that are wise. Not smart, just wise. Wise enough to know that seeking answers via the universe and not God will only end in endless Fibonacci spirals. Sure, we can use these wonders of nature to announce and declare God’s glory, but only as a means to give glory to him and show that he is real. I know he is real, because we cannot solve Pi, we cannot solve Fibonacci numbers. I imagine that God can.
Fibonacci numbers are of this world, we can use them to see the somewhat unpredictable rise and fall of sinful mankind. And that is why I still do it. But God’s biblical numbers are perfect. We can see this in 2520.
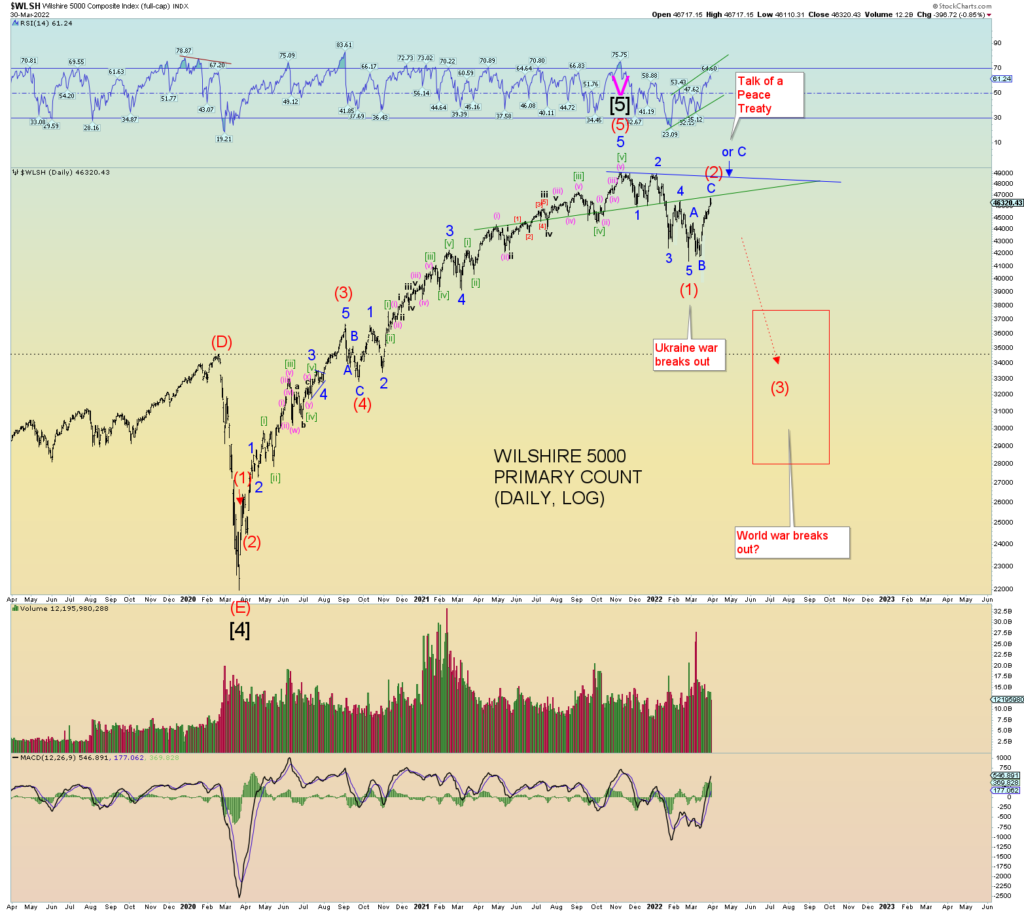
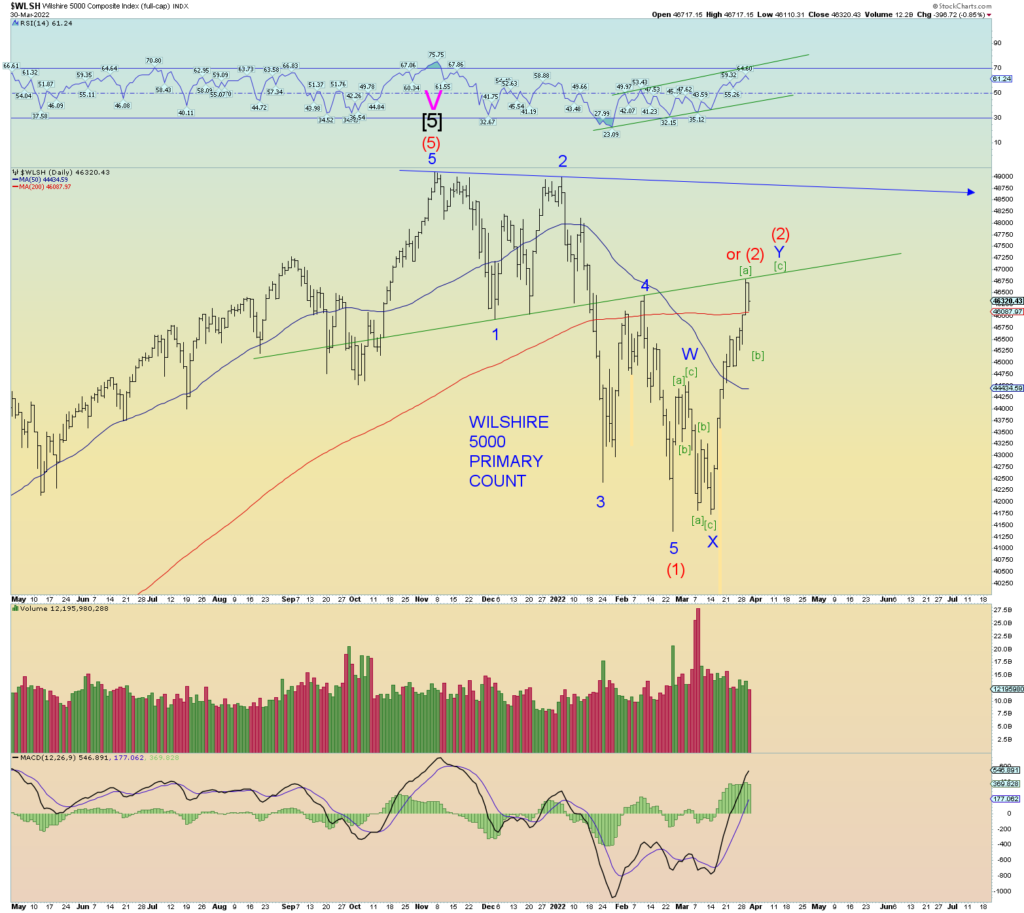
Regardless, Jesus told us what to look for at the end of days. And the biggest thing that makes us go “hmm” is global war. I am not dogmatic about end times events! If no global war this year, and if not likely by September 1st, I will rightfully doubt my September 2028 date. For Jesus told us in Matthew 24 what to look for:
5 For many shall come in my name, saying, I am Christ; and shall deceive many.
6 And ye shall hear of wars and rumours of wars: see that ye be not troubled: for all these things must come to pass, but the end is not yet.
7 For nation shall rise against nation, and kingdom against kingdom: and there shall be famines, and pestilences, and earthquakes, in divers places.
8 All these are the beginning of sorrows.
Are we at the beginning of sorrows? Surely for the 3 – 4 million refugees, and counting, of Ukraine the answer is yes. I pray for the safety of the inncocent!
So don’t take my word for anything! Read the bible and determine for yourself! If we do not have an expanding global war by the end of 2022, I will say I am likely wrong.
I have told this repeatedly. No global wars = no tribulation.
But we are on our way, yes? Biden and company want to eliminate the nations that resist the New World Order. A global conspiracy to create a one-world government is bible prophecy 101. As is a one-world religion and currency to be able to participate in society.
If you beleive me about the “secular” things I say, cannot you see the bible is real?
What other religious book predicted almost 2000 years ago we would be implanting “marks” into our body to be able to buy and sell to be able to participate in society? Haven’t we seen a “foreshadow” of this with “vaccine” policy worldwide?
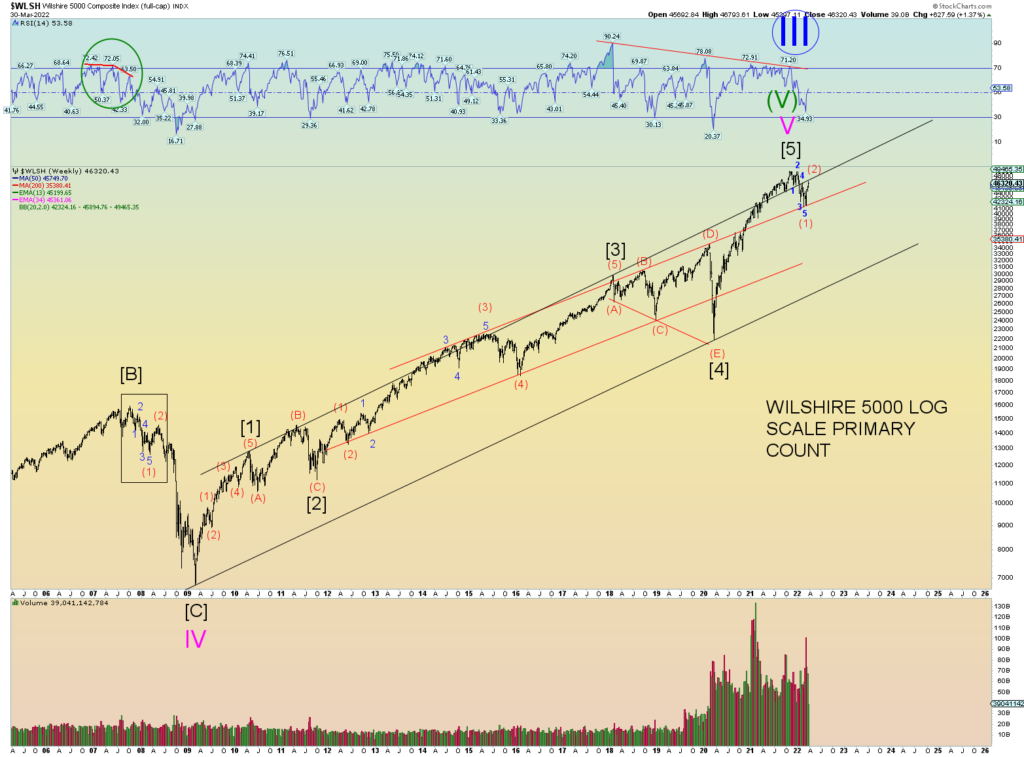
Do you not see that the worldwide Ponzi global financial system is poised to implode to bring about a one world currency after the collapse and devastation and ruin? And that the globalists – led by Satan – will have all the “answers” to the coming wars, and famines and devastation? And then come up with a new “system”, a “mark” to make you participate or else? Have we not seen how the media will blatantly pump-up people (Zelensky) that should be scrutinized and perhaps vilified? That the propaganda machine – the coming False Prophet – will crank it up to “11” and present us with the last Antichrist and insist that we should love him?
Why is it I no longer get emails saying I am crazy?
The bible accurately predicts how the world will end as we know it. It predicts a one world government, a one world religion, a one world currency. Is this not exactly what the globalists want in addition to a great culling of the earth to less than 500 million?
But as I told you, Jesus himself will destroy this final Babylon World Empire Kingdom #7 for good and establish his true and just reign. It will be glorious!
It will be glorious for me! But not for you if you have not Jesus Christ, Lord and Savior of All!
It is simple to be saved: Just believe on him in your heart!
