I tend to agree with Karl Denninger here in that we are at war with Russia. It will escalate.
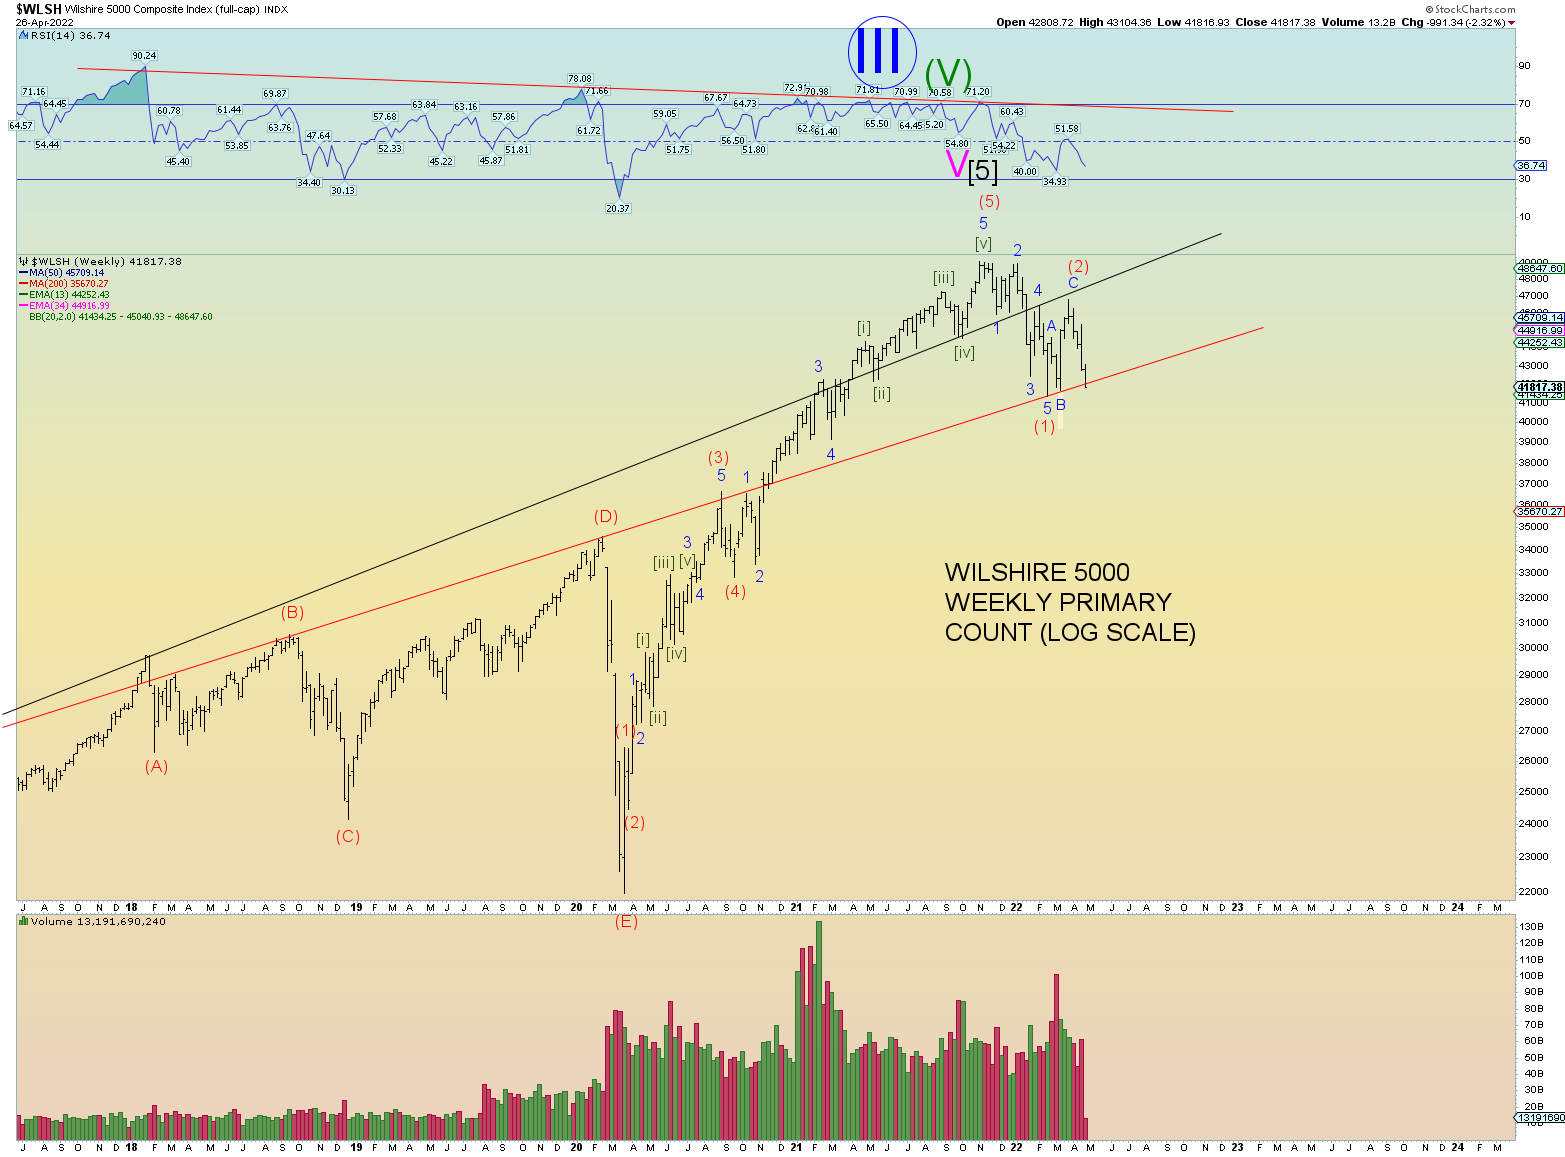
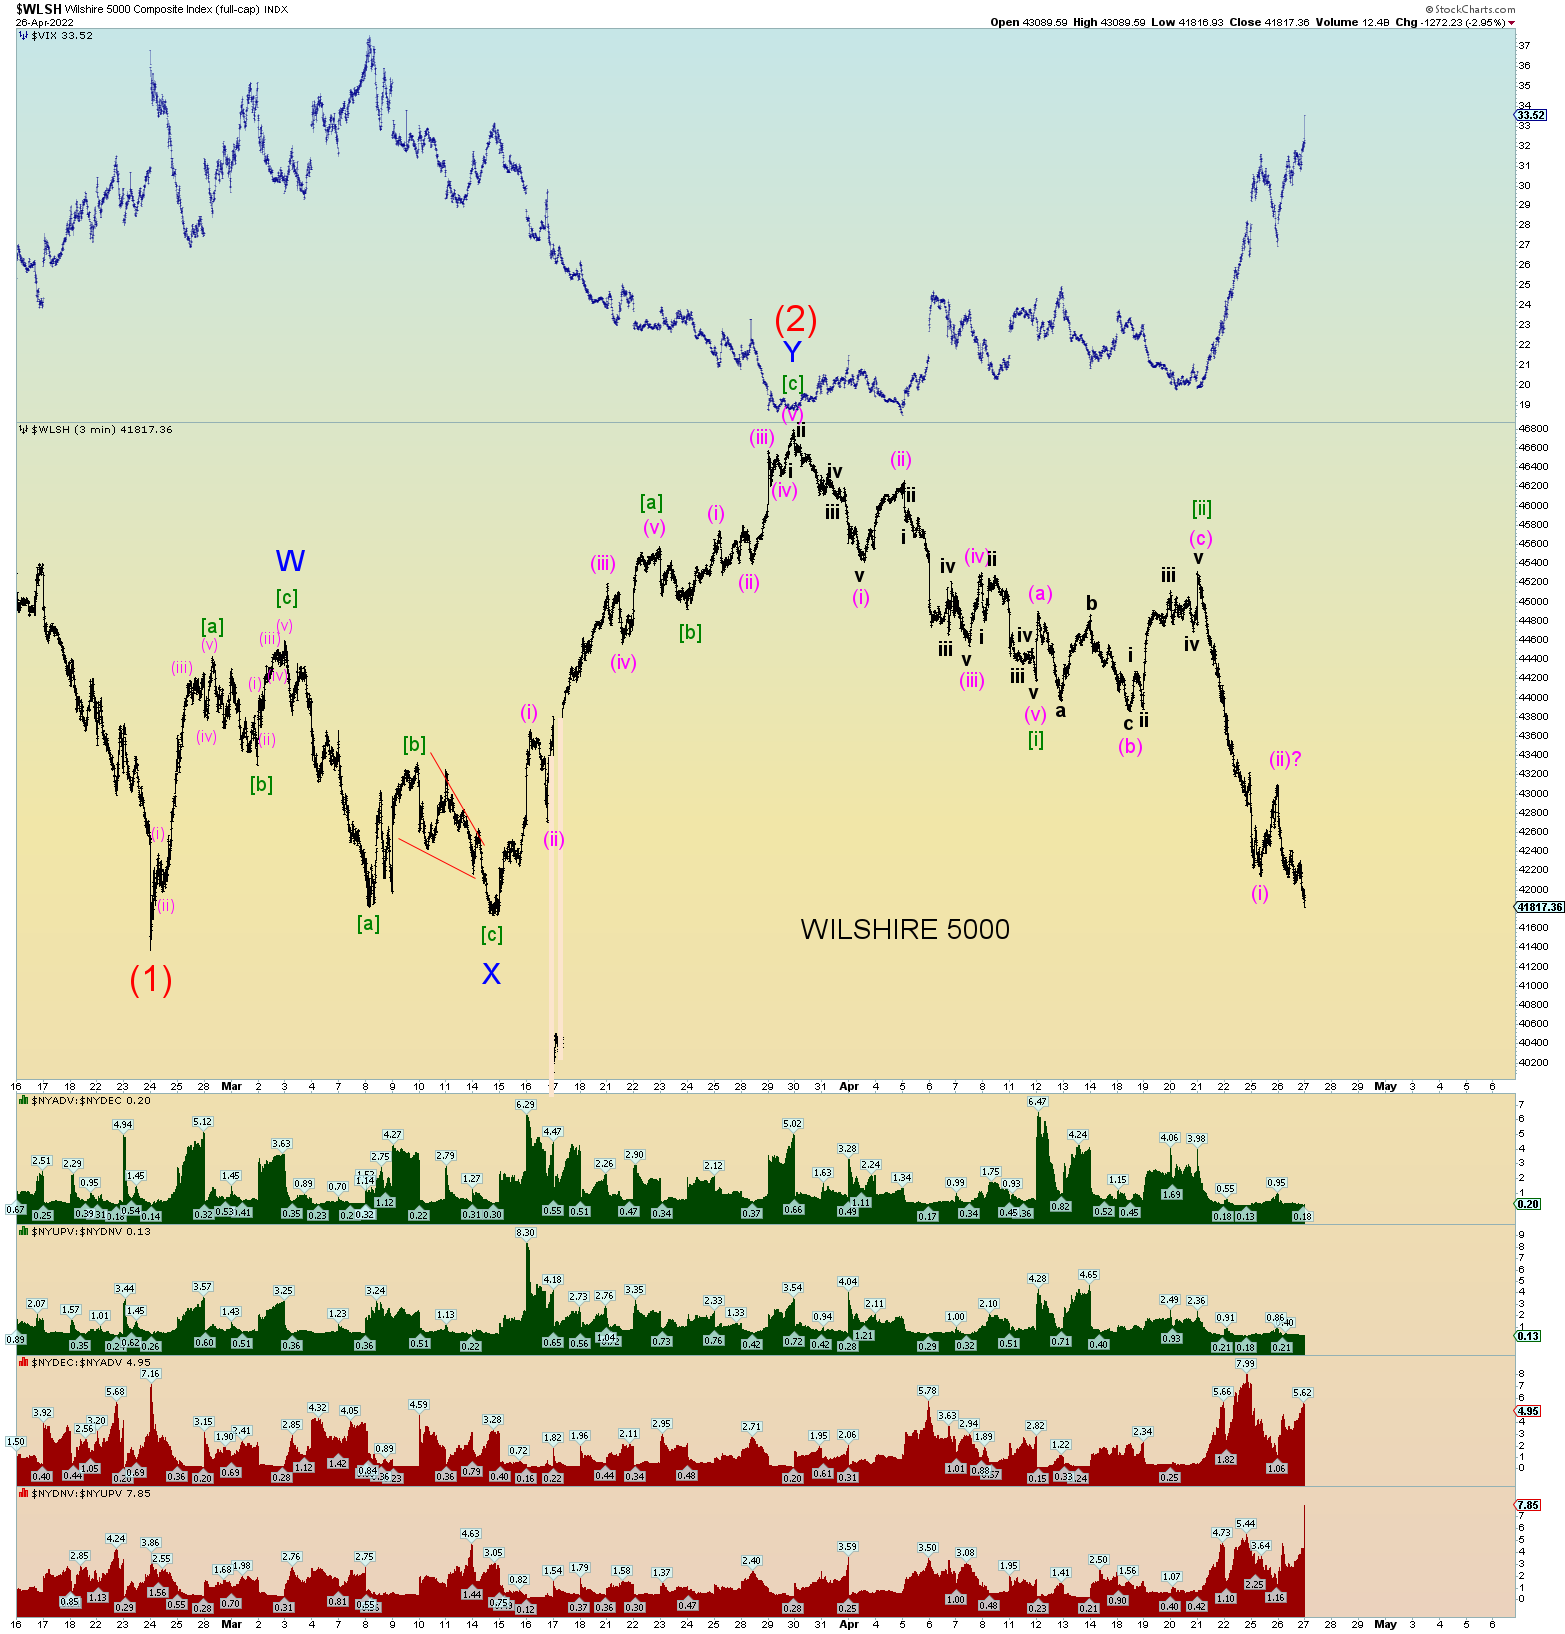
The waves are progressing nicely.
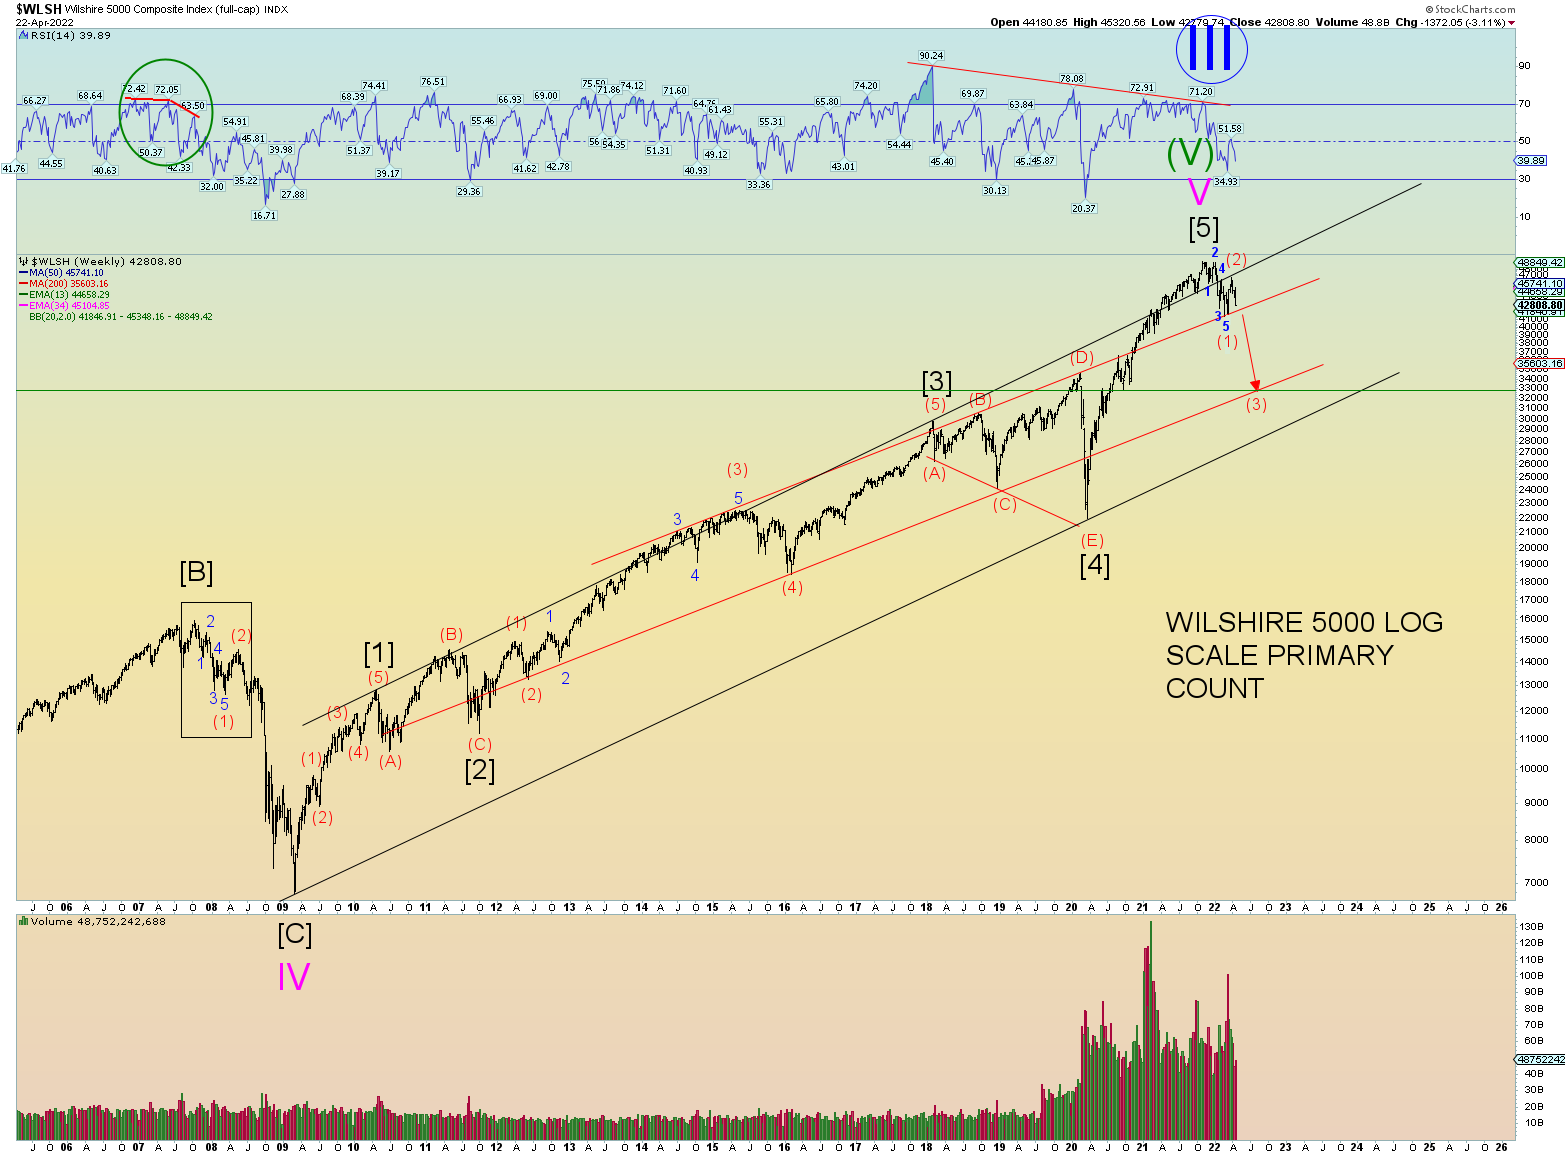
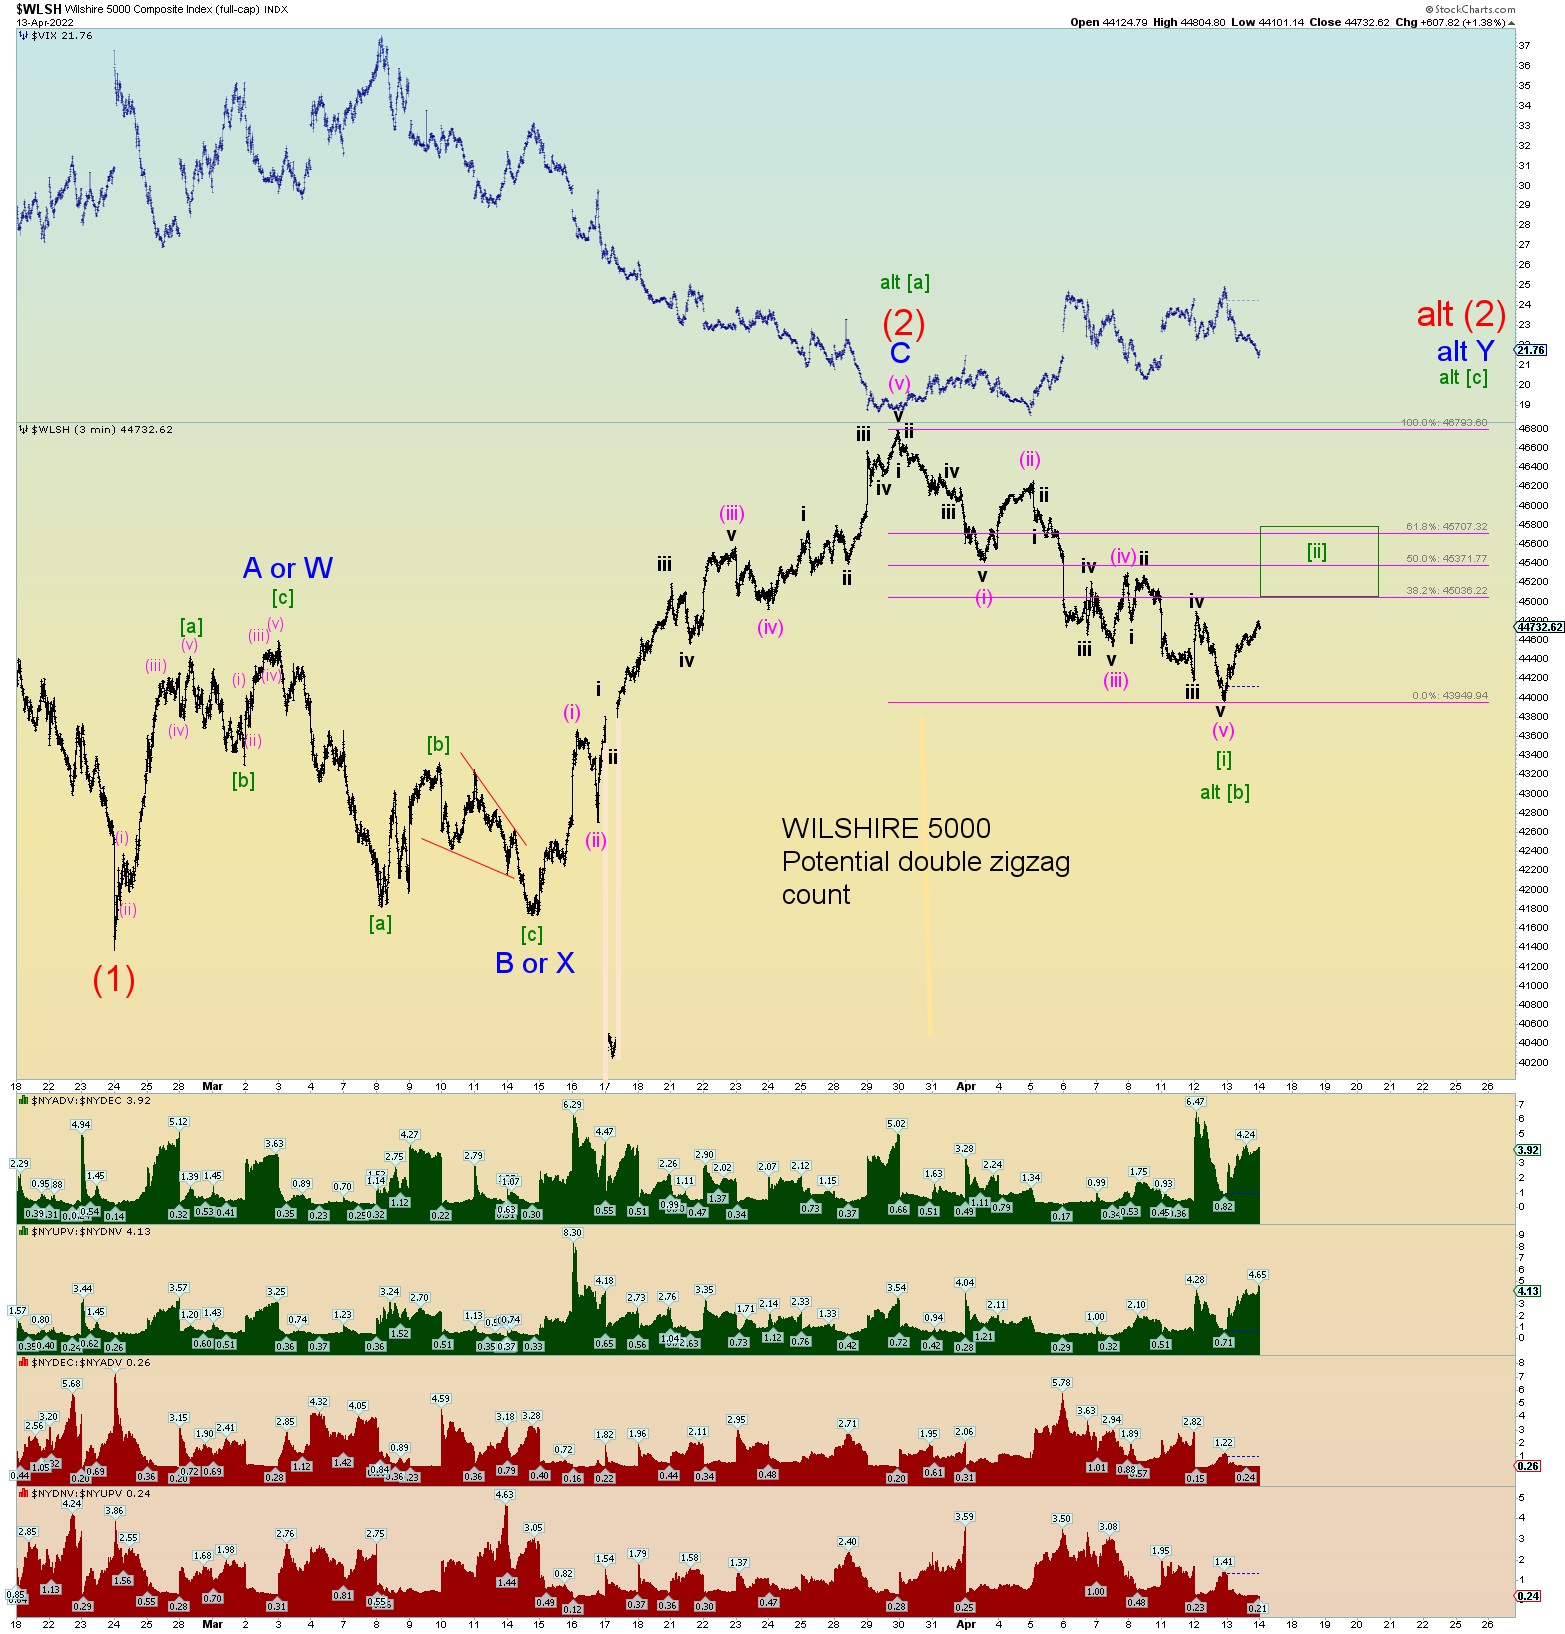
Now that prices have closed to a new market low, the blue downside line makes a nice target for Minor 1 or (3) down some several thousands of points lower.
The alternate count is that we are nearing the end of Minor 1 of (3) down. We’ll know soon enough I imagine of the market’s intentions. We have now a lower low than wave (1) which was a requirement for 1 of (3) down. There is nothing technical-wise or sentiment-wise to suggest that this count is correct. Hence an alternate count.
Viewing world events from a biblical end-times perspective is the only thing that makes sense. In fact, it makes perfect sense. If you have been following my commentary over the past few weeks, I have put it in rather simple terms, and they are all biblically grounded and prophesized about:
1) We may very well be in the final 7 years – known as Daniel’s 70th week – and that the Antichrist is rising to power as we speak. Satan is behind it all giving him power.
2) Global war is an element of “proof” and that is expected to expand greatly by September 2022 (if not earlier).
3) That every world leader and institution, government, military, corporation, financial entity, media, entertainment, etc. is run by people who worship Satan. Everything. If you have doubts, take 5 hours to watch this video here.
[UPDATE: Maybe this is hyperbole to say that “every” institution is led by people who worship Satan. I should have just said all institutions are led by non-saved people at the very least. Allow me to explain further: Are there any true bible-believing Christians that run anything in this world including your local municipal government? Your schools? At the very least, the world is run by people who either pay lip service to God (fake Christians and there are not even many of these anymore) or people who claim to be Atheists, or people who actually worship Satan but do it in secret.
The high-ranking members that go to world meetings such as Davos, attend the Bohemian Grove ceremonies, the “Jackson Holes” of the world, the World Economic Forum, the people in high places of power on this planet are NOT Christians, and I argue NOT Atheists. They HATE that when Jesus came 2000 years ago open worship of devils and paganism was drove underground. They HATE Jesus’s name. They so desperately want control of the world to eliminate the name of Jesus and openly be able to practice their worship of the dark forces of this world out in the open. And they will win for a short time. They will get their dream New World Order!]
4) That the goal of Satan is to unite the world in a biblical 7th world empire; “Babylon”, otherwise known as the “New World Order”. This is the final one before Christ comes back at Armageddon and destroys it for good.
5) That there are 10 global powers (think nuclear weapons for starters) that must be united to “enable” the one world government and then easily subjugate the rest (3rd world nations).
6) The Antichrist is seen as a great warrior and speaker (liar) and not of the 10 great powers – he is (seemingly) an outsider. His biblical task is to subjugate 3 world nations of power (likely nuclear powers) that are resisting the New World Order, not out of a sense of righteousness, but out of pride and glory. Again, there are no righteous kingdoms on this earth. It is the devil taking out uncooperative reprobates for his own sake.
7) That eventually Satan and the Antichrist wins and gains the main objective of uniting the world and installing the Antichrist as world leader.
8) And after that, a one world religion and currency will be initiated. The “final solution” will be the global mandatory “mark of the beast” – an RFID chip that is implanted into the right hand or head. The main goal of this campaign is to find and kill all the bible-believing saved Christians on the planet, the only ones who cannot be defeated spiritually (yes, we win in the end).
9) Christians will be hunted and killed worldwide and in great numbers. And if it were not for the fact that Jesus comes back in the clouds with great power and glory at approximately 70 days past the midpoint of Daniel’s 70th week – 3 1/2 years – , all flesh would be lost. This day of power and glory is known as the first resurrection of all the saved dead and rapture of those believers remaining alive. We are rescued and then God pours out his wrath on this earth for the next 3 1/3 years until the final battle when Jesus and we come down on horses and all the reprobates are killed. Satan, the Antichrist, the False Prophet and all his armies are slaughtered every man to the last.
I’ll stop the event order at that point. The main theme here is that we are “looking” for biblical events to support this synopsis and timeline. It seems that Russia, under Putin, is not agreeing to subjugate to the New World Order and it could be the first nation of 3 that the Antichrist “defeats”. The Ukraine war instigated by agents of Satan has one goal: Regime change in Russia to one that will submit to the NWO.
Zelensky could very well be that Antichrist figure. Whenever the “right” and “left” and even Baptists align on an issue, you can believe that Satan has accomplished his goal greatly. Is he the Antichrist? That we will not know until the Abominations of Desolations. Yet regardless, he is an Antichrist type figure and fits the profile.
Therefore, we know from the bible of what to look for: 1) Purposeful global war whose goal is to subjugate 3 nuclear power nations into accepting the New World Order. 2) A potential “antichrist” figure – perhaps an outsider – selected to “lead” these wars of regime change.
Those two items are the only thing we need to focus on at this stage. Do things seem on track? They certainly do. The head “Babylonian” city-nation leading the charge to create the NWO – the United States – seems to be pushing things to the brink of possible nuclear exchanges. And no one seems to question things.
Again, like the “vaccine” campaign being a forewarning of the coming mark of the beast campaign, this global effort to effect regime change in Russia may very well fail and is perhaps only a “forewarning”. It could just be yet another foreshadowing to us here on earth of what is to come.
Therefore, one must make an assumption and I have. Either we are in a biger global war by September this year or not. If not, then I am likely wrong about us having actually started Daniel’s 70th week. It doesn’t mean it won’t start in 2023 or so, but all the “forewarnings” and foreshadows seem to indicate it will be within a less than a decade regardless.
So again, this is not a “prediction” it is merely a “watching” that Jesus commands us to do at the end of days. So, I am watching. My timeline hasn’t changed. One other item of interest is that if a “daily sacrifice” of animals starts up again in Jerusalem on or about 5 June 2022. It may be done in secret, or it may be done for a day and then done in secret. I just don’t know but keep your eyes peeled!
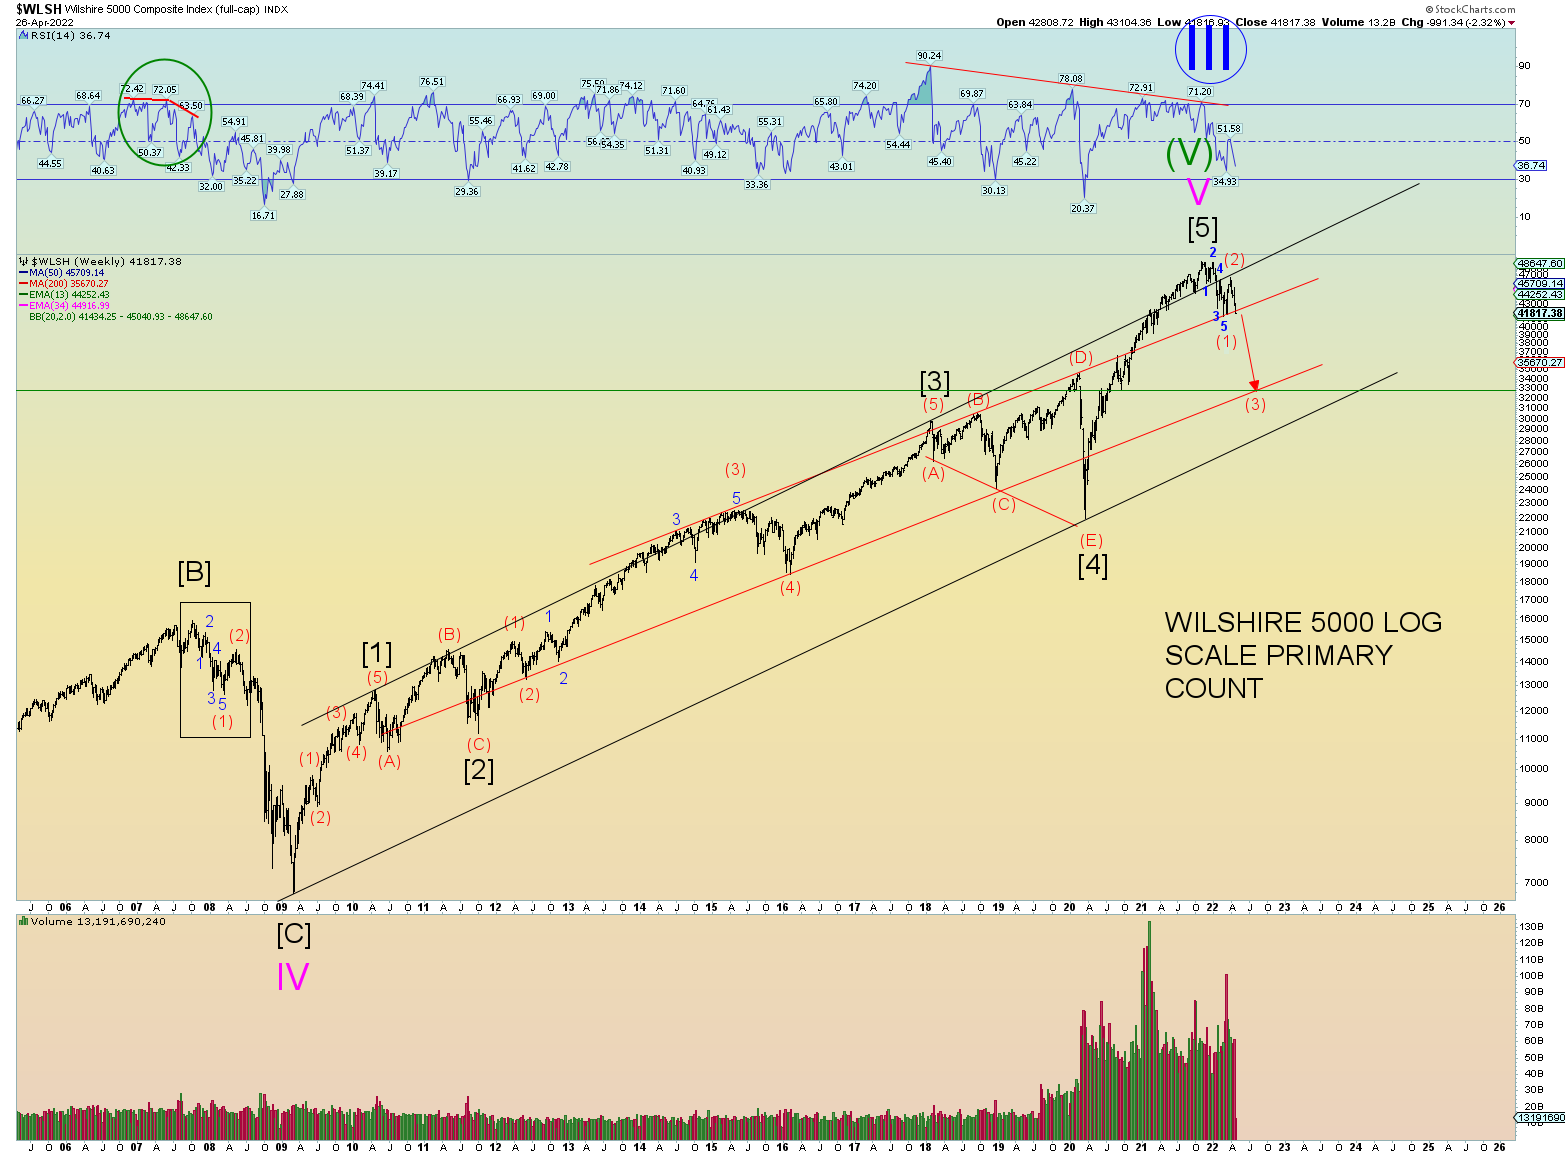
THE COUNTS
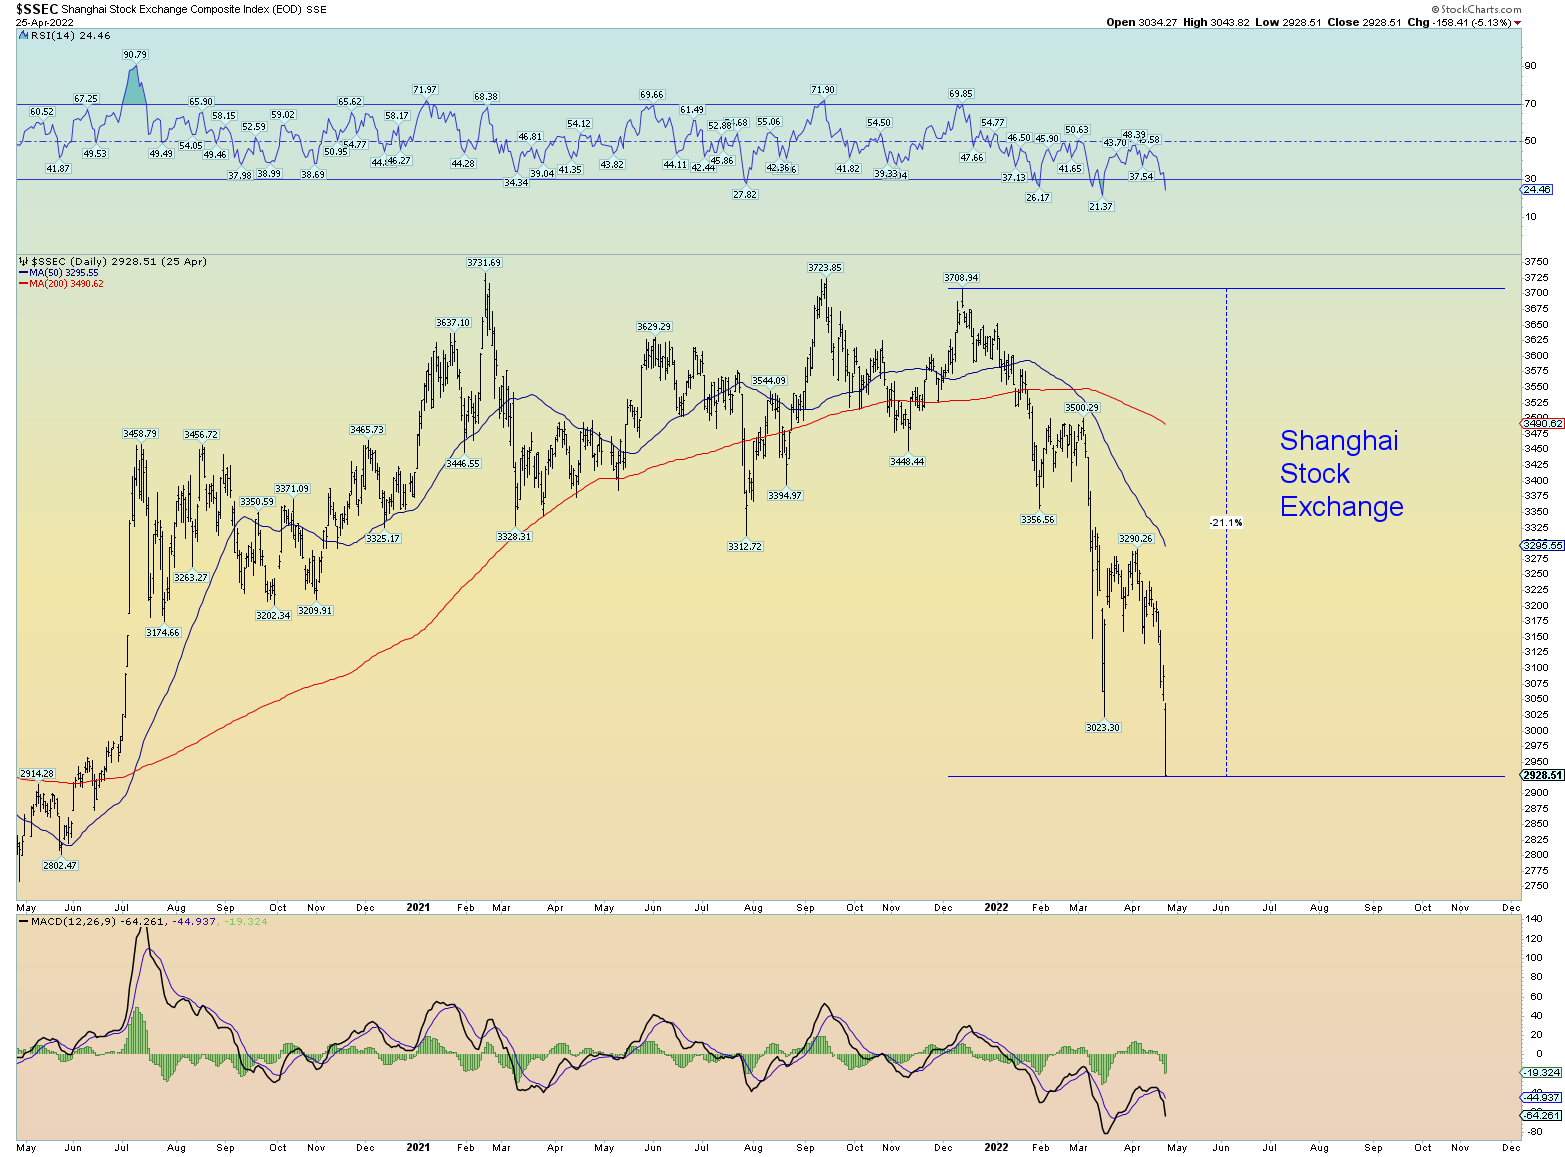
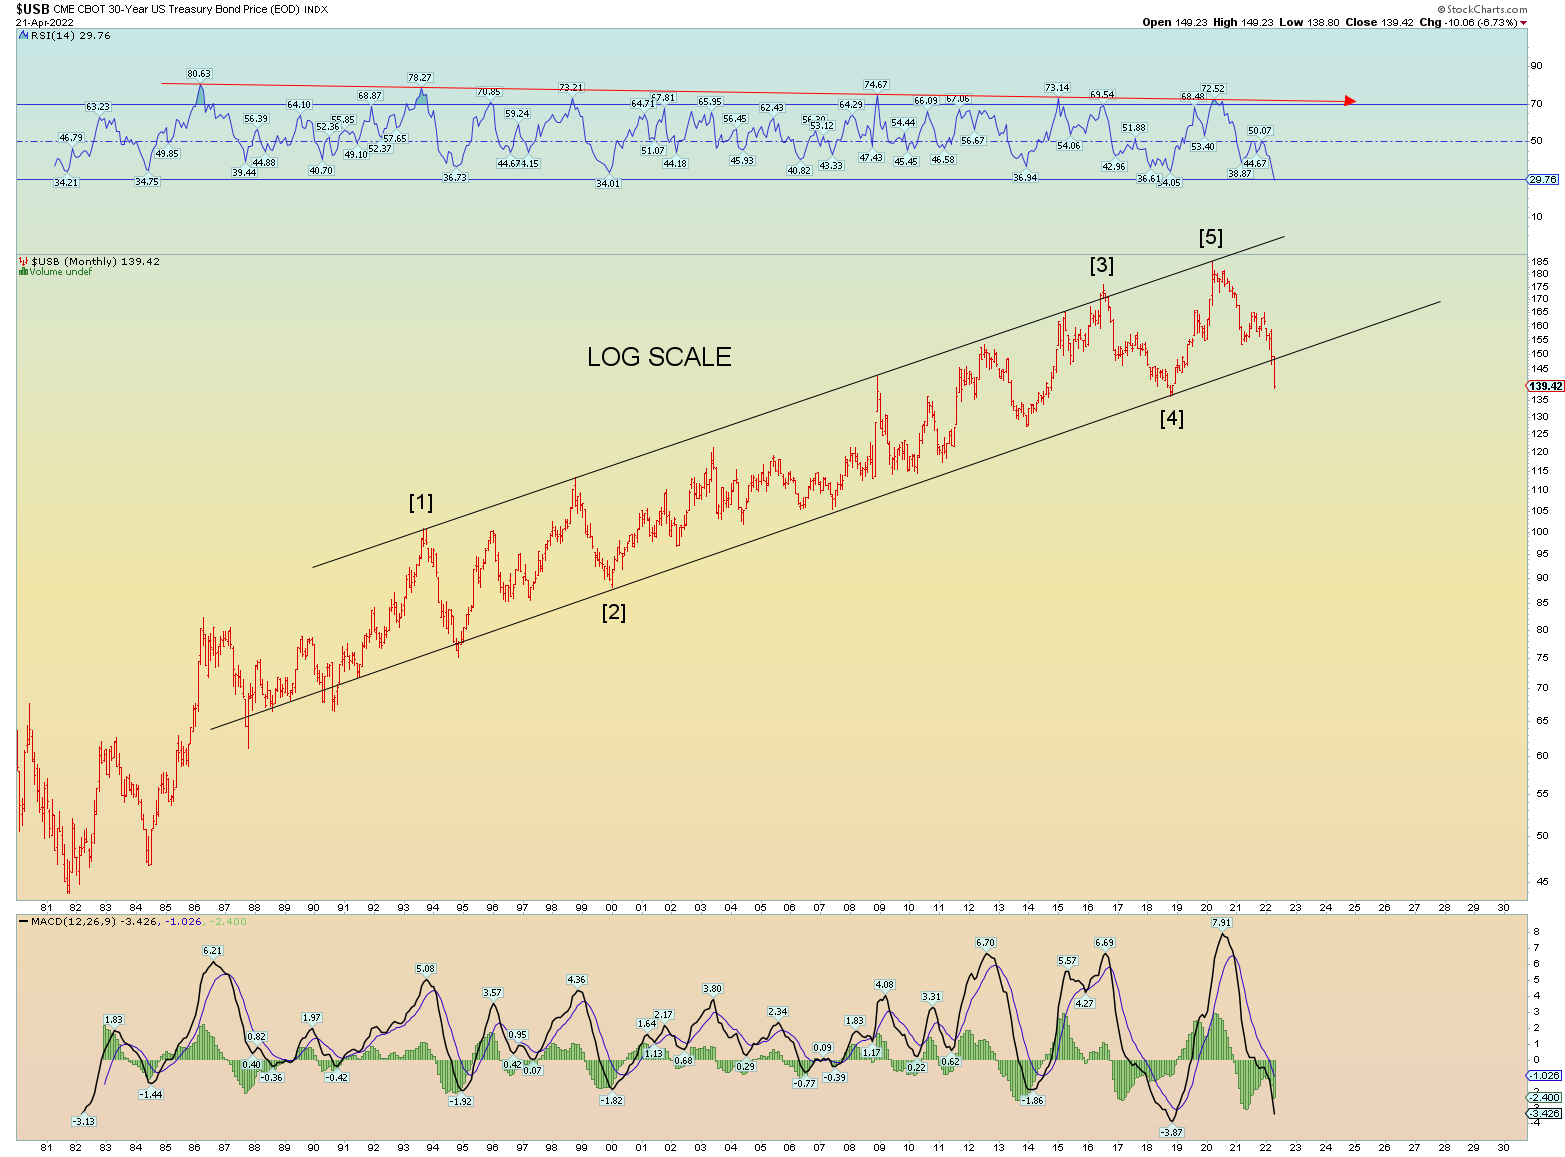
Prices have been supported not so much by horizontal price support but by long term channel line support. And now, after prices have twice tested that long term support, this is the 3rd time and prices seem to be slipping under.
A closer look:
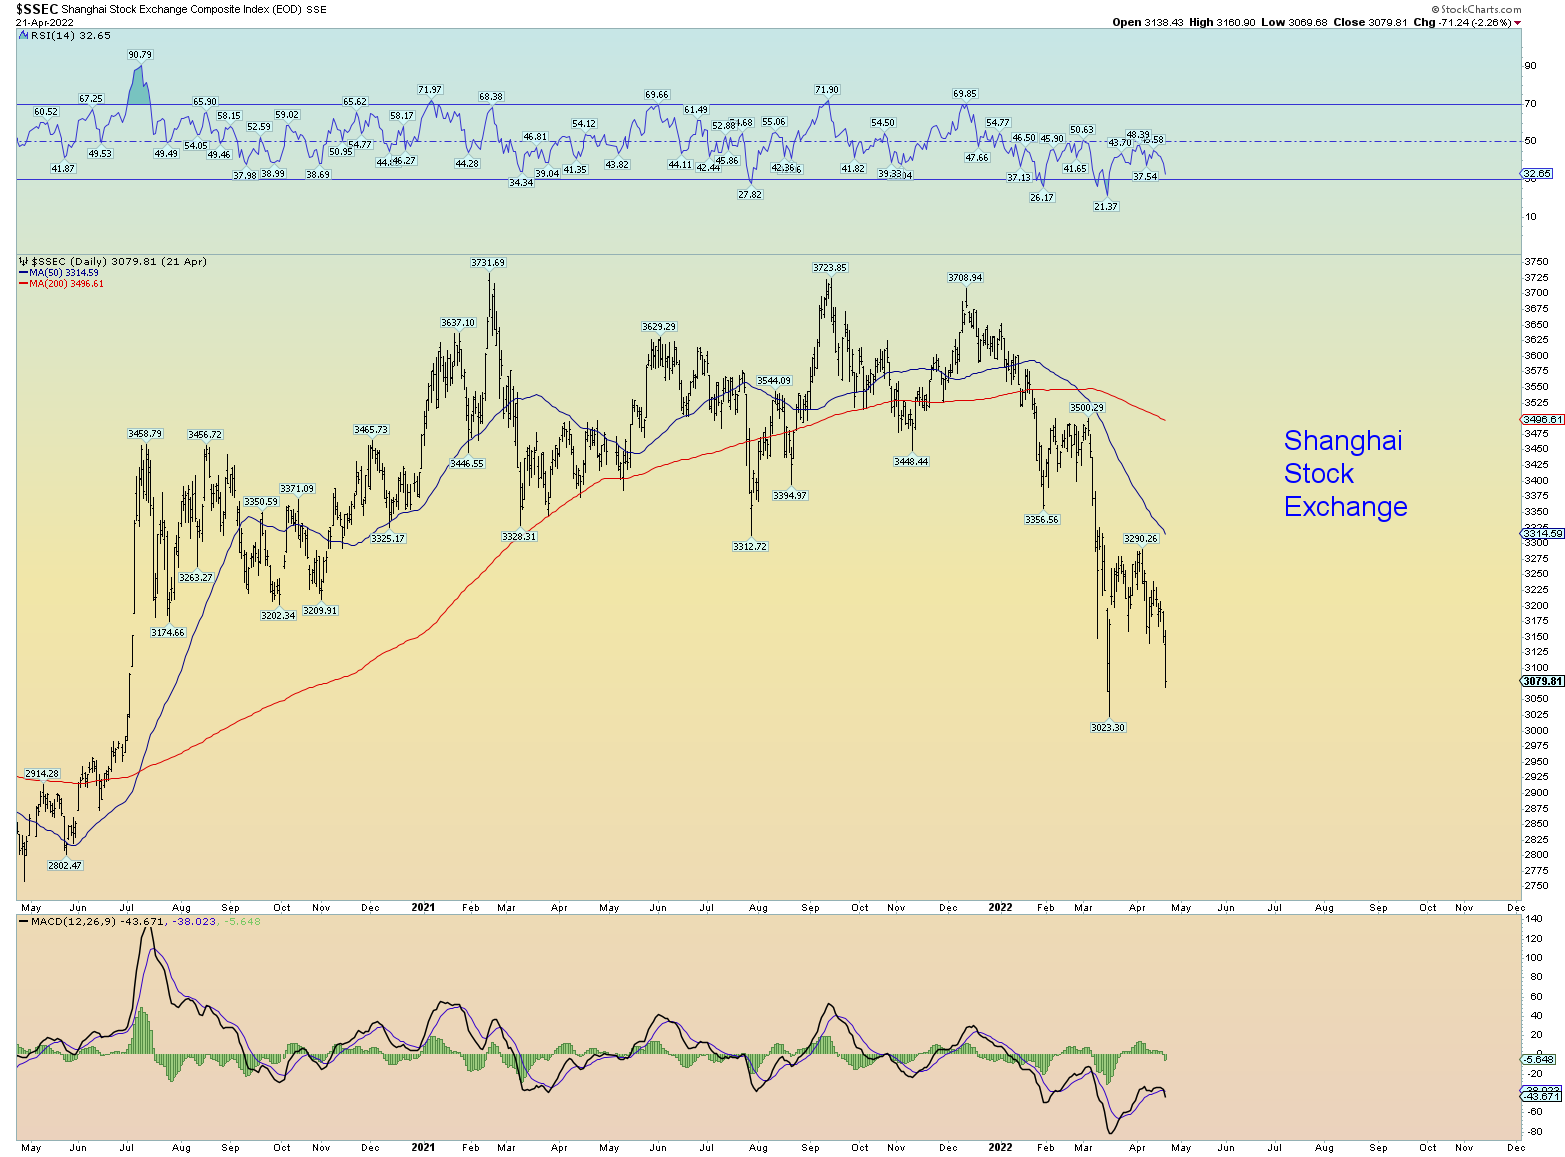
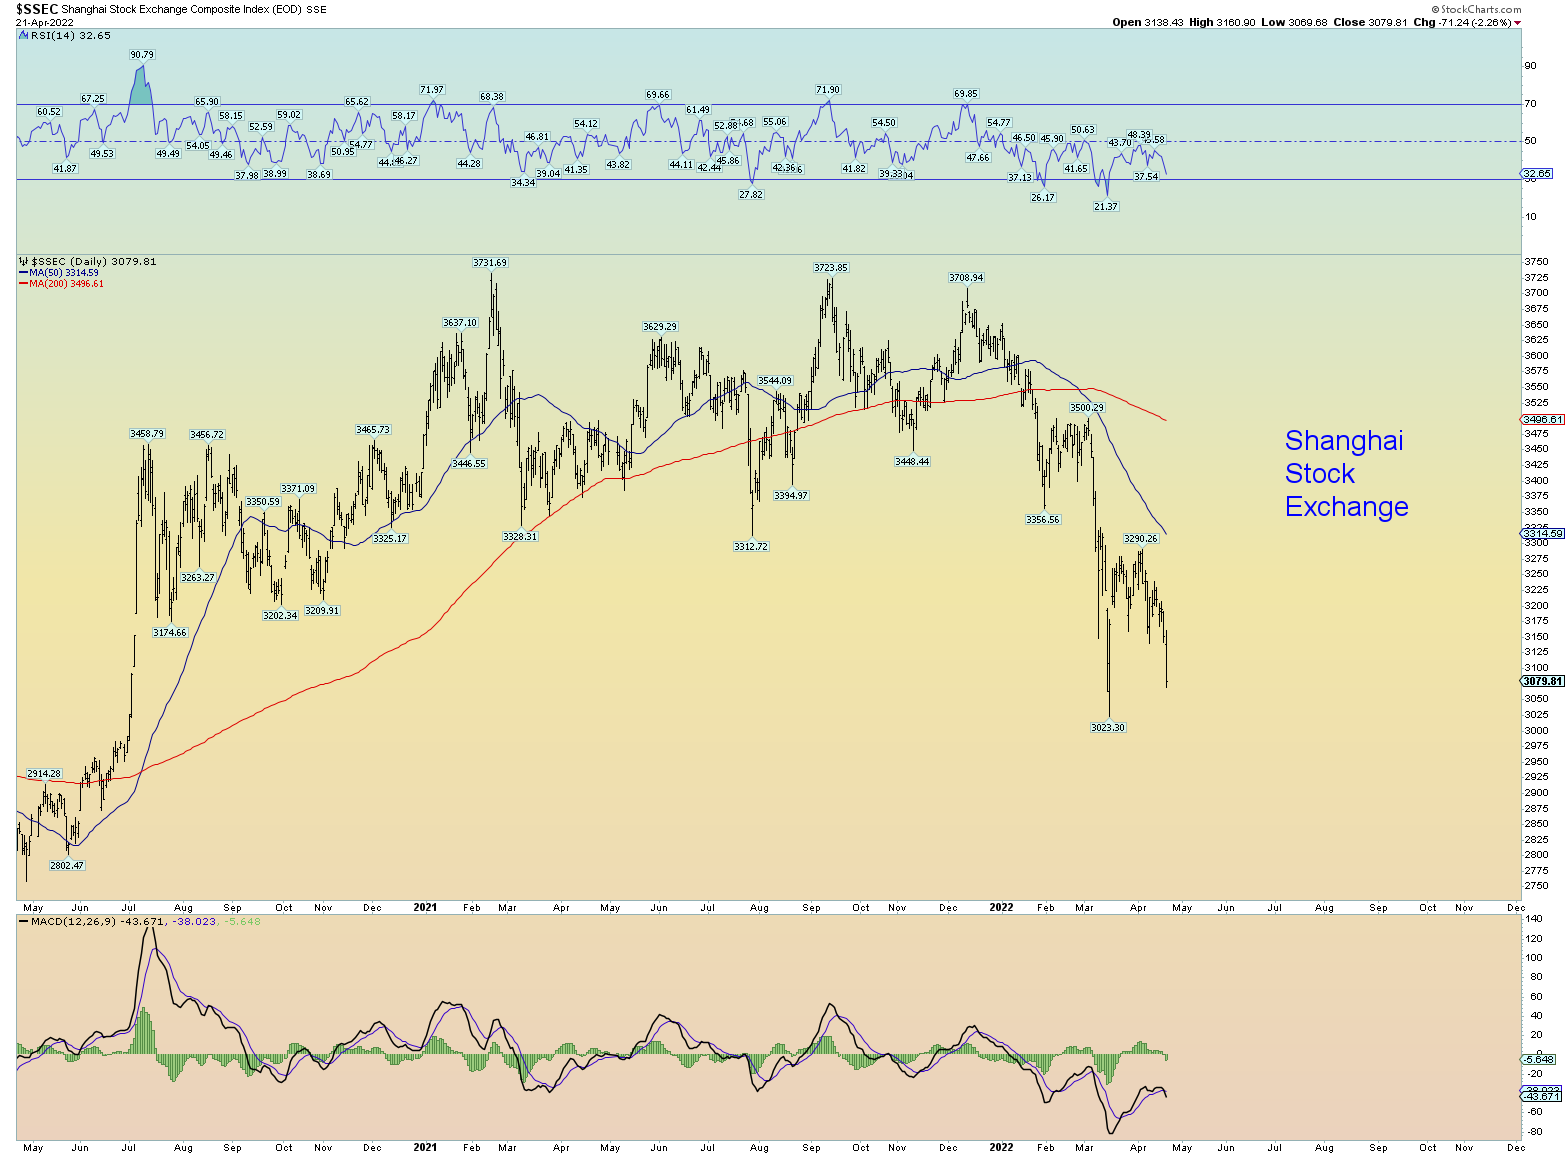
China in a bear market.
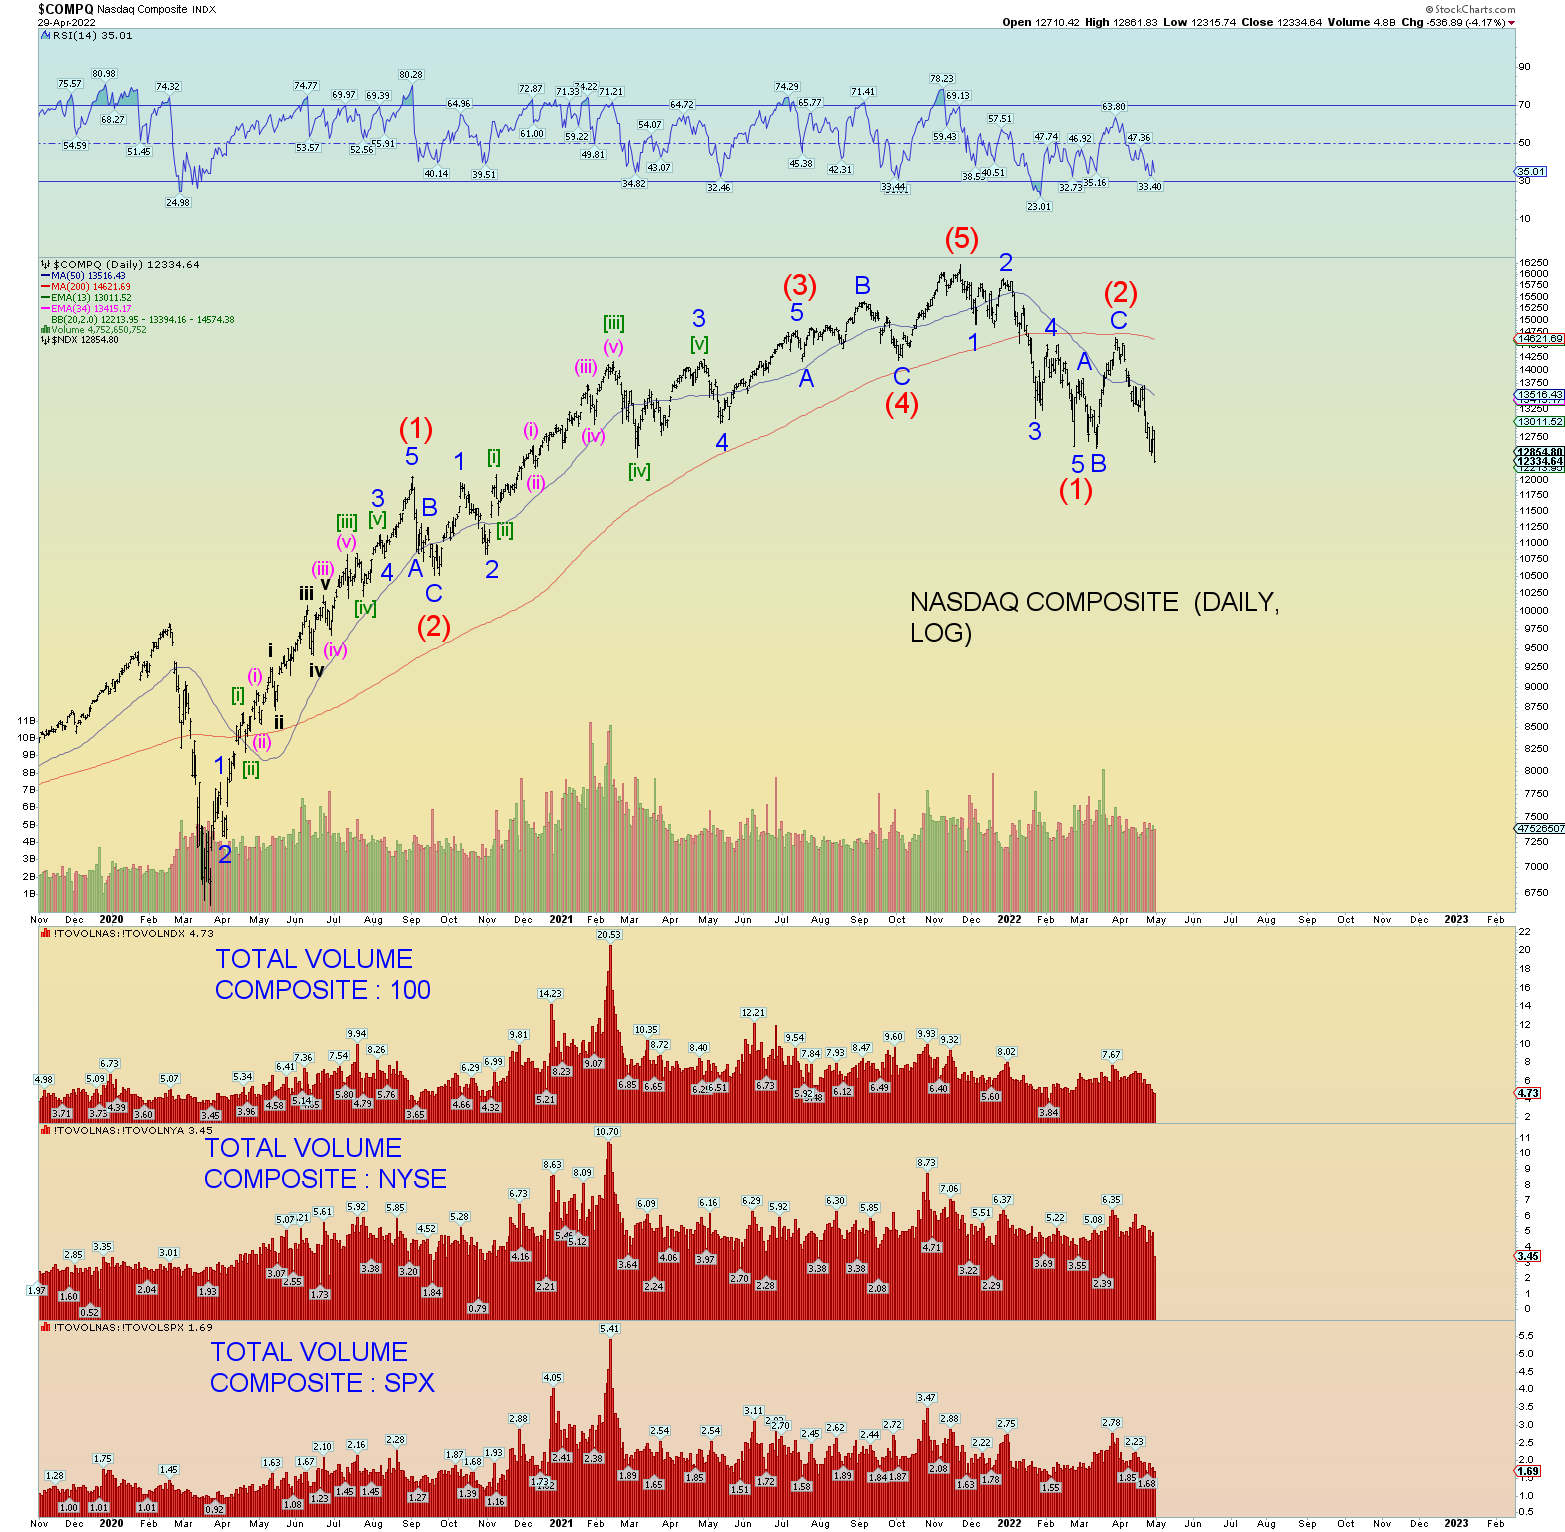
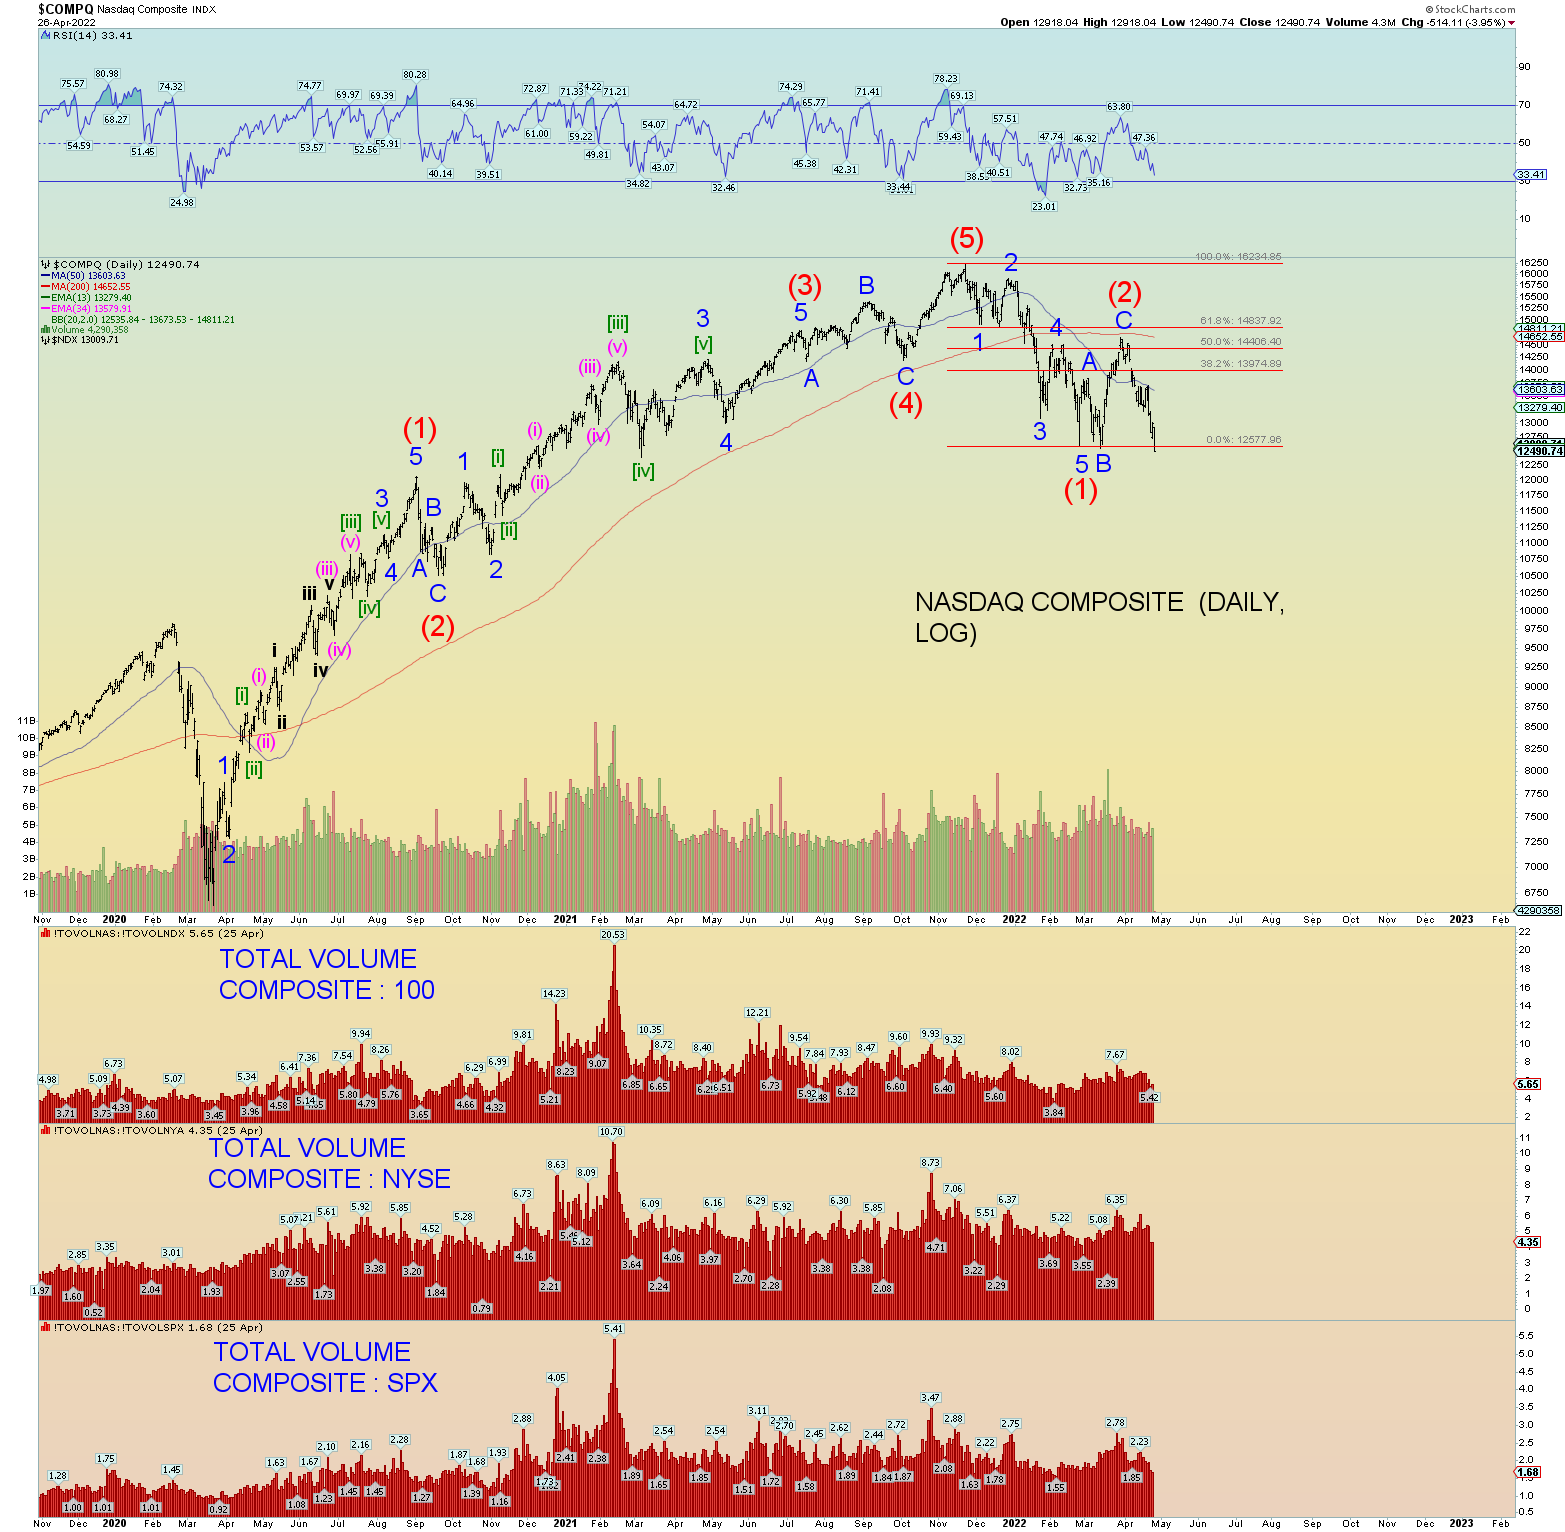
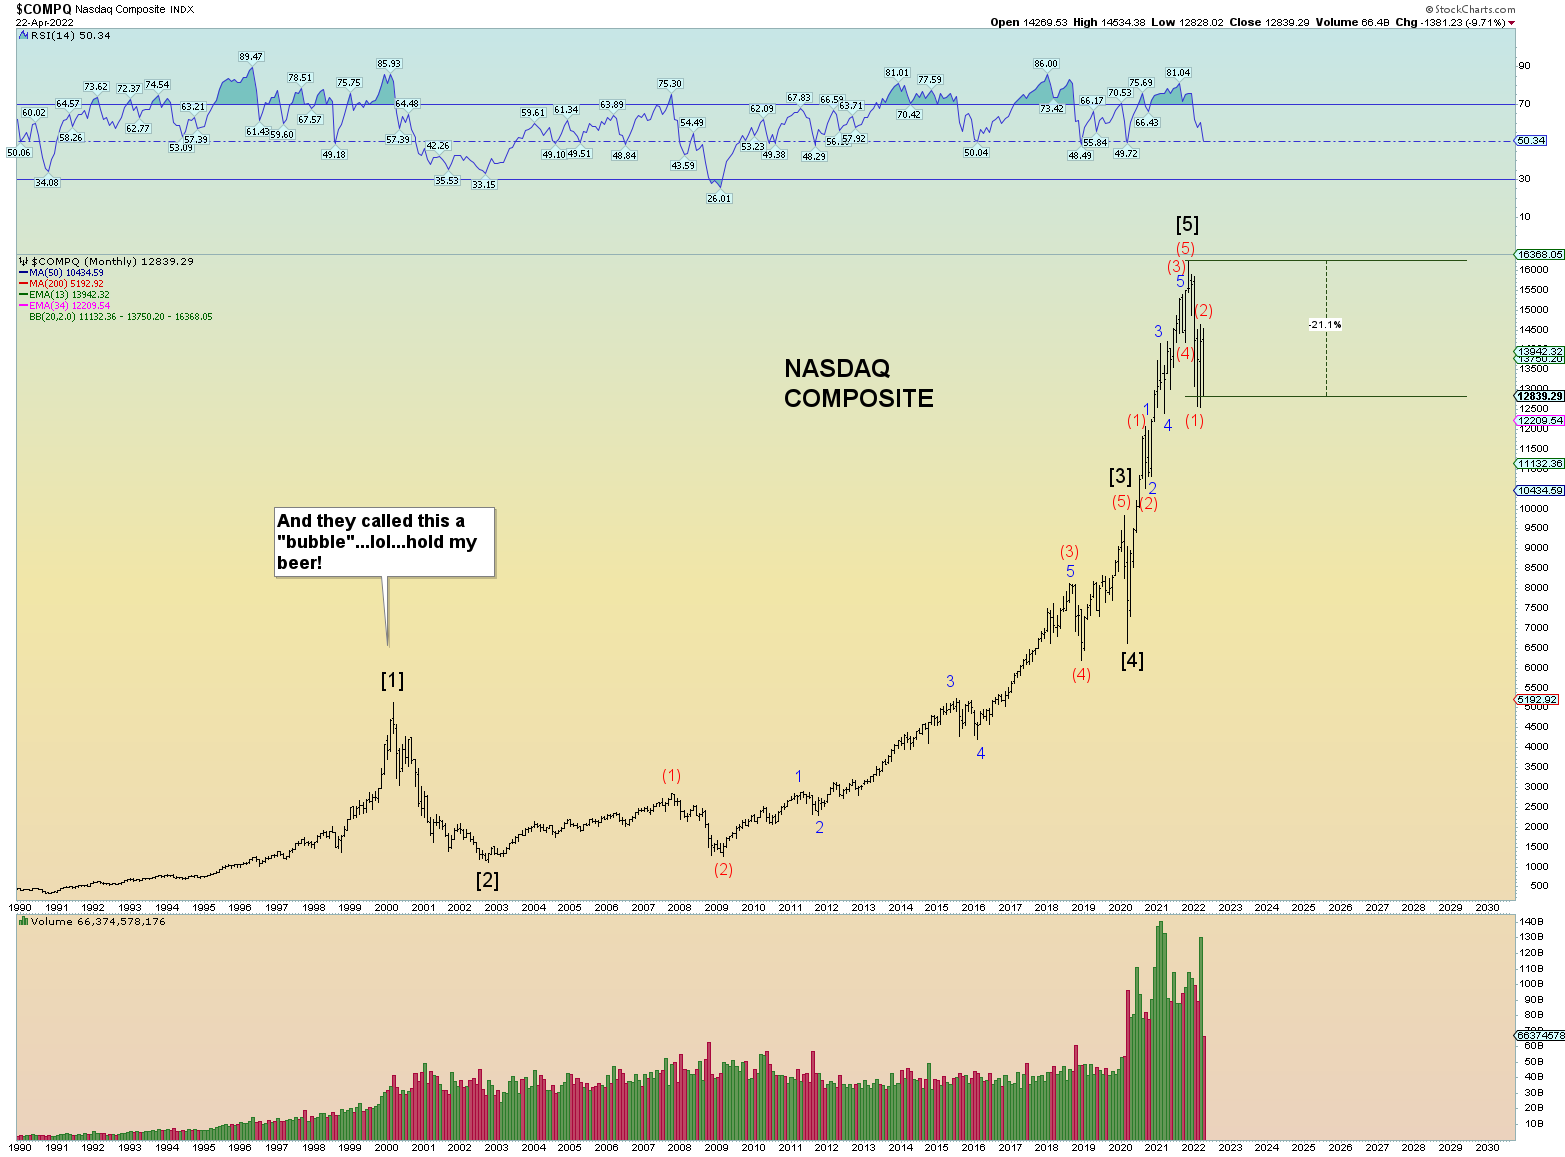
NASDAQ Composite monthly. 3 months in a row and prices finished lower today. Leading the way just like in 2000, 2008 and 2022.
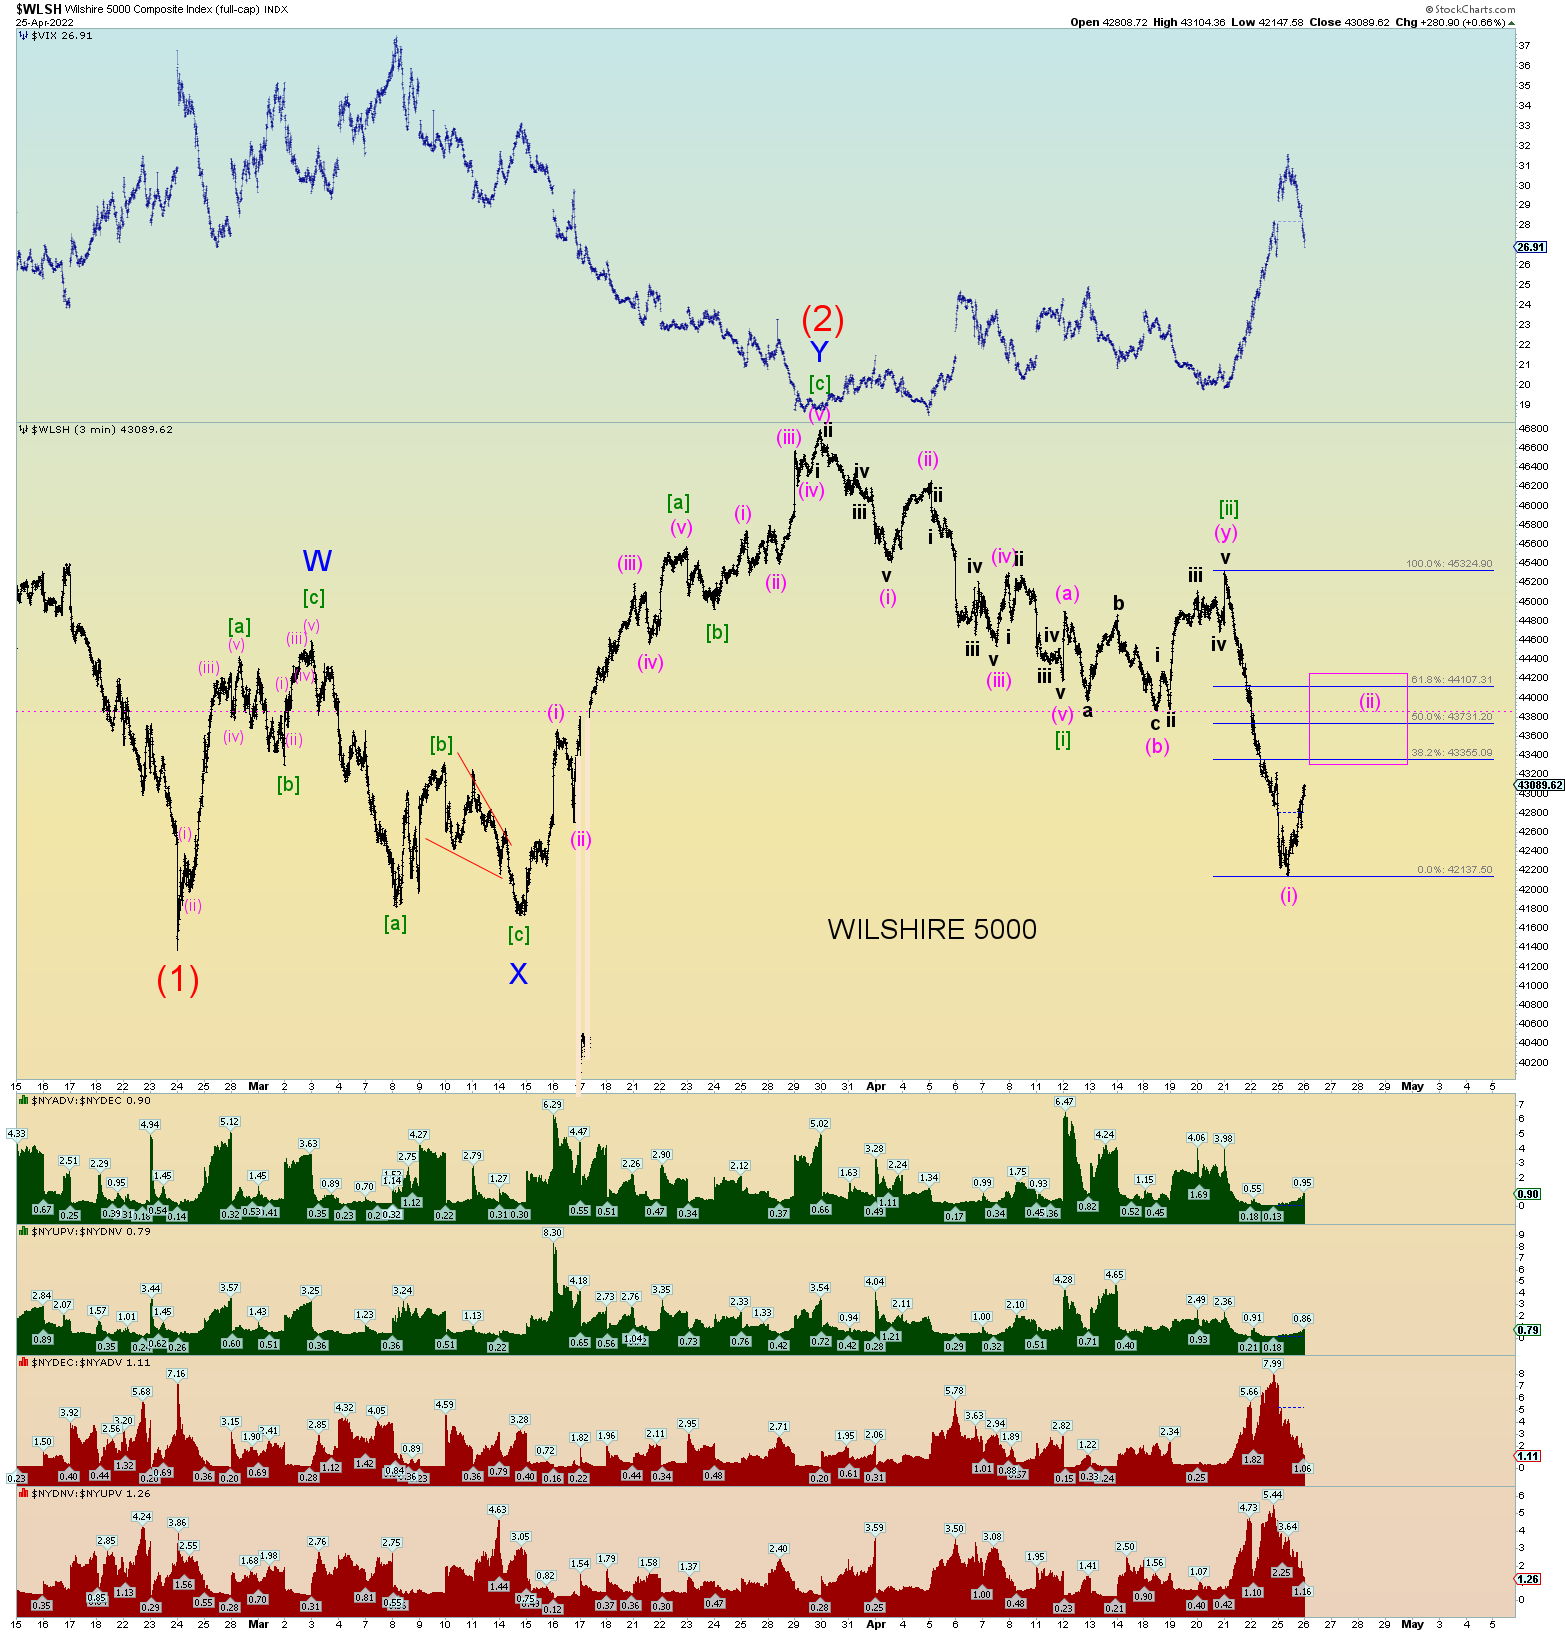
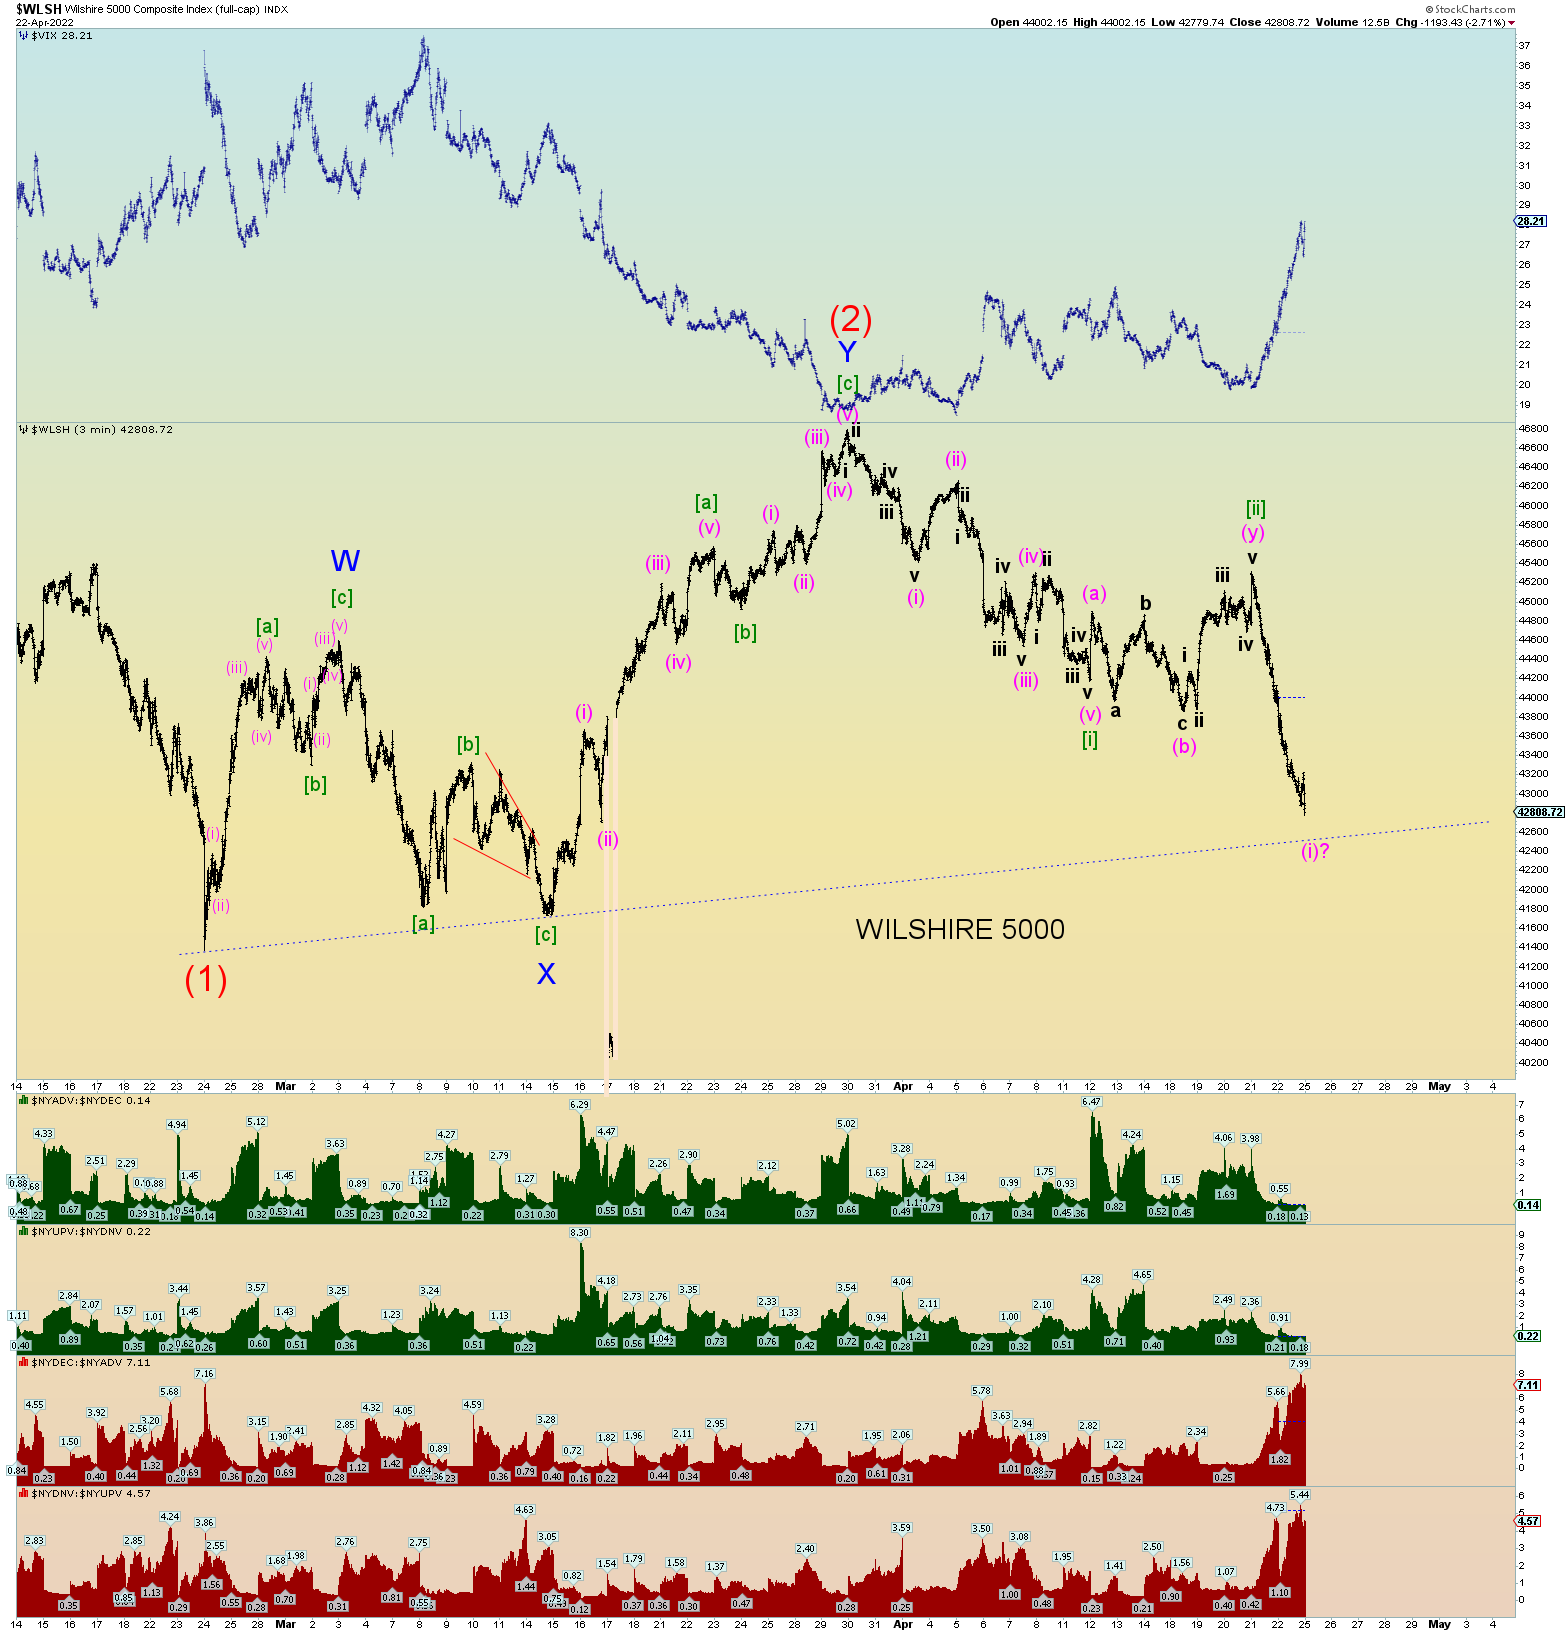
Best guess squiggle count below. There is room for a further bounce as denoted by the pink box for wave (ii). If so, it might take more than a few days, a final violent shake out of bears. Then after this, the trap door should open and we should get prices roaring under the previous price low of Intermediate wave (1).
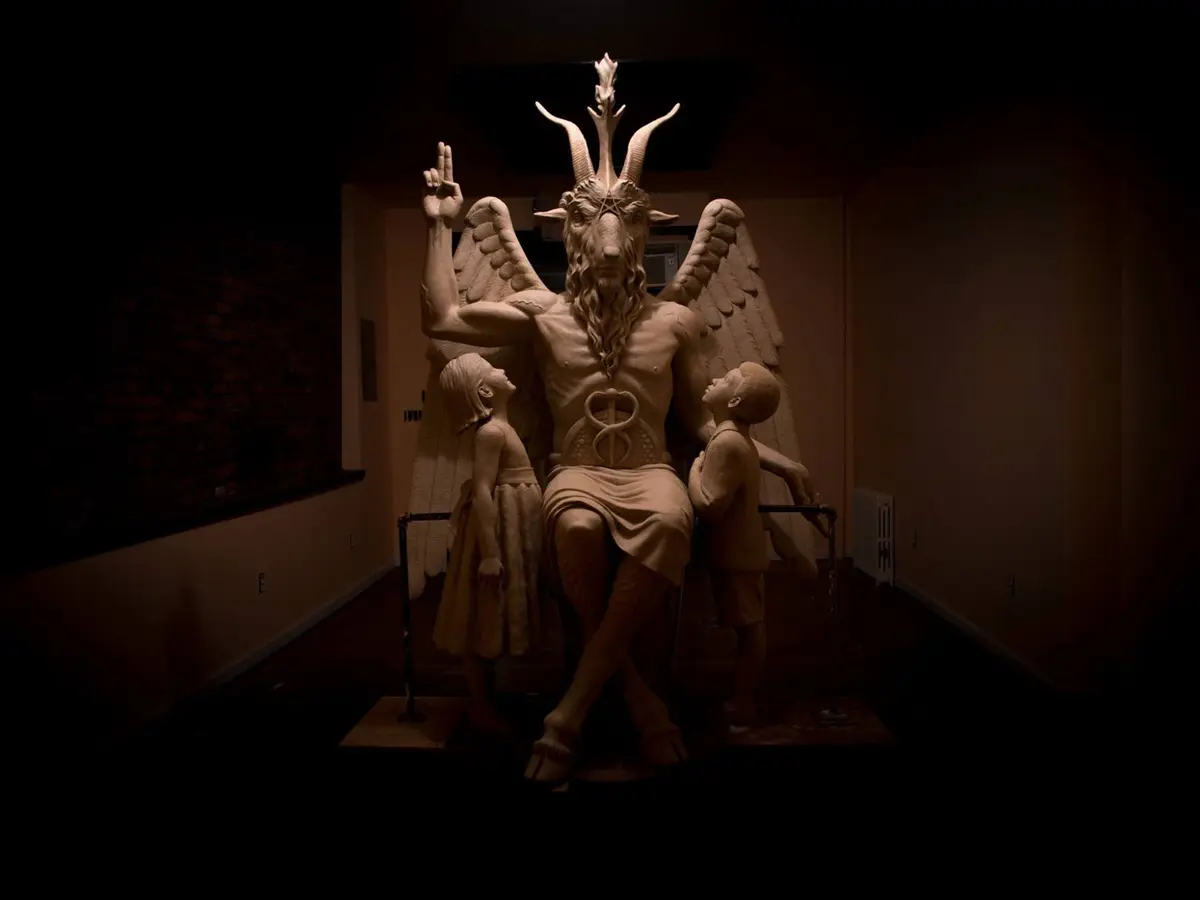
This picture of Zelensky is no accident. The horns of Baphomet are almost perfectly behind him. They are not quite because that would be too obvious. Additionally, there is a 5-pointed upside-down star (pentagram) in the hourglass of the symbol. Subtle, yet there.
And compare to this statue from the Satanic temple of Baphomet himself:
And if you still don’t get it here, I made it simpler.
Satan and his followers are always compelled to show what they have planned for us. It is the way secret societies operate; it is the way Satan operates; it is simply the rules. That’s why Bill Gates was compelled to tell us world population can be reduced through “vaccines” at that TED talk years ago. If you have time, you’ll come to see what I am saying if you watch this 5-hour documentary here about Freemasonry:
The odds of Zelensky being the real Antichrist just went up to 30%. At the very least, like the worldwide “vaccine” campaign being a foreshadow of the coming “mark of the beast” campaign, this picture of Zelensky is a foreshadow of the final Antichrist-type figure.
The bible teaches us that the Antichrist is a “little horn” that arises not from the 10 global power kingdoms (nations), but from another nation. His goal is to subjugate 3 of those 10 kingdoms into submitting to the New World Order. Satan is behind the scenes trying to unite the 10 kingdoms into a final Babylon world empire #7. This is done through warfare and purposeful evil committed upon the world. And yes, do you not see that total global financial collapse is eventual part of that plan?
The final Antichrist is prophesized many times throughout the bible. One in particular is in the Book of Daniel, chapter 7:
7 After this I saw in the night visions, and behold a fourth beast, dreadful and terrible, and strong exceedingly; and it had great iron teeth: it devoured and brake in pieces, and stamped the residue with the feet of it: and it was diverse from all the beasts that were before it; and it had ten horns.
The fourth beast of this vision was the Roman empire. The 10 horns on this fourth beast in this vision are the 10 nations at the end times that need to be united to form the final global world empire (biblical Babylon empire #7). That final global empire is otherwise known to us as the New World Order. The 10 horns are the same 10 toes (mixed of iron and mirey clay) of the statue in another vision of Daniel. The 10 toes don’t “mix” well together. That is a prophecy that the world will unite in a final global kingdom however it will not be strong and is short lived. For Jesus comes back and destroys it all at Armageddon.
Another horn arises:
8 I considered the horns, and, behold, there came up among them another little horn, before whom there were three of the first horns plucked up by the roots: and, behold, in this horn were eyes like the eyes of man, and a mouth speaking great things.
There came up among the 10 horns – remember these are the 10 global power nations of the end times – another little horn. This little horn is not from the 10 global power nations dominating world politics at the end times. The “little horn” (the Antichrist) is being used by Satan to subjugate 3 nations that refuse to submit to the New World Order. That is the underlying teachings of bible symbolism in the Book of Daniel and Revelation.
That there will be a “little horn” – someone like a Zelensky – “speaking great things” (promoted by the Jewish controlled mass media) used to defeat the three world powers that refuse to submit to the NWO. In this case it seems Russia is target #1 who refuses to submit. Does this mean Zelensky and Ukraine wins? No, but the goal is regime change in Russia. To eject Putin and put in place someone (like Boris Yeltsin under Papa Bush) that WILL submit Russia to the New Order.
So even if this is not yet the final 7 years of the 70th week of Daniel, it is a foreshadow of something that is coming. Zelensky may not actually be the real Antichrist, yet he certainly fits the profile “speaking great things” and viewed as a “great warrior”. Certainly, he has garnered support from Christians and Jews and Atheists alike which is the goal at this opening stage.
Does this automatically make me a Putin supporter as if he is some kind of righteous person? No of course not. It is one devil fighting another as it has always been. Yet if Russia is forced into regime change and a western-friendly leader arises, that will have been the goal all along. 1 nation of 3 that is defeated and subjugated by the “little horn”.
Again, like I say about the “vaccine” campaign, it is NOT the mark of the beast. Yet it DOES foreshadow what is coming. Zelensky may well NOT be the real Antichrist, but this entire manufactured war against Russia IS a foreshadow of how things will go down at the final 7 years. You may even find yourself promoting Zelensky as a “hero”. Whatever. The propaganda has even churches putting this guy’s picture up on their screens in front of the assemblies promoting what a brave and noble hero he is. Mission accomplished by Satan, tricking Christians into supporting the coming wars of the NWO.
All I see is that Zelensky wants Putin dead and Russia crippled. He is either a pawn of Satan or the real-deal Antichrist. And the United States is the Babylonian “city-nation” leading the effort to unite this New World Order empire that will eventually be ruled by the Antichrist for 42 months.
Eventually the real Antichrist will be “wounded to death”. He will die and go to literal hell. Revelation chapter 13 teaches us this:
3 And I saw one of his heads as it were wounded to death; and his deadly wound was healed: and all the world wondered after the beast.
The real Antichrist will die and go to Perdition (hell). And will be raised from the dead, probably 3 days later in an imitation of what Jesus did. My belief is that the person coming back from hell will be the chief prince devil underling of Satan. And that supernatural things will happen.
4 And they worshipped the dragon which gave power unto the beast: and they worshipped the beast, saying, Who is like unto the beast? who is able to make war with him?
The Antichrist is viewed as a warrior and speaking great things. And yes, he will get to rule his short-lived world empire Babylonian “kingdom” for 42 months during the Wrath of God period of the 7 trumpet and vial judgments of God.
5 And there was given unto him a mouth speaking great things and blasphemies; and power was given unto him to continue forty and two months.
And the Jewish-controlled mass media will promote him worldwide as will the False Prophet. But ultimately the Antichrist takes power over the, now united, New World Order. Promising peace and “solutions” to the mass death and famine that has been taking place over the previous 3 1/2 years.
6 And he opened his mouth in blasphemy against God, to blaspheme his name, and his tabernacle, and them that dwell in heaven.
Verse 6 is the “Abominations of Desolations”. This is where he goes into a Temple and desecrates it and sets up a graven image and it will be demanded that all worship it and take the mark of the beast
Does it have to be a “Jewish” temple? NO! There are no “holy” temples of God other than bible-believing churches. I propose the Antichrist will go into the Dome of the Rock temple already in place for over 1000 years. He will be allowed because by this stage all the world’s religions will have been united. Judaism, Islam, Buddhism, Hinduism, Atheism, and Apostate Christianity.
Only bible-believing Christians will be unable to participate. For the entire purpose of the mark of the beast is to find and kill Christians the only people left with the power to defeat Satan! And who will we be delivered up to? The synagogues and temples of this world. In America, that would mean your local Freemason lodge with a Star of Remphan, oops I mean Star of David, on top.
7 And it was given unto him to make war with the saints, and to overcome them: and power was given him over all kindreds, and tongues, and nations.
Once the Antichrist takes power, he makes war with Jesus-believing Christians. And he does win over the flesh in the end. This is why Jesus comes and raptures us in great power and glory about 70 days after the Antichrist takes power or “no flesh be saved”.
8 And all that dwell upon the earth shall worship him, whose names are not written in the book of life of the Lamb slain from the foundation of the world.
9 If any man have an ear, let him hear.
Verses 8 and 9 remind the reader to hear what Jesus is saying. That the reprobate unbelievers that take the mark of the beast are damned for all eternity.
The only way to escape eternal damnation is through Jesus our Lord and Savior.
This is why I laugh anymore at all the expended futile efforts of anyone putting their faith in politicians or anything of this world. As if any of it matters. The only thing that matters is that we do the work of our Lord Jesus Christ and spread the Gospel to get people saved so they will avoid hell. To get as many people saved as possible for, we are nearing the end of days.
God the Father wants as many people as possible to be saved and time is running out. At some point the door will be shut and the unsaved populations of the earth will be judged and punished. All that is required to be saved to avoid the wrath of the Father is to believe on his Son, the name above all, Jesus Christ.
Just call on the name of the Lord, Jesus Christ, believe and trust, and you shall be saved.
Today was a solid follow-up to yesterday’s steady selling. SPX lost 4300 after losing 4500 and 4400 yesterday. The wave count matches the predicted selling intensity of a wave (3) just beginning its initial fury perhaps. If this is a “kickoff” of Intermediate wave (3) down, then at the coming worst spots of wave (3) the selling intensity will likely be above some of the days that occurred in the 2020 downdraft.
Technically speaking and sentiment-wise, there is nothing for the bulls to hang their hat on and say with confidence that this was just a 2-day dip. Selling intensity was highest today since the November peak occurred. Of course, we’ll have big bounces but that’s why we count waves.
Can you imagine the entire world aligned in extreme negative social mood? In addition to all the biblical end times signs I have been blogging about, the wave structures suggest a coming great collective negative social mood.
The Composite closed back into a bear market this week.
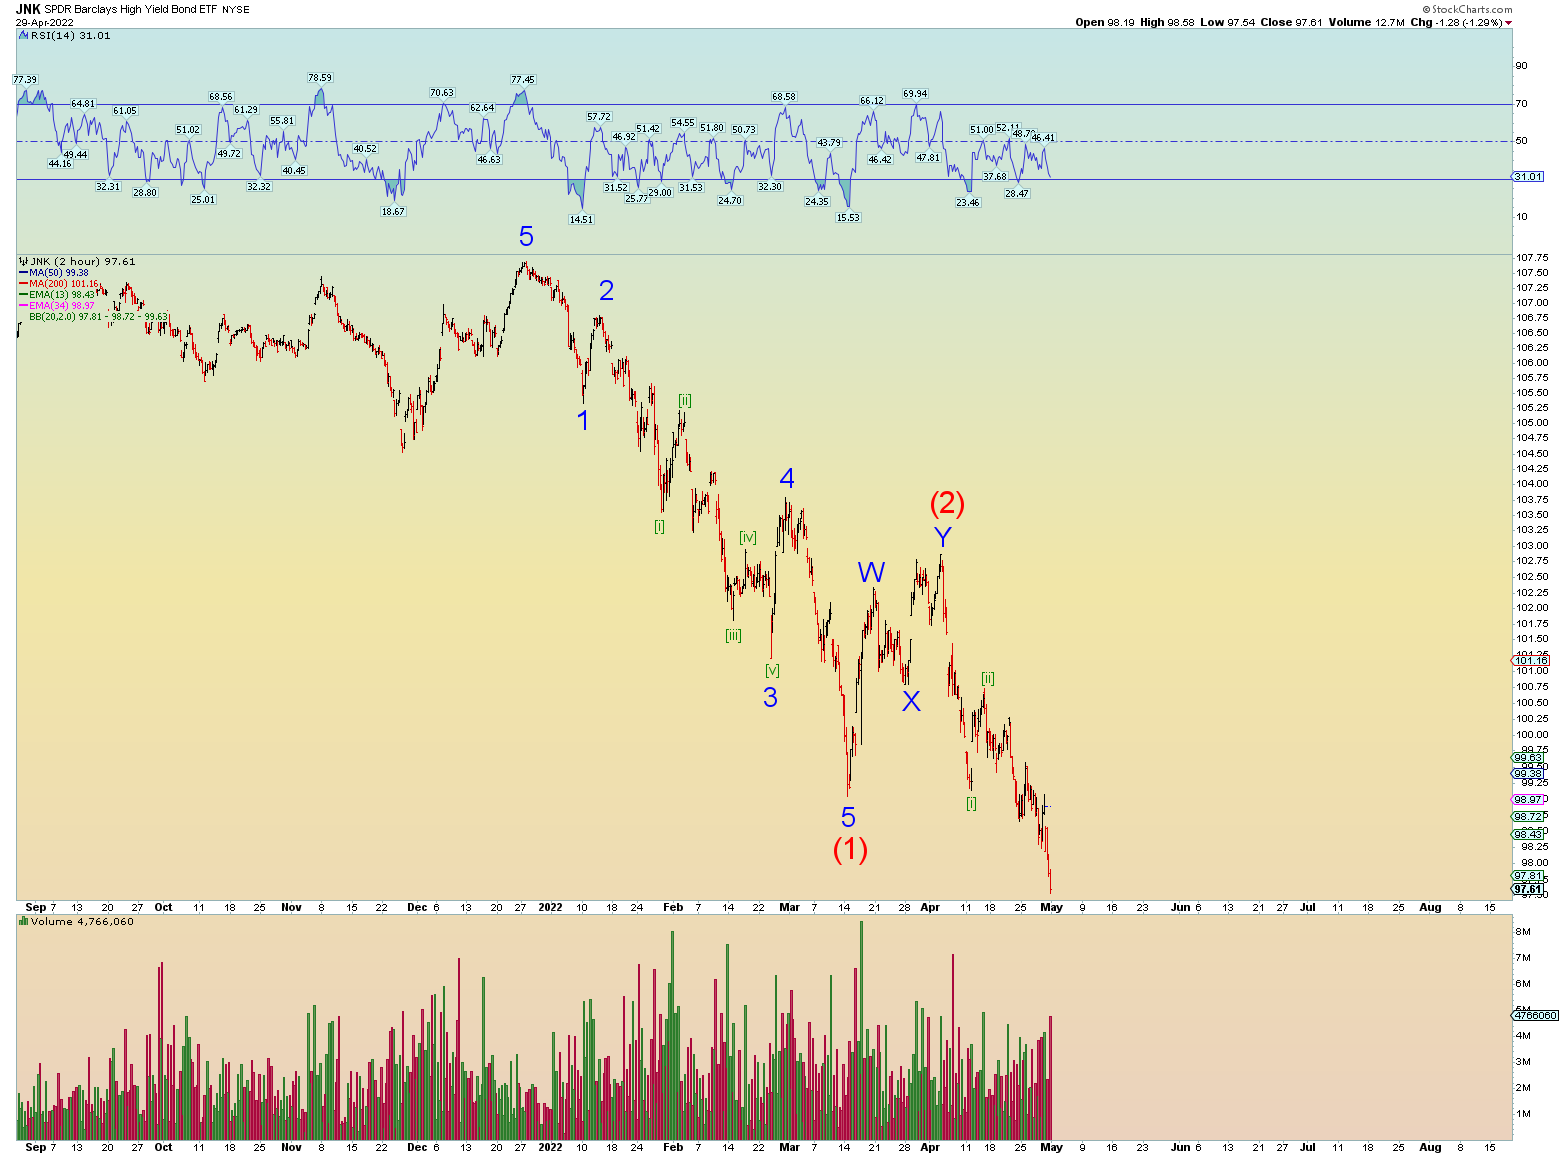
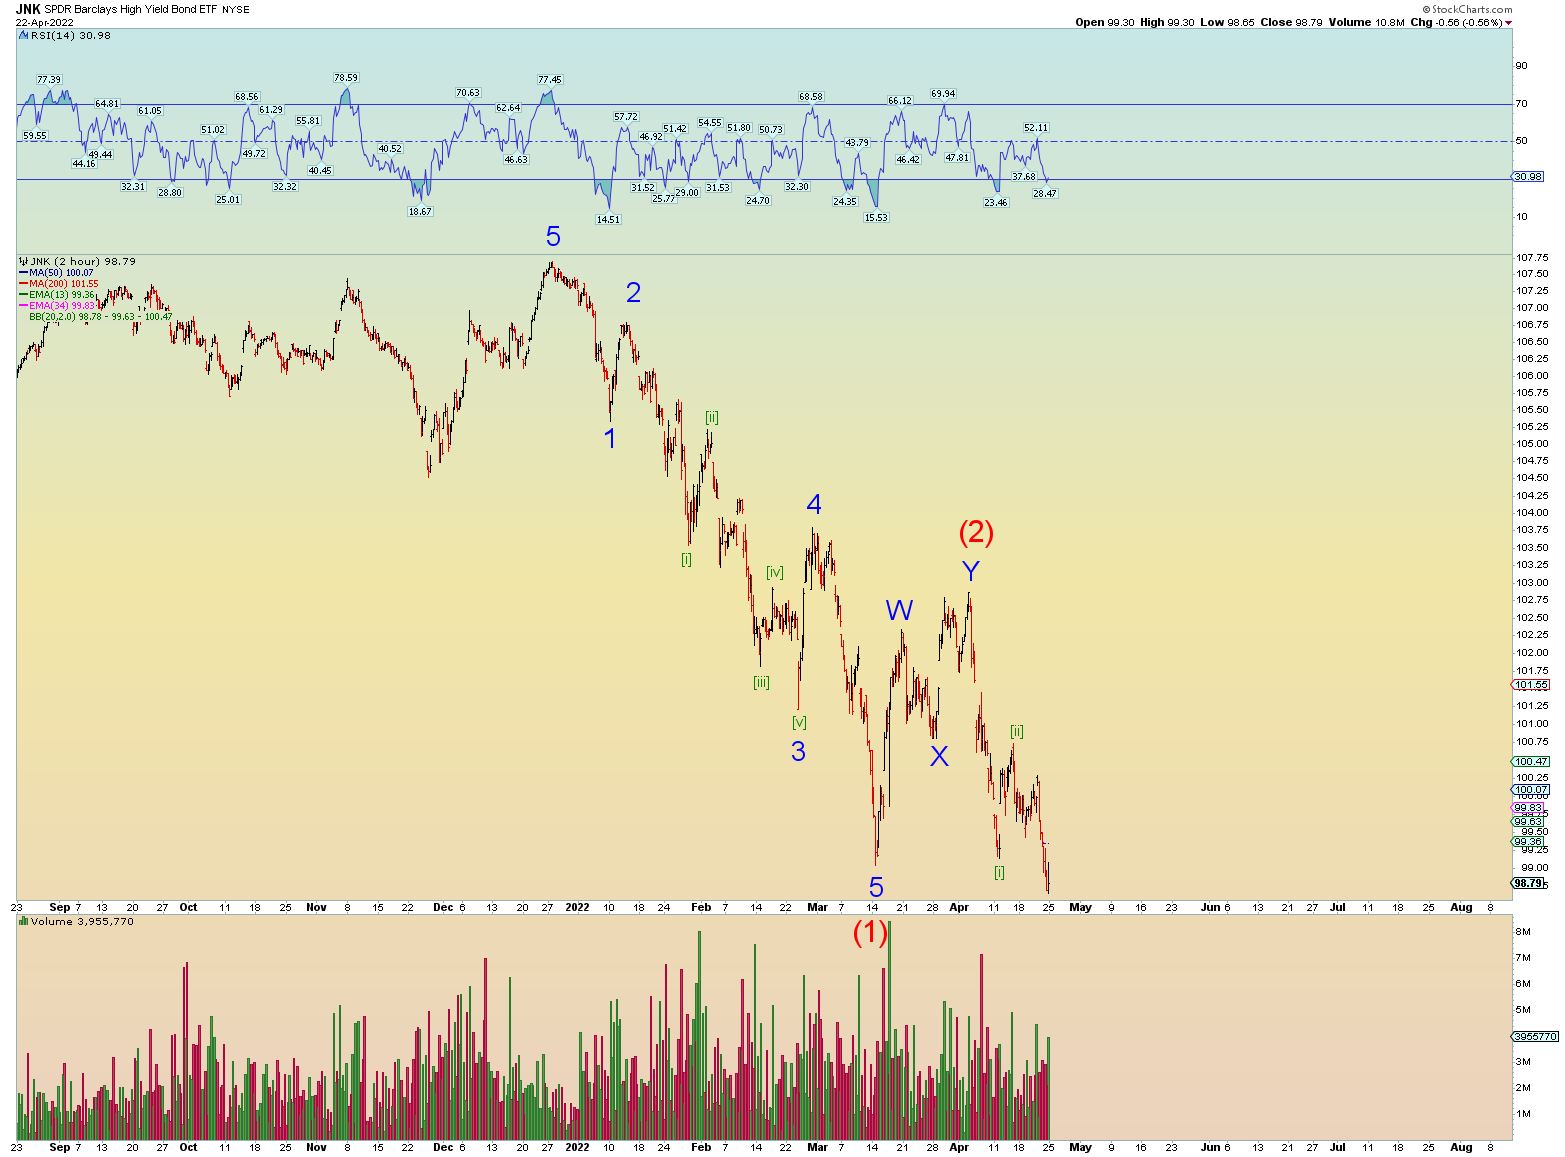
Junk debt broke lower today closing under its wave (1) low, a foreshadow perhaps of where the market overall is heading. A rapidly rising rate environment and trillions upon trillions of worthless paper promises make up the abominable global Ponzi scheme. You can’t cheat God forever.
Payment is coming due. Payment for the stolen money from future generations. Payment for killing 50 million babies. Payment for the promotion of wickedness in high places and low. It’s all coming due. And it will be paid for double in blood.
50 million times double = 100 million is only a down payment just for the dead babies we sacrificed to Moloch. And that is just in America….
The Lord is a terrible and dreadful God. I may be saved, but when Jesus comes in the clouds with all power and great glory with a long, loud, blasting trumpet sound and great celestial skyshows and earthquakes, even I’ll probably be crapping in my pants, and I want him to come because I’m saved.
Revelation Chapter 6 describes the events that will occur with the coming of the Lord:
12 And I beheld when he had opened the sixth seal, and, lo, there was a great earthquake; and the sun became black as sackcloth of hair, and the moon became as blood;
13 And the stars of heaven fell unto the earth, even as a fig tree casteth her untimely figs, when she is shaken of a mighty wind.
14 And the heaven departed as a scroll when it is rolled together; and every mountain and island were moved out of their places.
15 And the kings of the earth, and the great men, and the rich men, and the chief captains, and the mighty men, and every bondman, and every free man, hid themselves in the dens and in the rocks of the mountains;
16 And said to the mountains and rocks, Fall on us, and hide us from the face of him that sitteth on the throne, and from the wrath of the Lamb:
17 For the great day of his wrath is come; and who shall be able to stand?
It is not too late to get right with Jesus. It’s a simple free gift of grace. And once given, it will never be taken back (it’s a gift remember!) Just believe on the Lord Jesus, that he died for our sins and was resurrected 3 days later and you shall be saved. God didn’t make it hard for us. Romans 10:
Sooner or later, Russia’s pipelines will be sabotaged. It is a surreal situation. Europe is shipping weapons to Ukrainians to kill Russians yet buy their gas from them. At some point it would be logical to blow up the pipelines. It wouldn’t be hard. I imagine that is being planned for and the “green light” hasn’t yet been given. But it is coming.
As I have been saying over the last several posts the whole point of this war is to effect regime change (Putin) in Russia because Babylon USA requires it to assemble the New World Order. Putin is resisting the NWO. That doesn’t make him “righteous”, it just makes him the target of the Western powers who are already clearly under the control of Satan. Biden looks already possessed by a devil as does Kameltoe Harris and Jenny P. All the Western leaders are in bed with the devil. They say Satan has a permanent seat at the house of Rothschild in the U.K. Boris Johnson is of the devil also. As is all the Western leaders.
Zelensky is the puppet put into place to carry it out. The US regime does not give a squat about the Ukrainians. They are being used for the purpose of Satan. And that purpose is to assemble the final kingdom of the earth to bring in his fake Messiah and take over the earth.
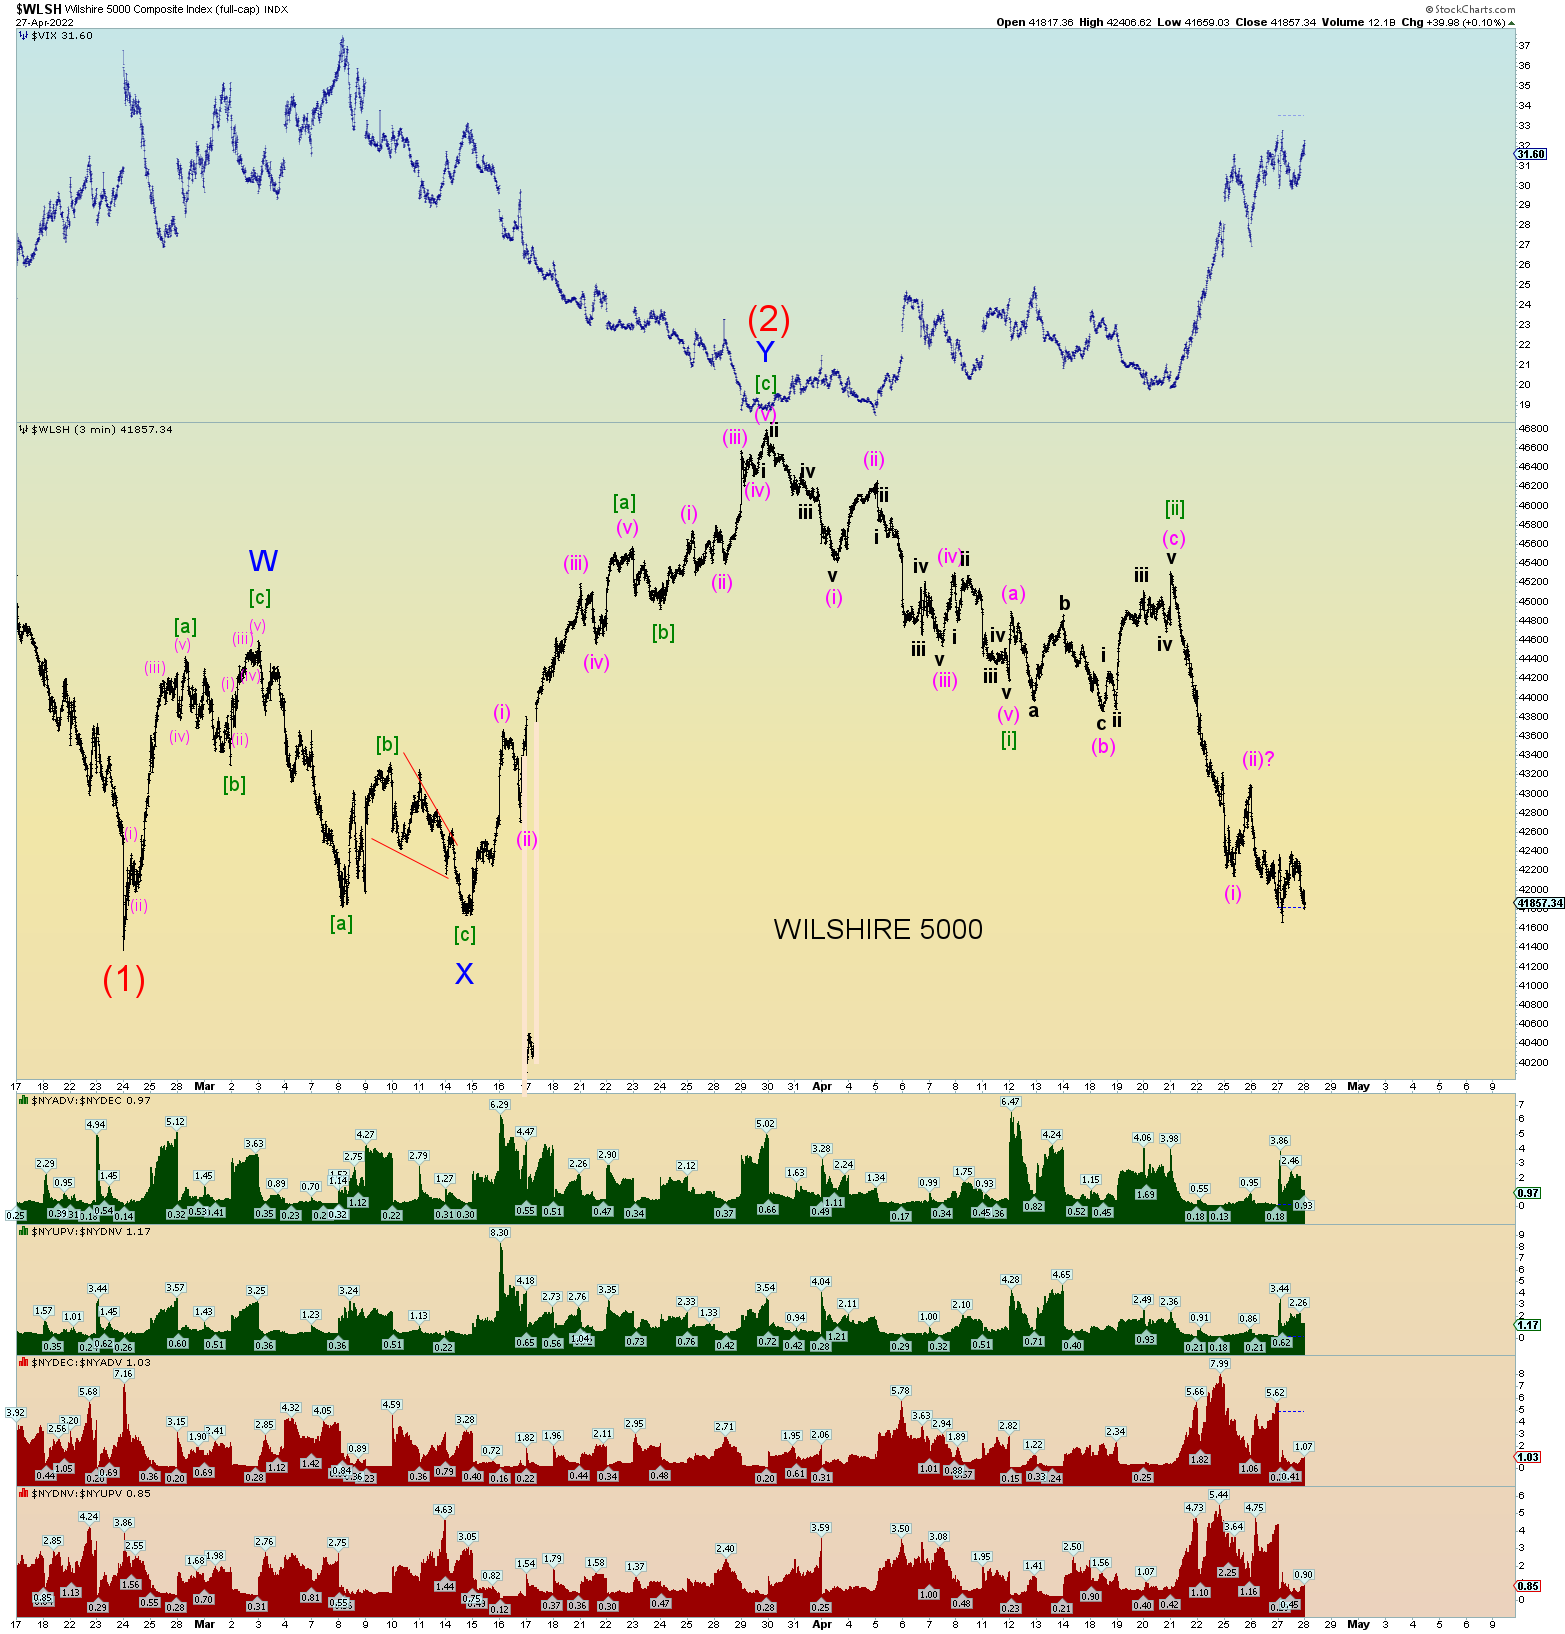
THE COUNTS
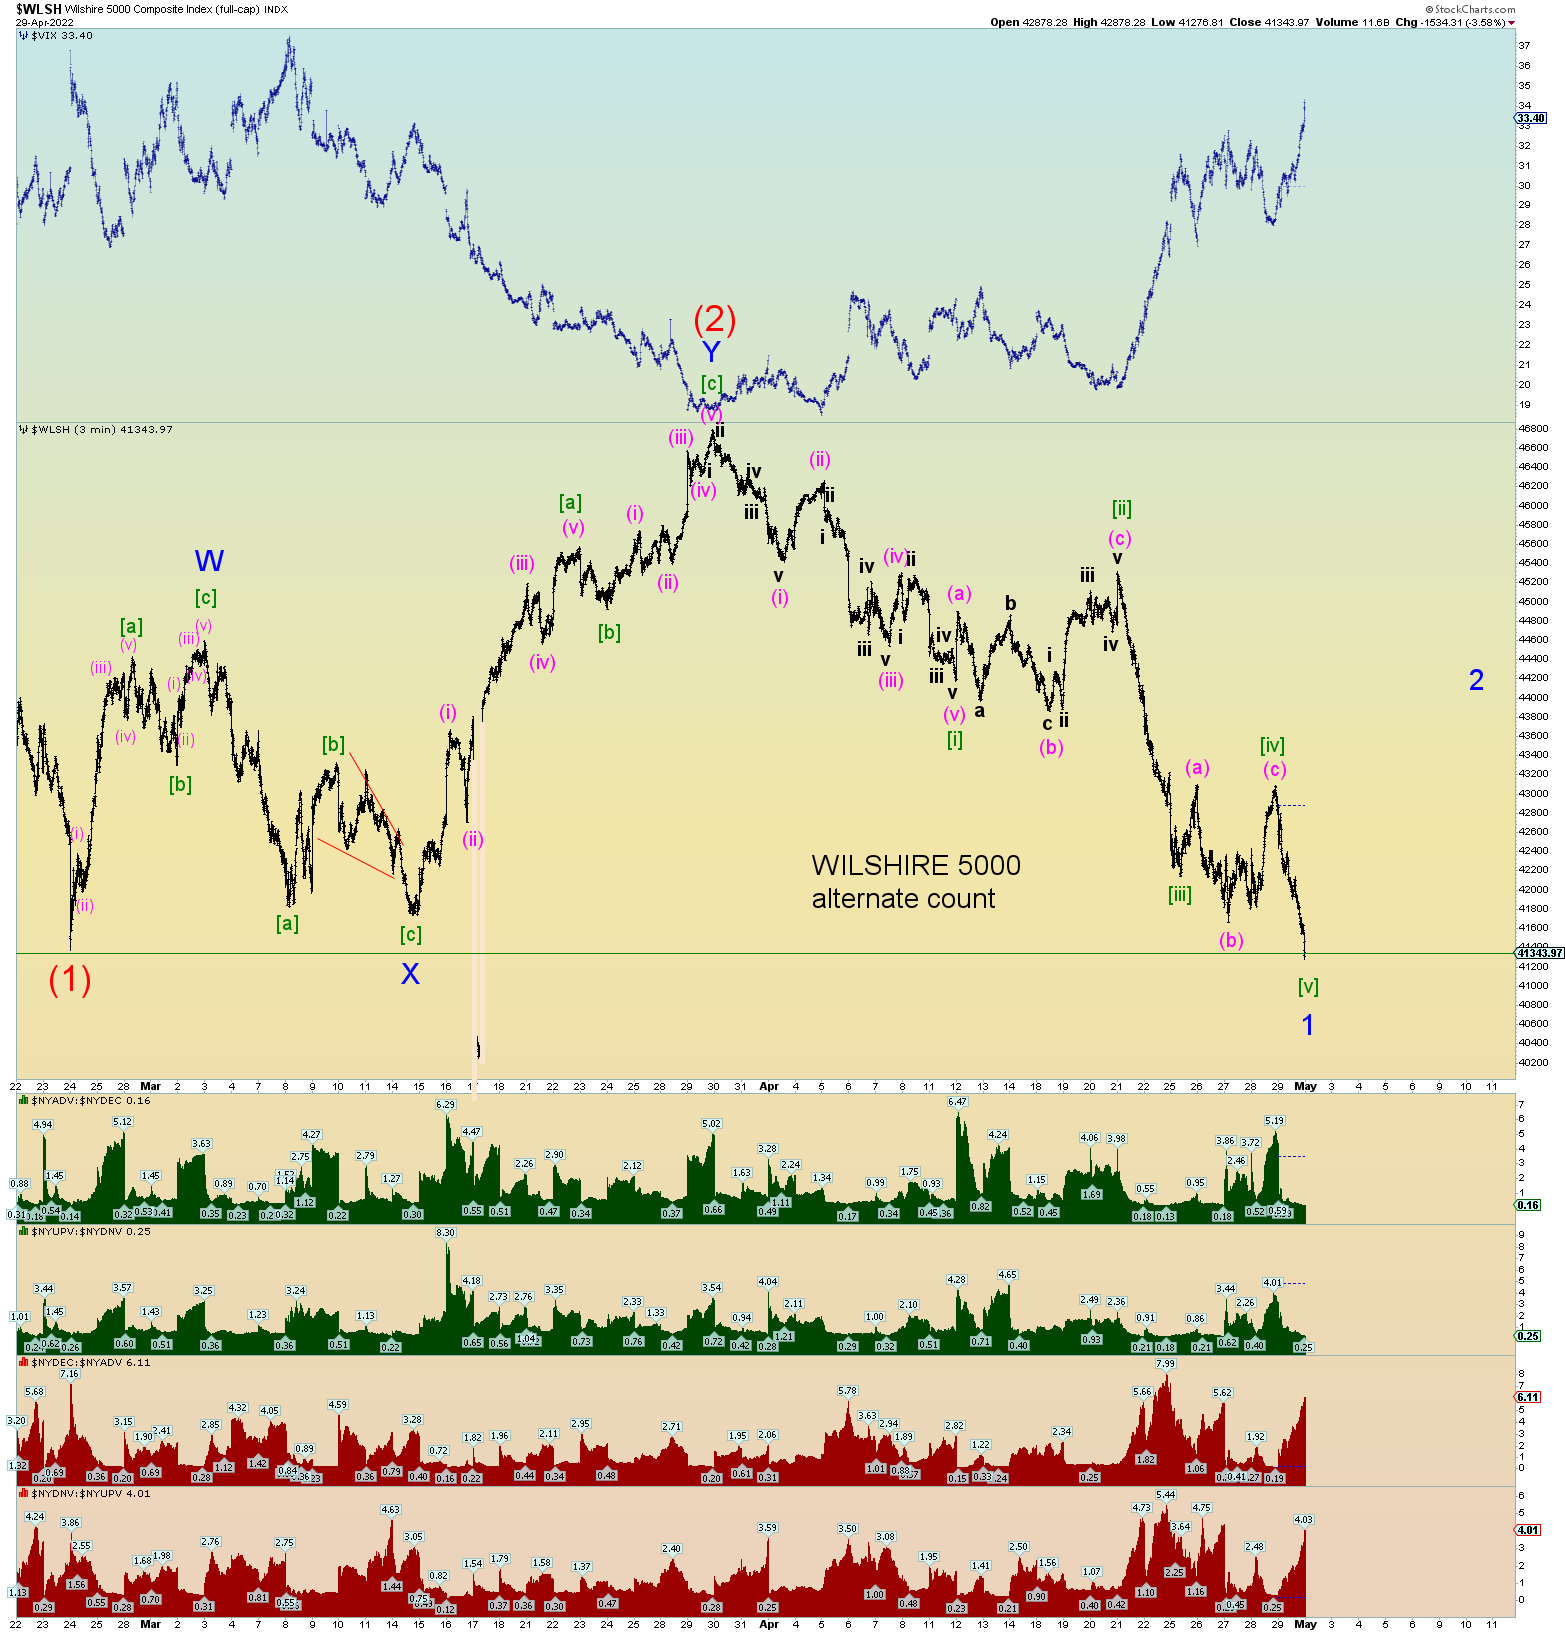
Quite the intraday turnaround. Not only couldn’t the S&P 500 hold 4500, but it also lost 4400 by the end of day.
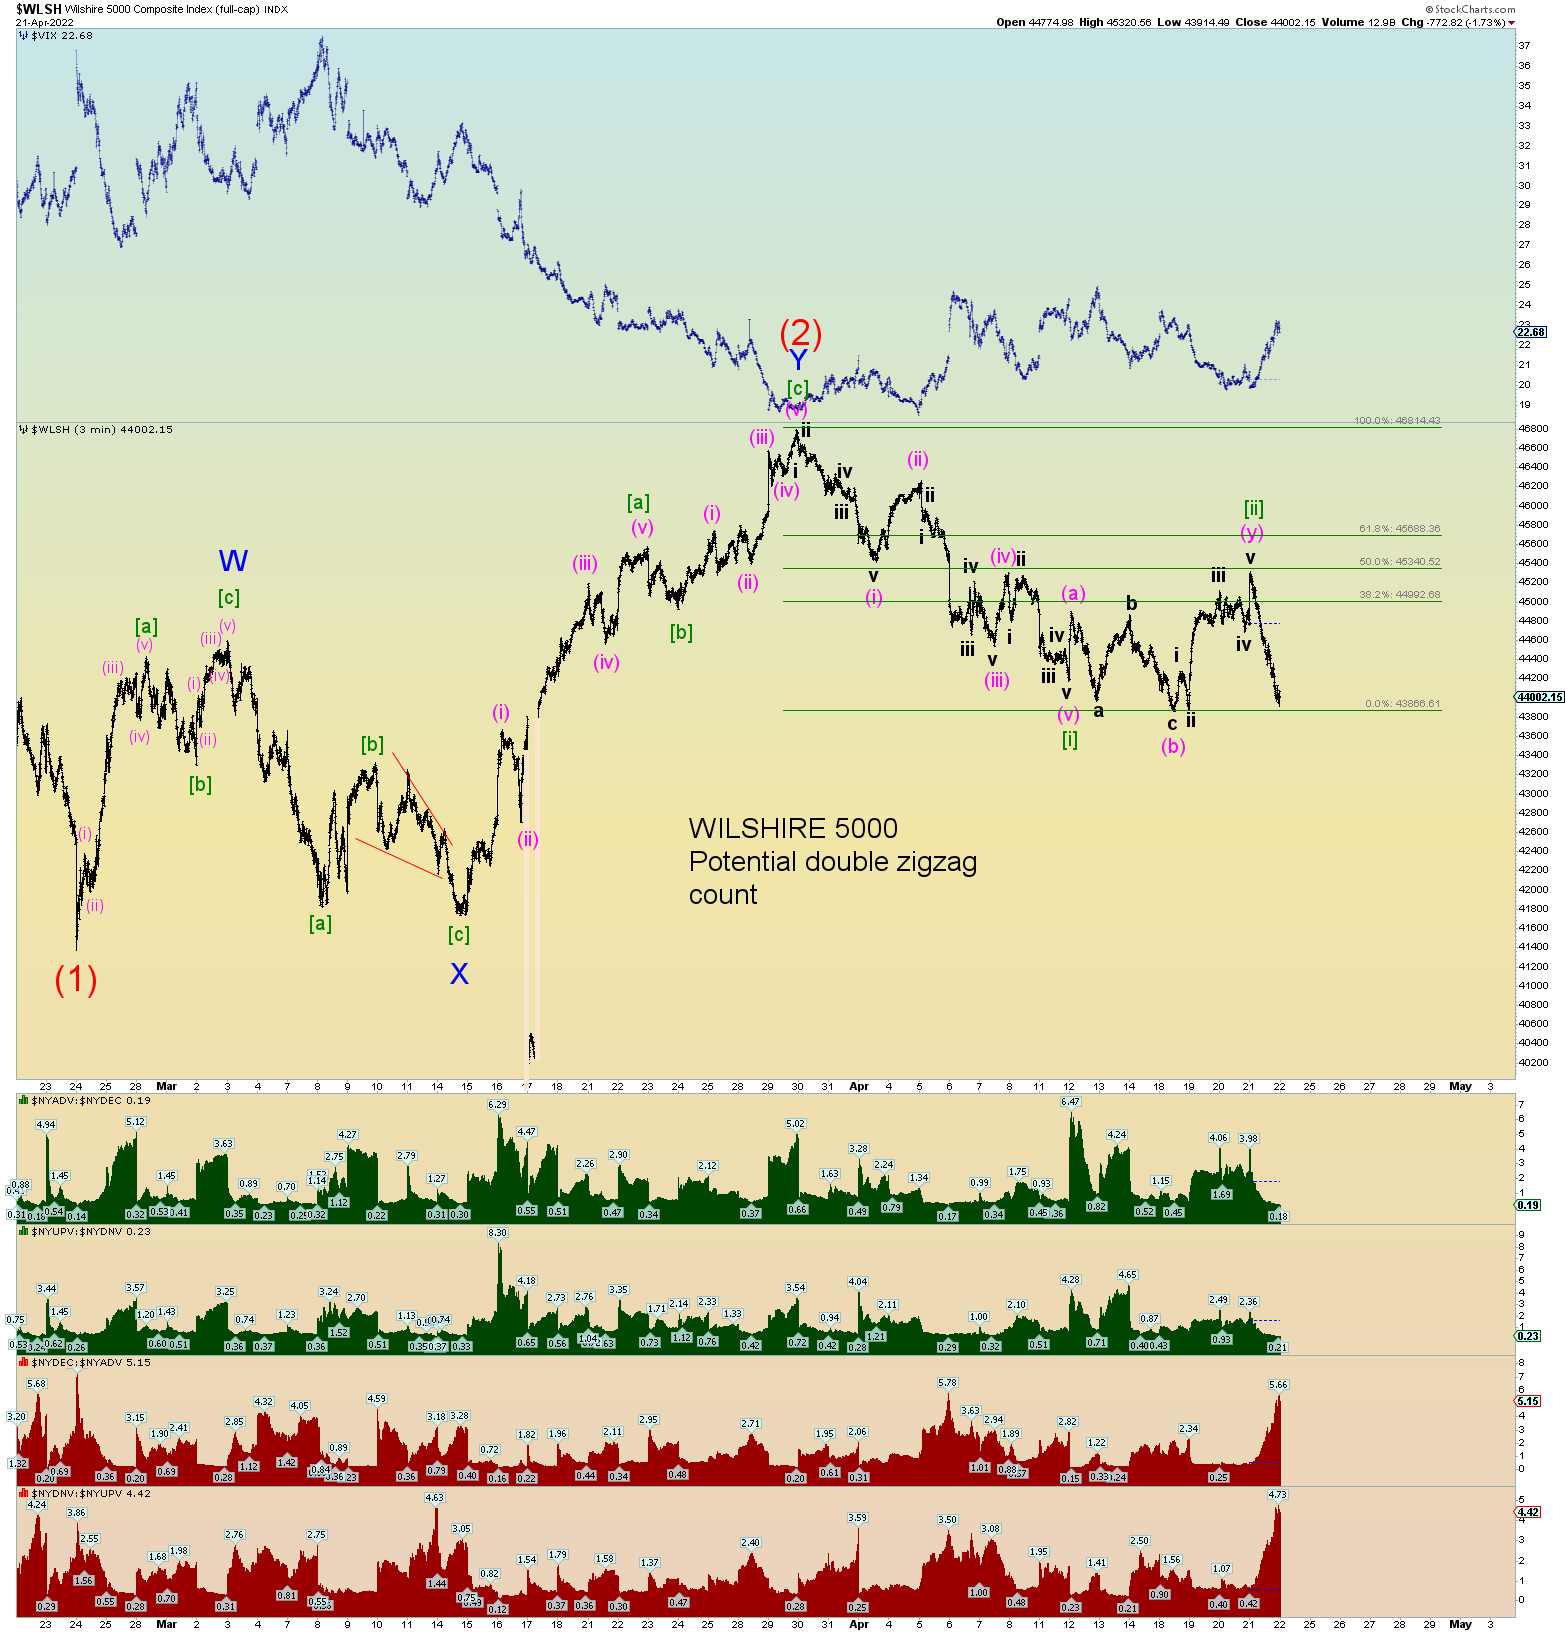
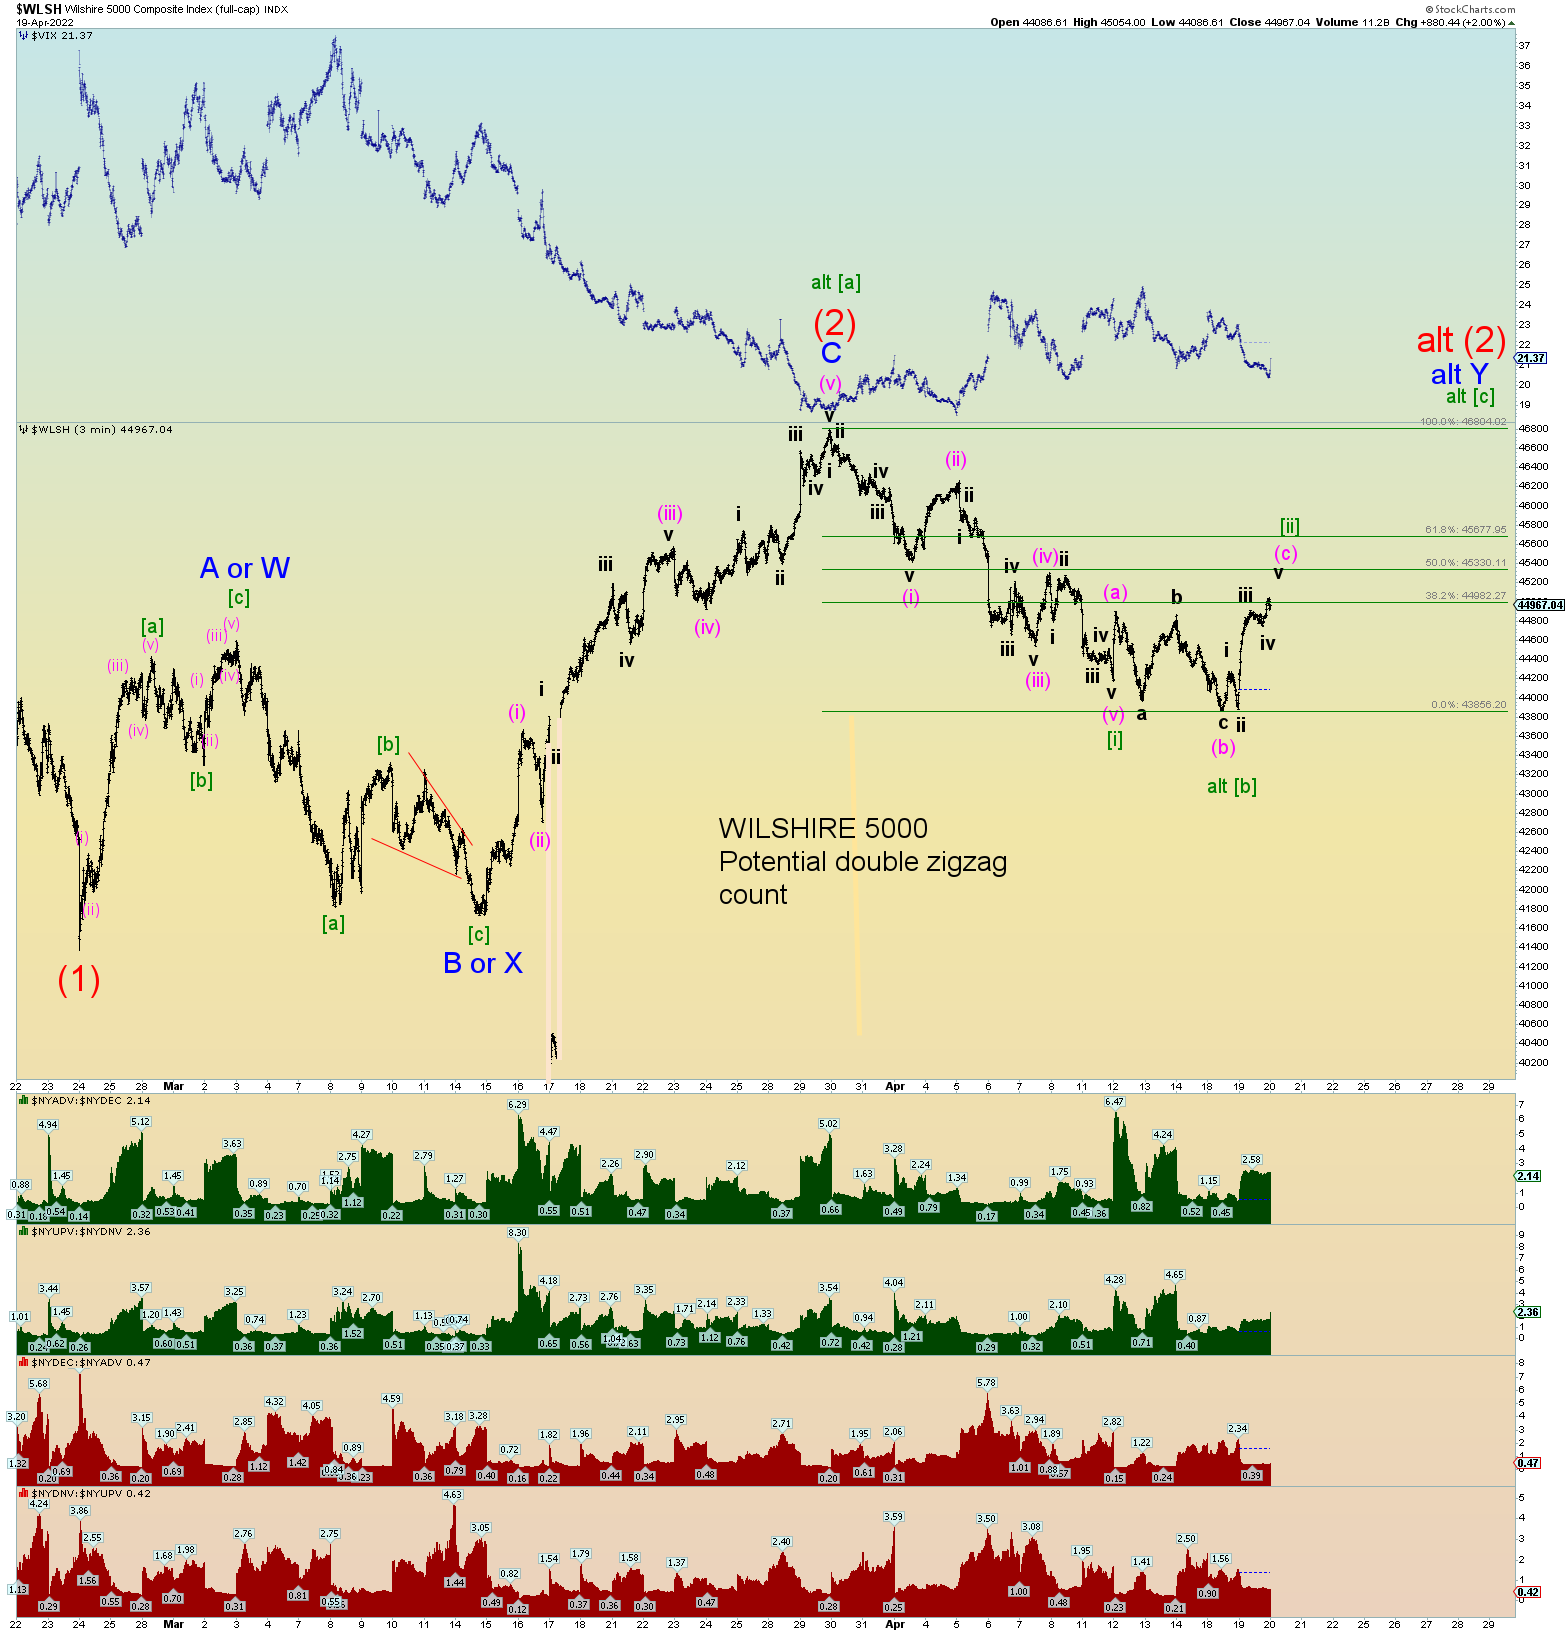
As far as wave structure, the Wilshire count is very satisfying:
The DJIA had a new wave (2) recovery high which was not followed by any other indexes showing a fractured market.
Negative social mood in China is reflected in their stock market. 400 million under lockdown.
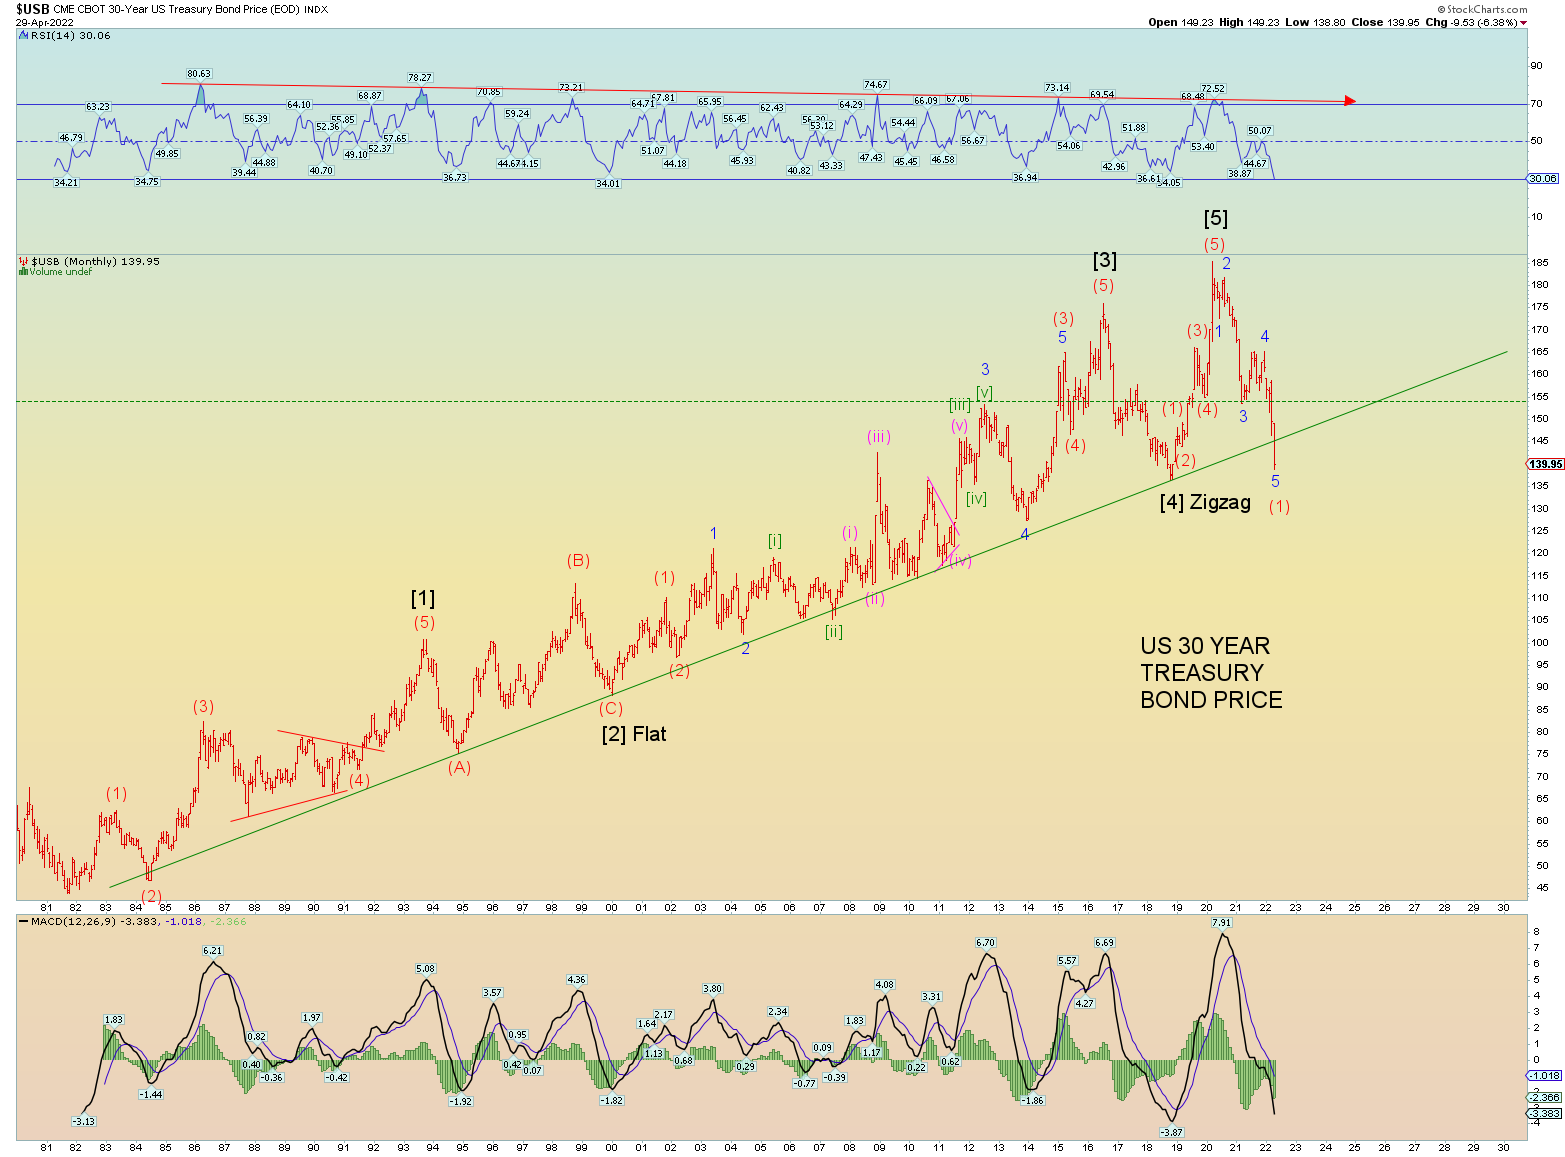
the long uptrend in bonds from the early 1980’s has been decisively broken.
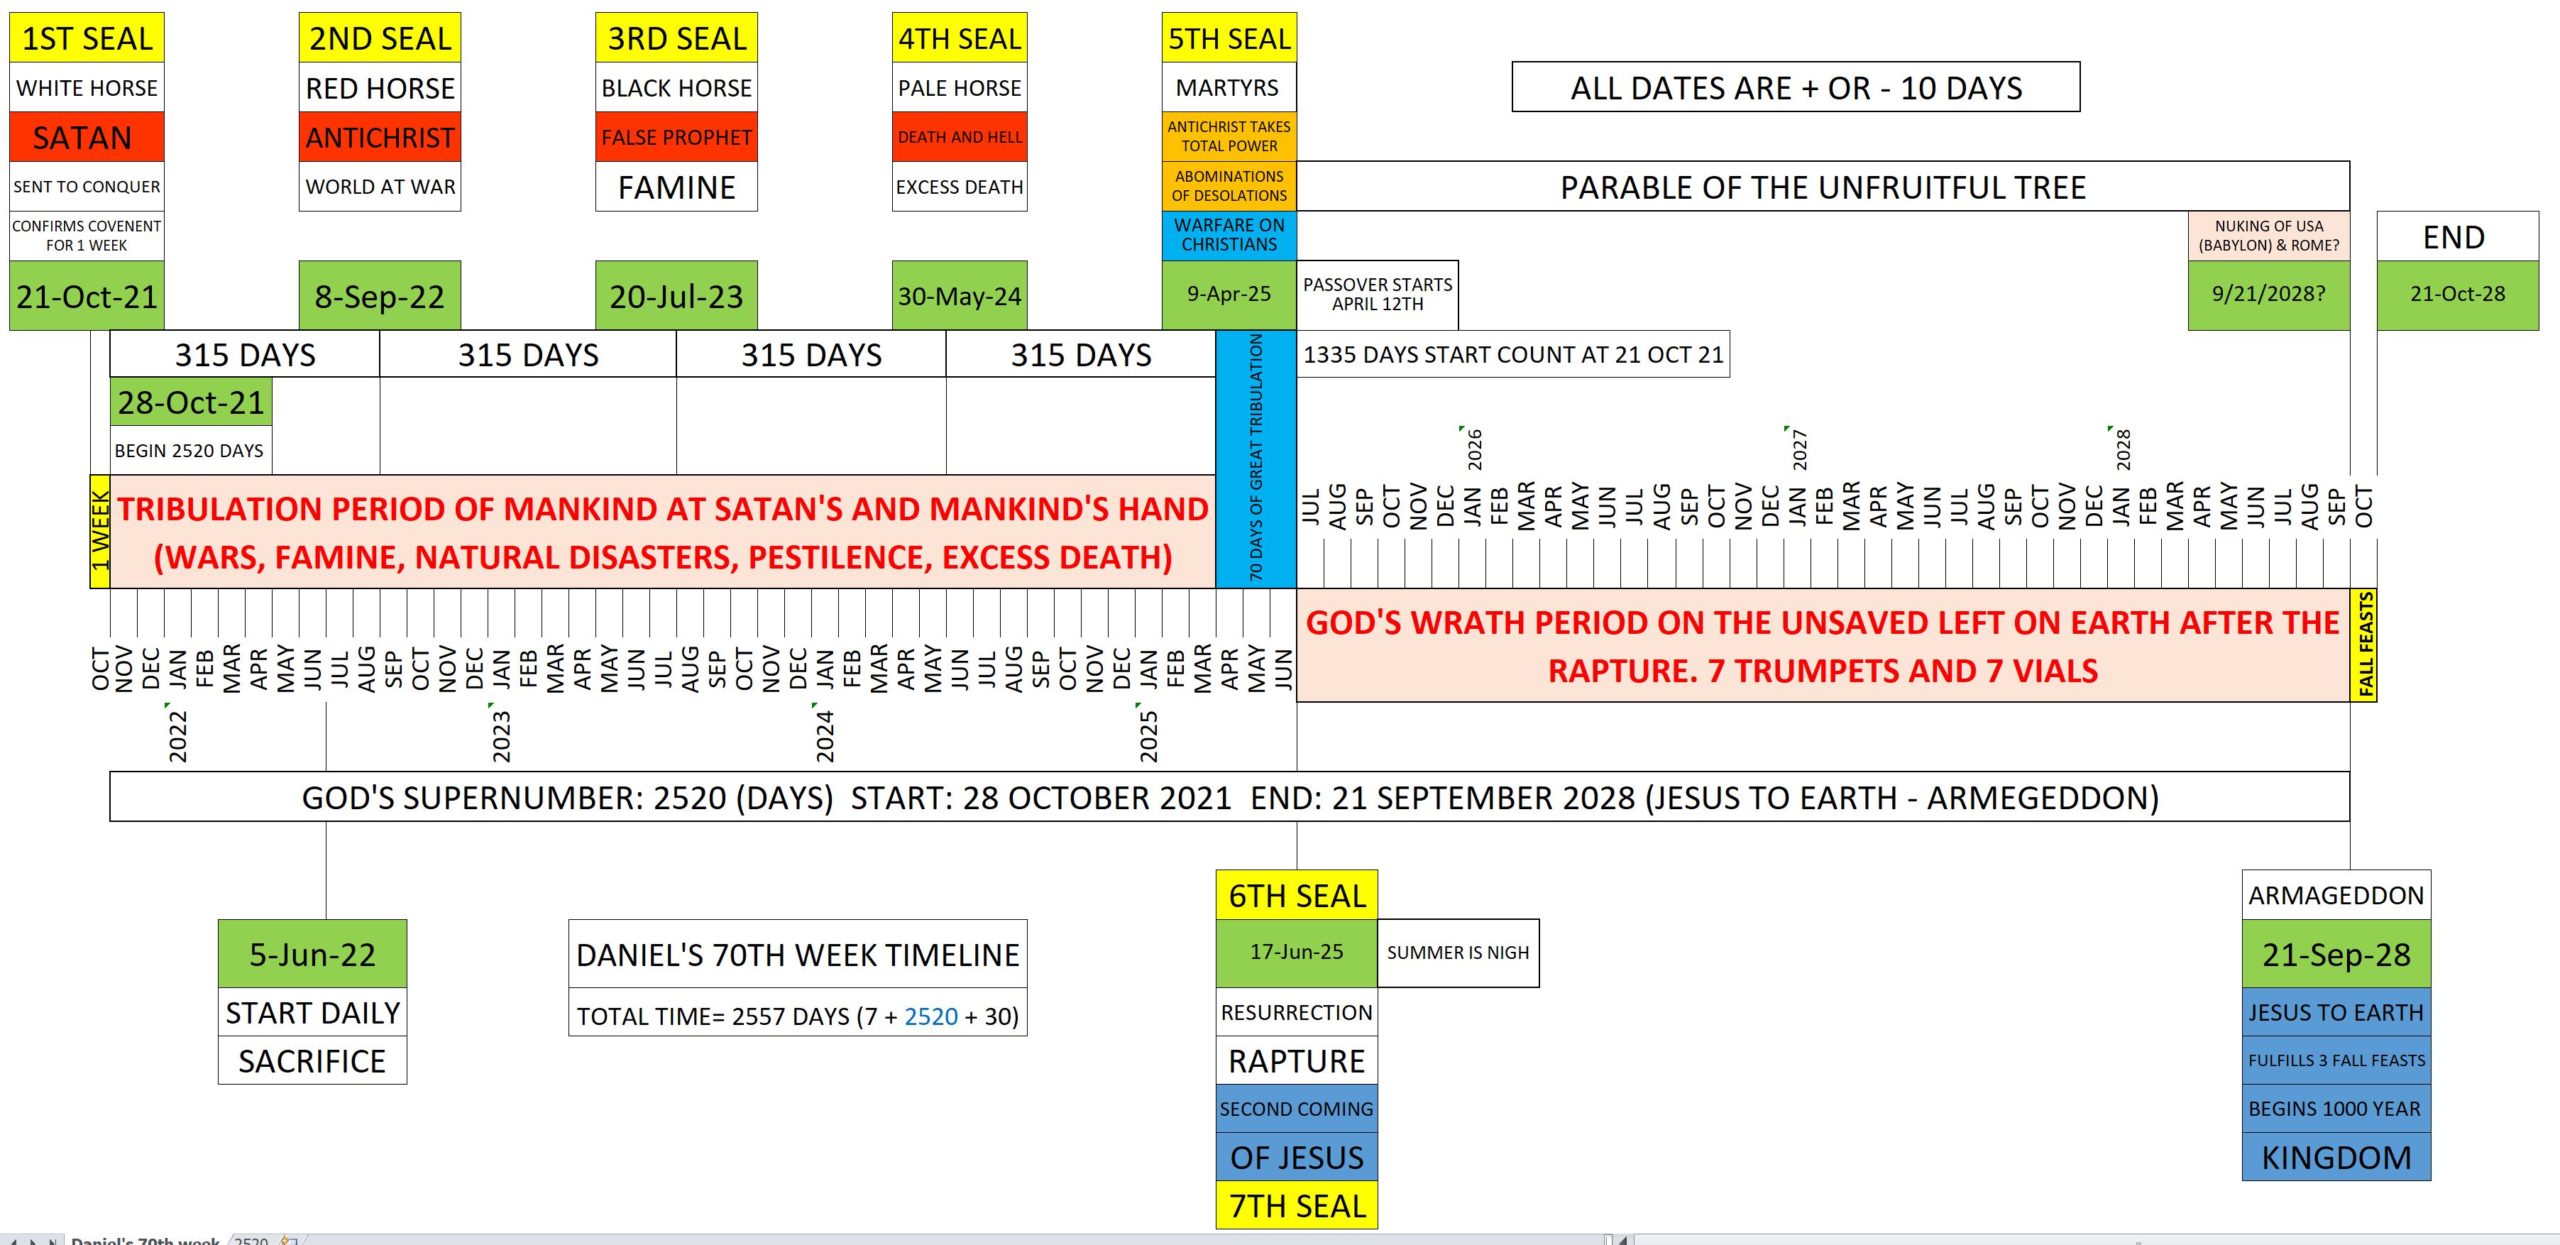
Reposting God’s Super Number 2520 and the numbers that divide perfectly (God is perfect) into it. 2520 is the first number that can be perfectly divisible by 1 through 9 without any remainder. And if you are a Christian and read the bible, it is perfectly divisible with every prophetic number that God uses in the bible. Note the numbers on both sides of the = sign.
Note: to fully understand my blog post see this post on Daniel’s 70th Week here.
2520, I believe, is significant and the key to solving two prophecies in The Book of Daniel. It is the number that I have proposed that is the “handwriting on the wall” in Daniel Chapter 5 that tells us how long “Babylon” has until its destruction. I propose that it is a “dual fulfillment” prophecy. Daniel’s interpreting it to King Belshazzar in Daniel Chapter 5:
25 And this is the writing that was written, MENE, MENE, TEKEL, UPHARSIN.
26 This is the interpretation of the thing: MENE; God hath numbered thy kingdom, and finished it.
27 TEKEL; Thou art weighed in the balances, and art found wanting.
28 PERES; Thy kingdom is divided, and given to the Medes and Persians.
They also view it as a dual fulfillment prophecy about “Babylon” but in my estimation, they are off the mark in the specific interpretation. God is more exacting in his prophecies. Yet nonetheless, I give great credit in that they see the same coming end result. They reach the same conclusion: Babylon will be revived, and it will not be a good thing and it will be destroyed again.
My interpretation is basically the same; Babylon kingdom, world empire #7 in biblical history, will ultimately be destroyed for the final time. However, I am more specific on times and dates based on the number 2520 which I think God wanted to be revealed in the end. He had revealed it to C.J Lovik, but C.J. is a “pre-tribulation rapture” believer, so ultimately C.J. is doubting and rejecting his very own work since 2021 has come and gone with no “pre-tribulation” rapture. So be it.
I have contacted Gabriel Ansley who also claims to know that Jesus Christ died on April 28th, 28 AD and insists he is coming back on 21 September 2028. But he is a post-wrath rapture believer (rare) who thinks Christians will be here not only for the 3 1/2 years of tribulation of Satan and evil men, but the following 3 1/2 years of the Wrath of God. Basically, he may have got the date correct – 21 Sep 2028 – but he is an idiot. Contacting him via email reveals he is an idiot x 2. He believes in post -wrath rapture. And that implies that Christians will be here for God’s wrath. He has no clue as much as C.J. Lovik. One is a “pre-tribber”, one is a “post-Wrather”. They are both ridiculous and follow false end-times doctrines.
Both have been blinded in a way. They both lack God’s solid gift of logic and hence they are in grave error in the end. One has promoted Christ’s coming “in secret” – the pre-trib rapture – and the other has promoted that Christians will be dodging fireballs from God and have to endure to the end in 2028. C.J. Lovik believed Christians would be “out of here” prior to 2022 (based on his Fall, 2028 end date) and Gabriel Ansley just assumes we are all going to keep going to the final wrath period right to the end enduring God’s Wrath. Note to both: We ARE appointed to tribulation and persecution at the hands of Satan and evil men, however we are NOT appointed to any wrath of God.
Oh, how have I linked myself to these “false prophets”! Yet I tend to think it was always in God’s plan anyways. He perhaps helped reveal correct prophecies to people who believe in wrong things and then tests and sees if they can overcome their other pre-conceived notions and come to better conclusions based only on the Word of God. Both have failed miserably so far. Both are stubborn. Which I predicted in my mind.
So that leaves me in that grouping of three that believes in a Fall September 2028 final date.
[UPDATE: Let me be clear, because I may be coming across with a false sense of “righteousness” – NO! I am an idiot just as the other two I have written about! Nobody should willy-nilly the prediction of the Coming of the Lord! – I am just writing about my experiences with the other two I have written about. And I am actually giving the credit to them because I didn’t initially come up with Fall, 2028….they did. Yet it is an appealing date, so I am going with it until it proves otherwise. All I am saying is that they are wrong on the rapture which is completely key to everything. In the end, date setting is futile, and I would not die on this sword if there were no primary signs mainly global war!]
One who interprets the bible to a “post-trib/pre-wrath” rapture event based on a September final end 2028 date and the start of Jesus’s 1000 year “millennial” kingdom. The pre-tribber is scrambling for more “clues”, the post-Wrather is awaiting God’s destruction, I guess. I will say it now: They are both retarded and need to find wisdom. I pray for them both. But I won’t throw out the baby with the bath water. I still like the 21 September 2028 “end of the world”, end of nations date. I have recently been squirming and trying to come up with an “alternate” count. But I cannot it keeps coming back to that same date or at least the season and year of Fall, 2028.
Why? Because the (general) date of 21 September 2028 (+ 0, – 30 days) links with two ancient prophecies in the Book of Daniel that can only be solved by God’s Super Number: 2520. The first prophecy is the “handwriting on the wall” and the second is the solving of “Daniel’s 70th week”. I propose today that both are linked to 2520 and both link the same end game date: the day of the “final Trumpet” of Jesus Christ when he comes down on His glorious white horse with all his saved following on our own horses to do battle with Satan, the Antichrist, and the False Prophet more or less on the date of 21 September 2028.
So why would you believe me if I have presented the “false fruit” that others have claimed? In addition to me, both C.J. Lovik and Gabriel Ansley have claimed the date of Jesus’s crucifixion death of 28 April 28 A.D., arriving to that conclusion in a completely separate fashion. They likely don’t know each other exists. One is a typical “Dispensational” Pastor who believes in the pre-trib rapture, the other has claimed to have visions and came to some pretty nifty bible conclusions of what I will call “Dispensational Lite”. There is truth in what Mr. Ansley writes in his books. His book connects the symbolism of the bible in wonderful ways and that is a gift. The bible is so deep in interconnectedness, that one can read it for 100 years and not find all the mysteries. But in end-times specific events, he is clueless as much as C.J. Lovik. I propose a middle path to both. I actually just read the bible for what it plainly says, nothing more, nothing less. Perhaps I have a better cold gift of logic and they do not. That is not to boast, God forbid! If they are wrong, that makes me just a tad wiser by default. See? Logical.
The solving of “the handwriting on the wall” is ultimately a dual-fulfillment prophecy. The near term was fulfilled that night when Belshazzar, the King of Babylon was slain, and the Medo-Persians took over the empire. The second fulfillment will be the final destruction of “Babylon” kingdom #7 – the New World Order – as explained in last night’s post here: New World Order, Antichrist, Mystery Babylon. Bible Symbolism. 2520 = God’s Super Number
Yet when it comes down to it, the date of Jesus’s crucifixion is KEY to unlocking Daniel’s two most cryptic prophecies. Can anything be solved without Jesus? (of course not!) Jesus’s hypothesized crucifixion of 28 April, 28 AD is the key to both prophecies’ timeline fulfillment. (Note: “28” is on God’s special number list”)
The solving of “Daniel’s 70th Week” is also solved via 2520 as explained in this blog post from last summer here: Daniel’s 70 Weeks of Years. I write about both C.J. Lovik and Gabriel Ansley.
Last night’s blog post expounded on the meaning of the bible symbolism (7 heads, 10 Horns/Toes) of the Book of Daniel – an Old Testament “Revelation” of Jesus Christ – and the Book of Revelation of the New Testament, the final book of the bible. The main theme was that all the symbolism, although seemingly confusing and endlessly complicated is actually not at all. That the main theme is that God is telling us that there has eternally existed a “Babylon” empire since the time Noah got off the ark – and God doesn’t like it – as empires only bring out the worst in man. God does not want us to be “united” in a one world nation (government).
“2520” links to both of Daniel’s two most cryptic prophecies:
1) 2520 prophetic years (of 360 days) from the “decree” of Artaxerxes in the Fall of 457 BC to the time Christ is anointed King (starting his millennial Kingdom). I propose that final date is 21 September 2028. That fulfills Daniel’s “70 weeks of years”.
2) A permanent destruction of “Babylon” kingdoms, of which there will be 7 total.
The end date of 21 September 2028 gives us a final end date result for both the time Jesus is anointed King on earth (70 weeks of years) and the very date the “final” Babylon kingdom is destroyed for good (Handwriting on the wall). And both are based on the decree of Artaxerxes of 457 BC which is derived by counting backward in time from the season and year of Jesus’s proposed crucifixion – the Spring of 28 A.D.
Jesus’s proposed crucifixion date of 28 April 28 A.D. unlocks both prophecies.
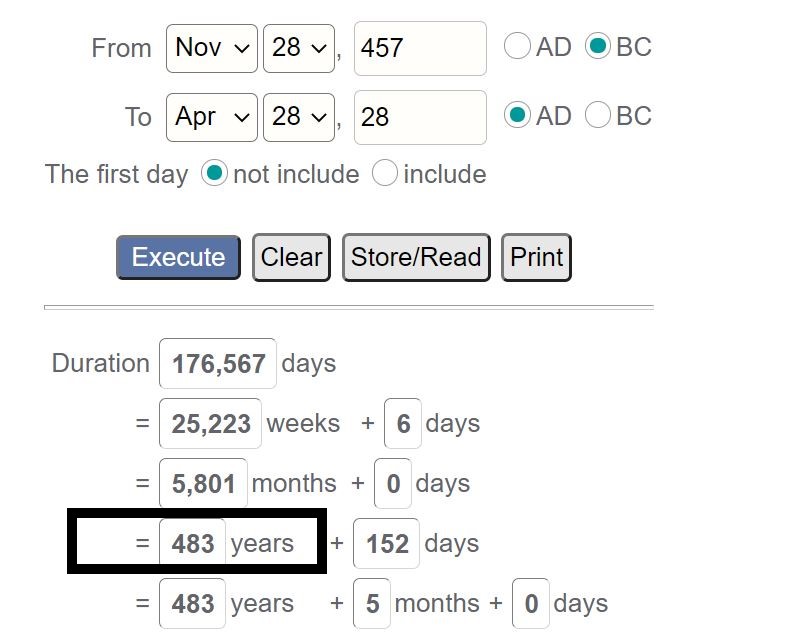
We go backward in time 69 weeks to get to the day of the decree of Artaxerxes: (for sake of illustration, I use 28 Nov 457 BC as the decree date – we don’t know the exact very day) We only now that after 69 weeks (483 solar years), Jesus died:
And for the final “end” of “Babylon” – biblical world empire #7 (and the final) is “weighed and judged”; a prophetic 2520 years. For the same day Jesus is anointed King of the Earth (proposed, 21 Sep 2028), the final Babylon Kingdom of the Antichrist is destroyed. So yes, Babylon has indeed been “numbered”:
26 This is the interpretation of the thing: MENE; God hath numbered thy kingdom, and finished it.
Since we know that the actual Babylon Kingdom was really only Kingdom #3 on a biblical timeline of 1 through 7, we can expect that the number “2520” must be involved with its final destruction for good since we think 2520 is what is written on the wall. And in Daniel’s 70th week prophecy we get the final answer. Therefore, both are linked. The solving of Daniel’s 70th week of Fall, 2028 matches the final solving of the “2520” handwriting on the wall prophecy of when the “Babylon” Kingdom will finally end for good. They both point to September 2028.
They both point to the same end date. The “70 weeks of years” prophecy (until Jesus is anointed King on earth) is solved by using the 2520 from the “writing on the wall prophecy”. And the writing on the wall prophecy (final destruction of Babylon) is solved by the determining start date (decree of Artaxerxes) of the “70 weeks of years” prophecy. They are both eternally linked.
God’s Super Number 2520 and the proposed date of the crucifixion of Christ – 28 April 28 A.D. – are key to both prophecies. The “70 weeks of years” gives the true end date but when we apply that back to where we got the number “2520 to begin with, the handwriting on the wall, we can see that also is solved for when the final “Babylon” world empire kingdom will be destroyed. I propose on or about 21 September 2028.
ARE THERE POSSIBLE OTHER ALTERNATE YEARS BASED ON THE ABOVE?
Both yes and no. And the answer is mostly based on the proposed crucifixion of Jesus Christ. Change your crucifixion date and that starts to make things go off by 3 or more years and does not match the bible. It not only changes the proposed date of Jesus’s crucifixion, but it also changes the date of Artaxerxes decree significantly. I have wrestled with alternate years based on 2029 through 2031 and beyond and it has been difficult to make everything work which is why I haven’t faltered.
Note this study on the 28 April 2028 proposed date of crucifixion of Jesus:
If you read the above PDF, I do not agree on everything it says – particularly its brief mention of how it interprets Daniel’s 70th week and its end target date, yet on the whole, it presents a lot of good truth. For one, God specifically told us the stars and sun and moon were meant for the marking of times and seasons. He WANTS us to use that to gauge events in time and the celestial study narrows down the crucifixion date to a very narrow range.
The answers to the end of the world are indeed embedded in the bible. Yet God did want us to record seasons and years to mark events past and future. So, I am trusting in some things that were studied by man. When celestial events happened in the past. We have computers now that can reliably and accurately date celestial comings and goings. I trust in that because God specifically told us that we should. God never said trust in blood injections of poisons (so-called “vaccines”) but he DID tell us to trust the heavens for signs and seasons and prophecies. So I will.
There can be only a few proposed dates for the crucifixion of Christ based on celestial events alone versus all the other clues from the bible. The window is actually narrow. One thing I do know is the bible prophesized he would be buried 3 days and 3 nights. That is a perfect 72 hours, and you’ll note that is a number divisible into 2520 and then having a perfect remainder. So, a Friday crucifixion and then Sunday resurrection and ascension to heaven does not match mathematically to what most Christians are taught and believe. The bible tells us 3 days and 3 nights. Therefore, I whole heartily believe in the Wednesday date of crucifixion to fulfill that prophecy. This is the whole purpose of prophecies to begin with! So, we can see and know that God’s word is true and perfect!
God doesn’t want us to be confused. Note that there are no “Fibonacci” numbers in the bible (other than the first few 1,2,3,5,8,…21). Infinity-type numbers are reserved for the eternity and mystery of God. Mankind chases it in a futile attempt (perhaps I am guilty too) but will never find the end of that rainbow, Like the number “Pi”, there is no solving it. This is proof that God made his universe in a very complicated thing that can never be solved by man. Yet the Kingdom of heaven can be solved simply by man. 2520 and all its simple easily divisible numerical products is proof.
And salvation is simpler than that: Just believe on the Father’s Son, our Lord and Savior Jesus Christ!
God wants it simple. Revelation is simple for those that are wise. Not smart, just wise. Wise enough to know that seeking answers via the universe and not God will only end in endless Fibonacci spirals. Sure, we can use these wonders of nature to announce and declare God’s glory, but only as a means to give glory to him and show that he is real. I know he is real, because we cannot solve Pi, we cannot solve Fibonacci numbers. I imagine that God can.
Fibonacci numbers are of this world, we can use them to see the somewhat unpredictable rise and fall of sinful mankind. And that is why I still do it. But God’s biblical numbers are perfect. We can see this in 2520.
Regardless, Jesus told us what to look for at the end of days. And the biggest thing that makes us go “hmm” is global war. I am not dogmatic about end times events! If no global war this year, and if not likely by September 1st, I will rightfully doubt my September 2028 date. For Jesus told us in Matthew 24 what to look for:
5 For many shall come in my name, saying, I am Christ; and shall deceive many.
6 And ye shall hear of wars and rumours of wars: see that ye be not troubled: for all these things must come to pass, but the end is not yet.
7 For nation shall rise against nation, and kingdom against kingdom: and there shall be famines, and pestilences, and earthquakes, in divers places.
8 All these are the beginning of sorrows.
Are we at the beginning of sorrows? Surely for the 3 – 4 million refugees, and counting, of Ukraine the answer is yes. I pray for the safety of the inncocent!
So don’t take my word for anything! Read the bible and determine for yourself! If we do not have an expanding global war by the end of 2022, I will say I am likely wrong.
I have told this repeatedly. No global wars = no tribulation.
But we are on our way, yes? Biden and company want to eliminate the nations that resist the New World Order. A global conspiracy to create a one-world government is bible prophecy 101. As is a one-world religion and currency to be able to participate in society.
If you beleive me about the “secular” things I say, cannot you see the bible is real?
What other religious book predicted almost 2000 years ago we would be implanting “marks” into our body to be able to buy and sell to be able to participate in society? Haven’t we seen a “foreshadow” of this with “vaccine” policy worldwide?
Do you not see that the worldwide Ponzi global financial system is poised to implode to bring about a one world currency after the collapse and devastation and ruin? And that the globalists – led by Satan – will have all the “answers” to the coming wars, and famines and devastation? And then come up with a new “system”, a “mark” to make you participate or else? Have we not seen how the media will blatantly pump-up people (Zelensky) that should be scrutinized and perhaps vilified? That the propaganda machine – the coming False Prophet – will crank it up to “11” and present us with the last Antichrist and insist that we should love him?
Why is it I no longer get emails saying I am crazy?
The bible accurately predicts how the world will end as we know it. It predicts a one world government, a one world religion, a one world currency. Is this not exactly what the globalists want in addition to a great culling of the earth to less than 500 million?
But as I told you, Jesus himself will destroy this final Babylon World Empire Kingdom #7 for good and establish his true and just reign. It will be glorious!
It will be glorious for me! But not for you if you have not Jesus Christ, Lord and Savior of All!
It is simple to be saved: Just believe on him in your heart!
The basic underlying discussion of that post hasn’t changed although I have learned so much more since last July. I should do a new updated post. Regardless, I haven’t changed the basic premise end date – 21 September 2028 – for when Armageddon occurs (when Jesus comes on the horse with all the saved following down on white horses).
Now C.J. Lovik, the guy who made the video, is a hardcore Dispensational (false teaching) Pastor. If you know anything about the false doctrine of dispensationalism, it’s teachings results in more false doctrines that are key elements in fooling Christians in the end times. 1) Pre-tribulation rapture. This teaches Jesus comes back and rescues the “church Age” prior to the final 7 years. False. We are resurrected/raptured in the middle of Daniel’s 70th week. 2) “dual covenent” theology that teaches the final 7 years is “only for the Jews (which is why they teach the pre-tribulation rapture). Also, false doctrine. Rabbinical Judaism was hated by Jesus, and he warned them in Matthew 21:43
Therefore say I unto you, The kingdom of God shall be taken from you, and given to a nation bringing forth the fruits thereof.
And so he did. They were given another 42 years to get right and accept Jesus and eventually God sent the Roman army to crush them in 70 A.D. So the idea that modern Israel of 1948 was brought about by God is false. Satan brought it about through the evil United Nations.
My point is this: Even though CJ did brilliant work on possibly unlocking Daniel’s 70th week since 2021 came and gone and no rapture, he rejects his work and is trying to come up with other answers such as rapture in 2022 or 2023. Both are false even Armageddon was pushed back to 2030, Rapture doesn’t happen until about June 2027. He should instead discard Dispensationlaism and figure out why he believes in a pre-trib rapture. But I laugh at his calamnity and I imagine God gave him the possible unlocking key of Daniel’s 70th week on purpose so he could laugh at him also.
The point of my commentary is to lead up to the fact that the number 2520 does seem to be God’s Super number. The smallest number that 1 through 9 can be divided perfectly into and not have a remainder. But additionally, just about every important and prophetic number used in the bible can also be divided into 2520 perfectly. Some examples are 1260, 360, 3, 4, 7, 10, 12, 24, 30, 40, 42, 70 etc. I just find it more proof that 2520 is a key in unlocking the time until the end of the nations (Gentiles) be fulfilled. For when Jesus comes back there will only be one Kingdom.
BOOK OF DANIEL AND REVELATION SYMBOLOGY, AND THE NEW WORLD ORDER
Between the Book of Daniel and Revelation there is much animal symbology used to represent things at the end times. Often the term “beast” and 7 heads and 10 horns or toes are used to represent Kings and Kingdoms at various times. Suffice it to say I could write a small book on it all, but I’ll give you my synopsis of what they represent and how it relates to our times now. In other words, just the outcome of the symbology for now. Maybe at a future date I can write a detailed post because I feel I have a decent grasp on things and how it may relate to end times events of the coming New World Order.
The basic underlying premise is this: There are 7 “Babylon” Kingdoms in the bible since the time Noah got off the ark. Babel is the base word because the original Tower of Babel was at Babylon. God did not want man to gather and unite and this is why he scattered us at the tower and confused our languages. God’s plan was always for us to form and keep small manageable nations of God-fearing believers. For God knew that whenever mankind attempts to “unify”, the worst sins and violence are brought to the forefront. Power corrupts. Big Kingdoms and empires corrupt absolutely and bring desolation and ruin. God doesn’t want us united. But of course, man makes his own plans under the guidance of Satan.
The term “Babylon” in the bible is often used to either represent the real Babylon city or kingdom (it can represent both) of old or simply a symbol for any of the 7 “Babylon” empires that the world must progressively go through according to bible scripture. It represents an attempt by mankind to conquer and unite. And each successive empire “Babylon” kingdom gets destroyed and the baton gets handed off to the next. God pretty much uses other wicked armies to do just that.
The first great world power to form after the flood was Egypt where the Hebrew nation was in bondage. Consider this “Babylon kingdom #1”. After the Israelites escaped Egypt and settled the promised lands, they were united as 12 tribes up until Soloman dies about 930 BC and then split into 2 nations: Israel in the north (10 tribes) and Judah in the south (2 tribes). Egypt by this time has waned as a global power and new powers arise from the North.
The next “empire” kingdom (we’ll call this “Babylon #2) is Assyria. This is the Kingdom that conquered Israel (by then known as Samaria) and the northern 10 tribes were either carried away or absorbed by the heathen tribes that settled in. This left Judah all alone. By this time, is when the word “Jew” was started to be in use. It was anyone from Judah which consisted mostly of the tribe of Judah, Benjamin and Levites and any other stragglers that managed to resettle there.
It did not take long for the third empire to arise, and this was the real Babylon kingdom (#3) which wiped out Assyria and its capital Nineveh. This is the kingdom that overtook Judah, and they went into captivity for 70 years as a result. This is when Daniel the Prophet lived and prophesized. At the end of Daniel’s life Babylon (the night of the writing on the wall – 2520) was overcome by the Medo/Persian empire. This is of course “Babylon” kingdom #4. (The Persians waxed greater than the Medes and it became known as just the Persian empire).
As a side note on the “Handwriting on the wall” prophecy, this prophecy was about Babylon losing its empire, and indeed that very night the King was killed, and the Medo-Persians took over. But the “2520” represented on the wall (50 + 50 + 25 + 1 = 126 x 20 = 2520) is a dual fulfillment prophecy. Not only did it predict the doom of Babylon that very night it points to the final Babylon kingdom falling at the end times!
The next empire to come along (and this was accurately prophesized by Daniel) was Alexander the Great and the Grecian (Greek) empire. They swiftly conquered the Persians, and their empire is to be considered “Babylon” empire #5. By this time Judah was back into their homeland in the 400 years or so before Christ came on the scene. You can all guess “Babylon” kingdom #6: The mighty Roman Empire. Following so far? God doesn’t like these empires, eventually they are destroyed by other heathens. In this case the northern barbarians although by this time that is an unfair term. Rome split up.
After the Roman empire fell, there was not a dominate empire such as like them since. The world’s population had grown much bigger, settled farther apart and more diverse and despite what people may tell you, there hasn’t been that Babylon #7 final empire just yet. Mankind attempted but can anyone claim a true dominating kingdom since Rome? But it is coming and surely led by America. Consider Babylon USA the capital city Babylon, for the coming Babylon empire kingdom #7, the final one before Jesus’s reign. Otherwise known as the New World Order by the Klaus Schwabs of the world.
Now there is bible symbology of the 10 horns (or 10 toes in the dream by Nebuchadnezzar of the statue image) linking the last empire Rome (Babylon #6) to here in modern times. Consider those 10 toes or 10 horns as Kingdoms here at the end of times. Sometimes they are Kings as in persons, sometimes Kingdoms as in a nation or really you can think of them as both. If a “kingdom” is doing something obviously its “king” is doing it or allowing it.
So out of the Roman collapse sprung up more or less 10 kingdoms in perpetual balance for the last 1600 years. Think of it like this: since Rome’s fall there has always been about 10 kingdoms in competition with each other and that exists unto this very day. Some people try and figure out through time what they were or who or where, but it is largely moot at this point. The main point is that Rome fell, and the world divided again, and Christianity flourished as it became more populated with approximately 10 kingdoms always in balance over the past 1600 years. The symbology of the iron mixed with mirey clay in the 10 toes indicates that they do not mix well together. Is that not true? And that also exists until this day, nor would it mix well after the NWO Babylon #7 finally unites.
So, we still have about 10 nations today that exert world influence more or less equally. But that is about to change.
We can imagine these 10 kingdoms (nations) today. And no, don’t try and figure out if it’s the “G10” or the original European Union, or whatever. It doesn’t really fit that way. I kind of look at the obvious: the 9 nations that have nuclear weapons or nuclear weapons on their territories are in the running to be considered the “top ten”. The 9 nuclear weapon nations are: US, UK, France, Israel, Russia, China, Pakistan, India, North Korea (so they claim). Additionally, both Germany and Turkey have American nuclear weapons (bomber-type) stationed in those countries. This is a wonderful representation of the world, yes? And we have all the major global players. Nuclear weapons are a wonderful starting point for determining about who the 10 world powers are. A wild card is that Iran, the old Persian empire, will soon get nuclear capabilities. Just a thought to add one more. (But I think we paid them off with the Iran deal to stay out of it)
Ok, so again, much of the symbolism, the prophecies of the end times of the bible gets us to this point in time. America is the leader of Babylon kingdom #7 and its goal is to create a unified New World Order government. Remember this is not a “good” thing in the eyes of God. Babylon kingdoms are an abomination led by the devil and by devils. Consider the United States the “city” of Babylon in the 7th world empire. The final empire that gets destroyed by Jesus.
The goal of the New World Order – again Babylon empire #7, the final one – is complete control; one world government, one world currency, and eventually forming a one world religion. This is all predicted in the bible. Christians are the only religion capable of defeating Satan so eventually Christians are the target. But we are not there yet. Consolidation is in the works.
This is where the “antichrist” comes in. Beside the 10 horns (kingdoms or kings) arises a smaller horn, a leader that “spaketh great things”. A great warrior who subdues 3 of the 10 kingdoms. Ok pay attention, this is where it gets really interesting. My take on this is that there are 3 nations hindering the advancement and forming of a New World Order. 3 nations of the 10 – and I listed the likely candidates above – who are resisting giving up power to the planned global one world government. Can you guess probably who the #1 nation is hindering the plans for the past 20 years? Yes, Russia.
This is why the extreme agitation against Russia for the past 10 years in particular. The false “Russia gate” and now, if you have even the slightest ounce of cognitive skills – you can see how we have provoked and now want to sustain this Ukraine war. The goal of course is regime change in Russia. When Boris Yeltsin (he was our puppet) was pushed out of power, the Russians did not want to play “NWO” games of Papa Bush any longer. And so here we are. And don’t think I have a dog in this fight, I’m just a Christian calling it like I see it. Putin may be an old-fashioned commie that craves power, but he probably doesn’t drink Adrenochrome. If he is resisting the NWO, what can one say that doesn’t offend anyone all around? I don’t know if he is a Baal worshipper or not. However, he took the bait and now we shall see the outcome. All I know is I won’t be rooting for the NWO side of things!
And Zelensky, who I profiled as a “type” of Antichrist a few posts back, is just the sympathetic figure the mass media will generate to garner sympathy. And he is getting it. Him being a reprobate (he has done a transvestite video) I couldn’t care less; I already hate the guy. He is Biden’s puppet and working for us in sacrificing his people and country so that we can initiate a regime change in Russia. I call ’em as I see em. I give it about 30% odds he IS the real Antichrist.
So ok, does this mean Russia loses? I don’t know. We are practically driving weapons to the front; Putin keeps warning us but obviously we want a wider war. Inflation and financial collapse to the Western powers be damned, as financial collapse is coming as part of the plan. It is not time yet for that but it’s coming, consider it a back pocket plan ready to be deployed at any moment. Remember Putin is resisting the NWO so he has to go.
So, who is the second nation of 3 (that bible predicts) that the NWO requires regime change? That is a little trickier but look at it this way: Which two world powers on my list above is either helping Russia or not sanctioning them? China and India. And how would we possibly topple China and get either 1) a regime change 2) civil war so that they are weakened. And how would we do that? Its obvious we would use the same playbook. Goad China into attacking Tawain and then generate world outrage. Same playbook as in Ukraine. And when the Chinese have the Taiwanese on the ropes, fly in Zalensky as a media stunt to stand and defend Tawain in its hour of need. This is where I think the Western powers will be going “war hot”. We have more or less pledged to defend Taiwan.
And the third country I don’t know. I could speculate we use nuclear armed Pakistan to goad India into a nuclear exchange where maybe a nuke goes off, maybe all of New Delhi is wiped out. I’m just spit balling here. Consider this just biblical desktop “war-gaming”. Again, I have no dog in any fight. Almost all of India is going to burn in hell because they have not Jesus Christ. But it is NOT TOO LATE!
Or maybe Israel vs. Iran. We just won’t know until things unfold. But the “gist” of the coming warrior Antichrist is that he subdues 3 kingdoms. And then he actually dies and goes down to hell. 3 days later, out of an imitation of the real Jesus, he rises out of the fiery pits of hell and that is when he is elected supreme leader of the now-subdued one world government. He has all the answers to bring about world peace again and this is about the time God casts a great delusion over the earth so that the majority can believe the lie in full, and their fate is sealed.
Of course, be on the lookout for the “false prophet” he will also be one speaking great things about the Antichrist and leading people to worship him. I could speculate all day long who and what this will look like, but if you are saved to Jesus and have an eye and an ear you will know and see when you see him. I don’t expect him on the scene until a year or more.
Of course, all this will take 42 months if you have viewed my timeline. And if its 2030 end date instead of 2028, then push everything out and this is just a warmup to the real beginning. We won’t know until we see expanded global warfare. And then the famines and more pestilences. Oh yeah, they’ll want to keep injecting us also. Remember they want a one world government with less than 500 million. Diverse earthquakes will occur as hell fills up with excess deaths occurring in vast numbers through famine, war and disease.
That’s about how I see things happening. At the 42-month mark into Daniel’s 70th week, the Antichrist sets up a graven image somewhere in Jerusalem. Most people assume a third Jewish temple must be built but in reality, there is a perfectly nice “Dome of the Rock” – temple – already standing for over 1000 years. It will do just fine. For you see along with the one world government, once this Antichrist takes power and God’s grand delusion comes over and blind’s many in the world’s eyes (most are blinded already 13 billion poison shots given out and going strong), all religions of the world will unite. And having a – perhaps Jewish – “messiah” go into the Dome of the Rock as the next Mahdi, the next great Muslim prophet and the Buddhists will think he is the 5th Buddha and fake Apostate Christians will think he is the real second coming of Jesus and of course Jews will think he is their Messiah king come to life so they can crush all their enemies underfoot.
And when the religions unite and are required to worship the Antichrist beast is when the NWO demands we get “chipped” into either our right hand or forehead to be able to buy and sell. And this time they will mean it. The vaccine “campaign” is just pre-conditioning the world.
Really just get saved to Jesus please. Everyone. Take him in your heart and ask him to be your savior. He died for our sins and you’re going to hell without him. Jews, Muslims, Buddhists, Hindus, Atheists, fake Christians, you are all going to fill up hell so fast and cause great earthquakes that you better get with the plan of salvation. Have complete faith on him only because you are like a dirty rag without him.
Of course, to finish my story on bible symbolism, the 10 horns, the 10 kings (nations) who were eventually united through global warfare and a regime change or 3, are given power – a will of God – to stab the Great Whore – MYSTERY BABYLON – in her back toward the end of the Antichrist’s rule in September 2028. They will burn her with fire in only ONE HOUR which I am guessing it will be a surprise attack with nuclear weapons. The USA gets nuked, never to be inhabited again. And since the oceans are ruined in God’s wrath period, there are no submarines to retaliate.
A fitting ending for the nation that developed the great fire weapons to begin with and the only one to use them so far. A nation that has sacrificed 50 million babies in 50 years. God remembers and his wrath is kindled greatly. Blood has to be paid for by blood.