Isn’t it just perfect that the political left is the primary rabid cheerleaders for war against Russia and the political right is primary rabid cheerleaders for war against China?
DeSantis Reacts To Biden’s Ukraine Visit, Warns Of “Proxy War” With China In Ukraine | ZeroHedge
They complain about Ukraine but want to pick a fight with China even though they voted for 50 years in typical globalist fashion to send America’s manufacturing base to that very country?
But I don’t even care anymore. I just sit back and watch the world spin out of control knowing full well Satan has his tentacles into everything and is directing everything, probably from the House of Rothschild in London.
At every corner you look, there is now a wicked reprobate Jew in charge of that organization or department or corporation or country or governmental agency or school or university or Hollyweird or newspaper or television or cable tv or hedge fund or bank or financial institution or whatever. I mean literally. They have managed to protect and promote themselves into all positions of power of everything which was always the long-term goal.
And stupid bible-believing Baptists helped them all along the way for the past 120 years. Actual Christians who yoke themselves with the devil. It’s sickening. But Satan is the master deceiver.
And the ones who disdain converting to Judaism, are nevertheless Freemason Zionists (born of kabalistic Judaism) who are doing their bidding and Satan’s. Make no mistake Satan has been using Judaism for the past 250 years to enact his revenge on Christians and God. Judaism hates Christianity underneath it all but they will hide it somewhat. Satan has maneuvered the serious reprobate Jews to his level of hate. They keep it secret until the day of total world power comes by the Antichrist. Then they will unleash their revenge they have been praying for over 2000 years (praying to Lucifer ultimately).
The typical Jew, one who doesn’t practice Judaism can be saved like any other unsaved person. And if my writings help those who still have an ear for what is really going on and brings them to Jesus Christ that is my intent! To avoid God’s wrath for that is surely coming on this earth.
Most Jews today are converts from some point in time. “Judaism” is a religion, not a race and not the religion of the Old Testament. That fully ended in 70 A.D. with the destruction of Herod’s temple although the Pharisaical Rabbinic Talmudic system was being developed even in Jesus’s day and it changed its name to “Judaism” only in the last few hundred years in a long-term plot to win over Christians who hated Rabbinism for 1800 years and was keeping them from positions of power and their desire to conquer the world and exact revenge.
Judaism is an imposter Old Testament religion as is the modern nation of “Israel” over there at this moment in time brought back by Satan and the wicked United Nations to carry out his end times wickedness. It is a grand ruse…. Jews don’t believe ANYTHING from the bible nor are they capable.
Marching to Zion – documentary (Full Movie). God’s chosen people. Pastor Steven Anderson. – YouTube
“Antisemitic” is just an 1800’s invented screed to be used to silence and punish all things critical of the “Jews”. When you take on the spiritual mantle of Judaism you sign up for being responsible for not only for crucifying Jesus, but the blood of righteous Abel! This is what Jesus himself said.
His Blood Be on Us, and on Our Children | Pastor Anderson – YouTube
So even if you converted just last year, hey guess what, you signed up for all the spiritual “perks” and privileges you get when you sign up for #1 Antichrist Jesus hating religion. You get what they told Pontus Pilate and “his blood be upon us and our children” spiritual cursing. You even get credit for the blood of Abel! (This is what Jesus said) Congratulations! Have you never read Matthew 23 in its entirety? Here is a taste:
1 Then spake Jesus to the multitude, and to his disciples,
13 But woe unto you, scribes and Pharisees, hypocrites! for ye shut up the kingdom of heaven against men: for ye neither go in yourselves, neither suffer ye them that are entering to go in.
14 Woe unto you, scribes and Pharisees, hypocrites! for ye devour widows’ houses, and for a pretence make long prayer: therefore ye shall receive the greater damnation.
15 Woe unto you, scribes and Pharisees, hypocrites! for ye compass sea and land to make one proselyte, and when he is made, ye make him twofold more the child of hell than yourselves.
23 Woe unto you, scribes and Pharisees, hypocrites! for ye pay tithe of mint and anise and cummin, and have omitted the weightier matters of the law, judgment, mercy, and faith: these ought ye to have done, and not to leave the other undone.
24 Ye blind guides, which strain at a gnat, and swallow a camel.
25 Woe unto you, scribes and Pharisees, hypocrites! for ye make clean the outside of the cup and of the platter, but within they are full of extortion and excess.
26 Thou blind Pharisee, cleanse first that which is within the cup and platter, that the outside of them may be clean also.
27 Woe unto you, scribes and Pharisees, hypocrites! for ye are like unto whited sepulchres, which indeed appear beautiful outward, but are within full of dead men’s bones, and of all uncleanness.
28 Even so ye also outwardly appear righteous unto men, but within ye are full of hypocrisy and iniquity.
29 Woe unto you, scribes and Pharisees, hypocrites! because ye build the tombs of the prophets, and garnish the sepulchres of the righteous,
30 And say, If we had been in the days of our fathers, we would not have been partakers with them in the blood of the prophets.
31 Wherefore ye be witnesses unto yourselves, that ye are the children of them which killed the prophets.
32 Fill ye up then the measure of your fathers.
33 Ye serpents, ye generation of vipers, how can ye escape the damnation of hell?
34 Wherefore, behold, I send unto you prophets, and wise men, and scribes: and some of them ye shall kill and crucify; and some of them shall ye scourge in your synagogues, and persecute them from city to city:
35 That upon you may come all the righteous blood shed upon the earth, from the blood of righteous Abel unto the blood of Zacharias son of Barachias, whom ye slew between the temple and the altar.
36 Verily I say unto you, All these things shall come upon this generation.
37 O Jerusalem, Jerusalem, thou that killest the prophets, and stonest them which are sent unto thee, how often would I have gathered thy children together, even as a hen gathereth her chickens under her wings, and ye would not!
Do you think Jesus was just limiting his wrath against that specific generation of Jews when he blamed them for the blood of Abel and all the blood upon the earth in verse 35 above??? No! He was warning the world that those who follow in the footsteps of the Pharisaical leaders (children of the devil who reconfigured themselves into Judaism after the destruction of the temple in 70 A.D.) against taking up “the way of Cain”.
“Ye serpents, ye generation of vipers, how can ye escape the damnation of hell?”
Do you actually think Jesus will go any easier on this generation of wicked people ushering in the very antichrist and persecuting and killing the sons of God – saved Christians – en masse?
His Blood Be on Us, and on Our Children | Pastor Anderson – YouTube
It doesn’t happen often that Jews convert to Christianity. The “messianic” Jews who retain their “Jewishness” – which again is not a race but it’s a religion – are fake Christian’s mostly wolves in sheep’s clothing for the most part. If you are unwilling to stop being a “Jew” then you aren’t a Christian either.
ITS JESUS NOT YESHUA IF YOU SPEAK ENGLISH!
ITS JEHOVAH NOT YAHWEH IF YOU SPEAK ENGLISH!
THOSE WHO DO SO DENY AND DIMINISH JESUS’S NAME.
Jehovah – Joshua – Jesus. The proper English way Jesus’s name is associated and evolved in the King James bible, the only true word of God in English.
Christians don’t wear funny 18th century Polish hats nor have curly locks of hair or pray to a wall.
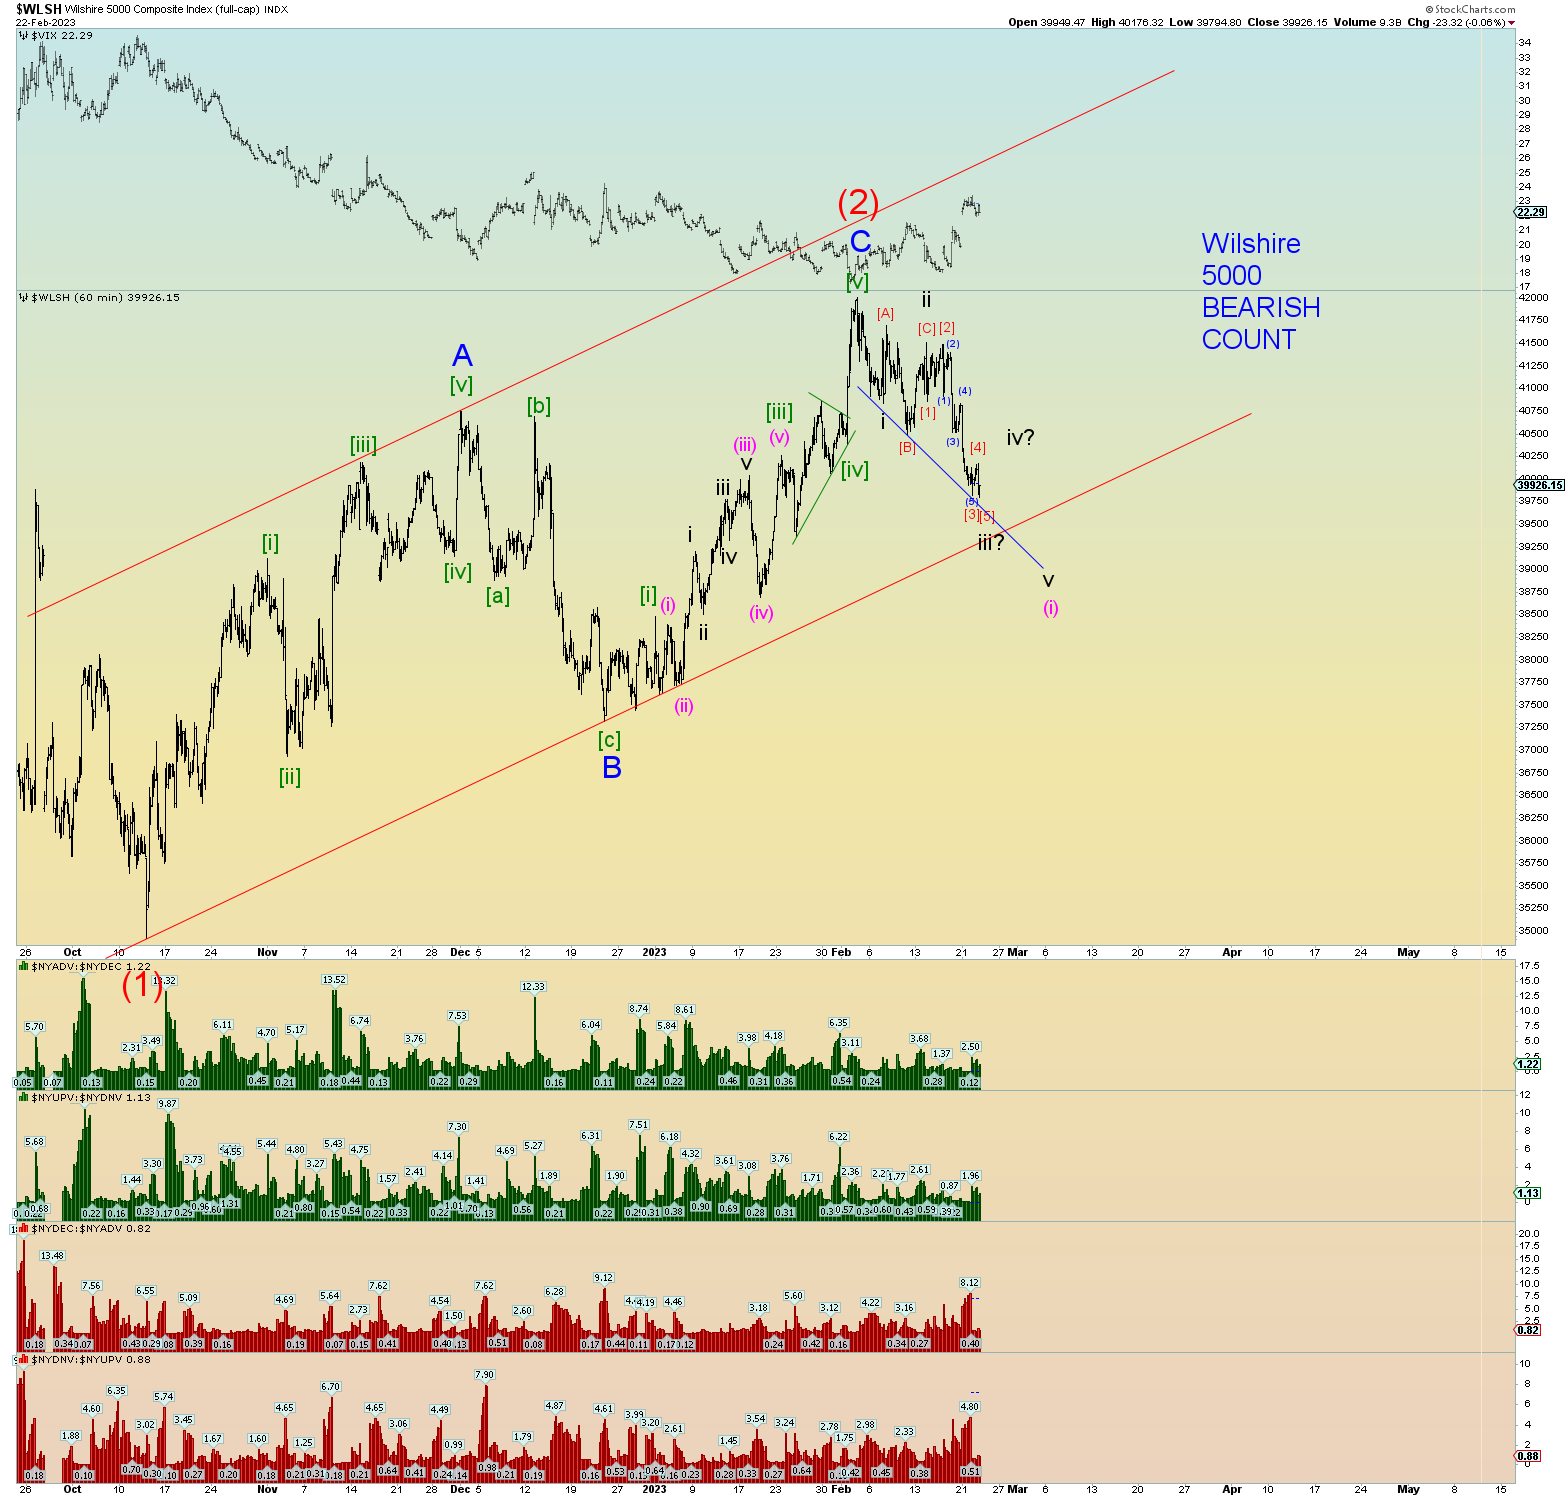
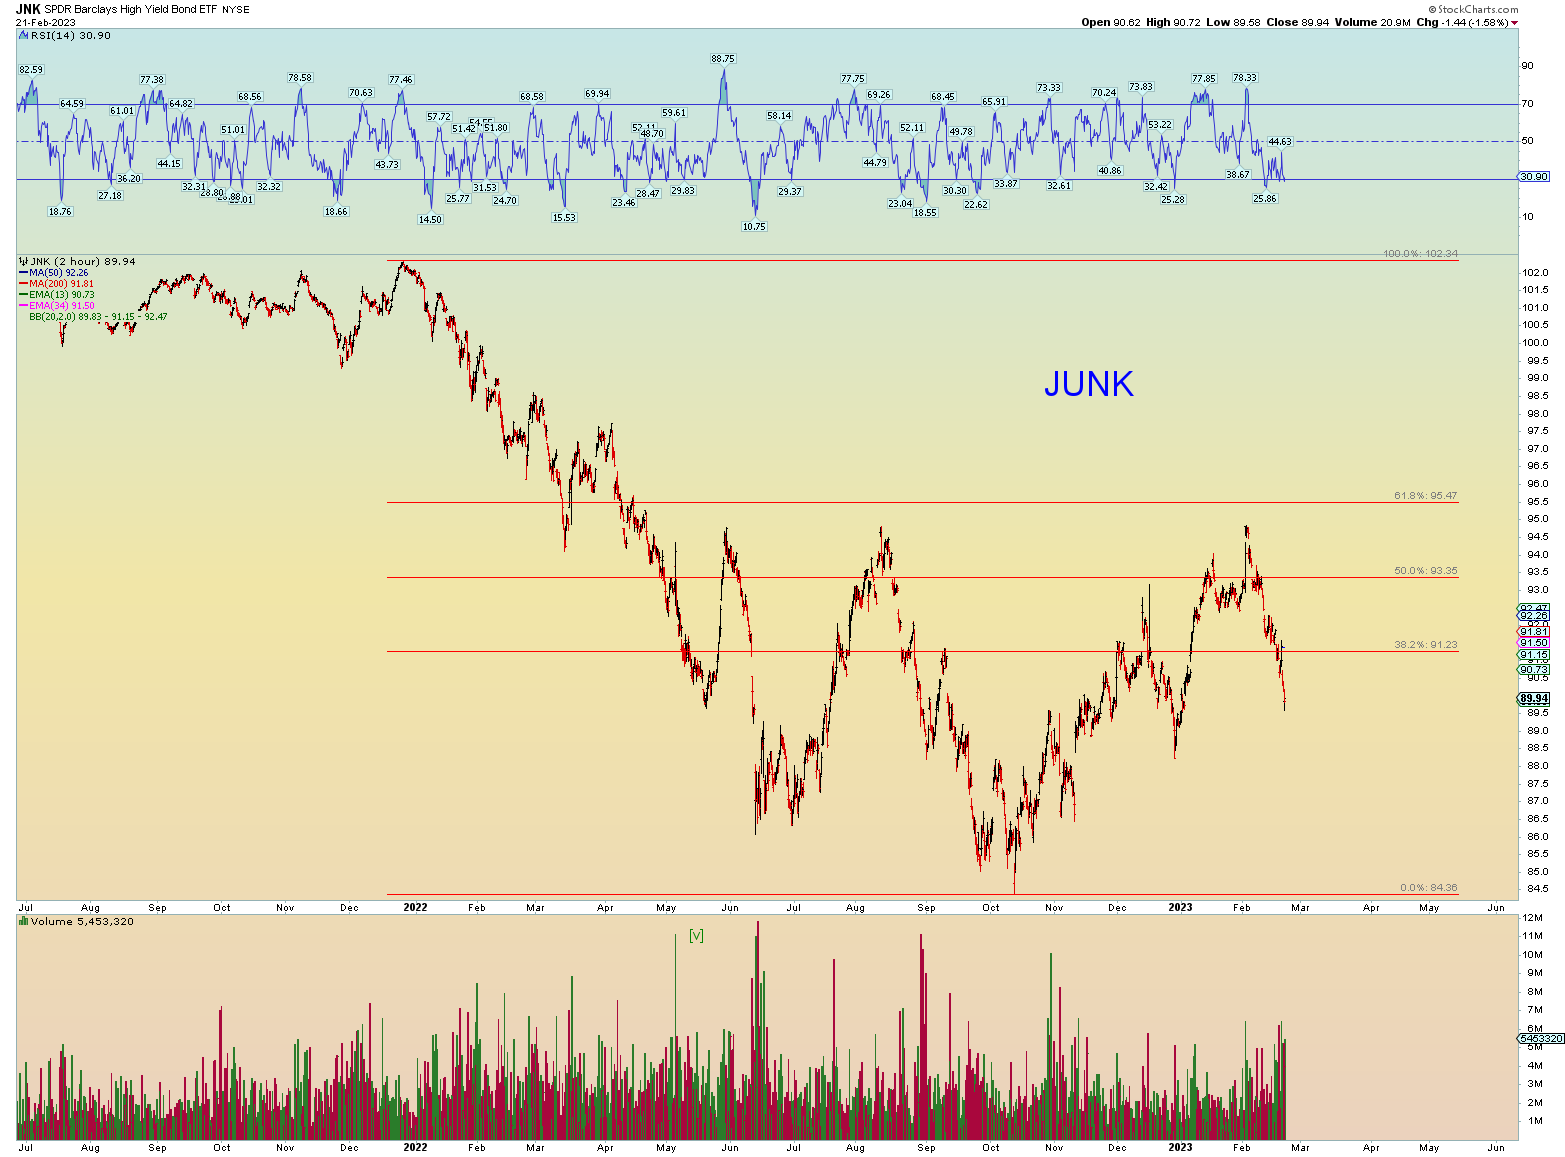
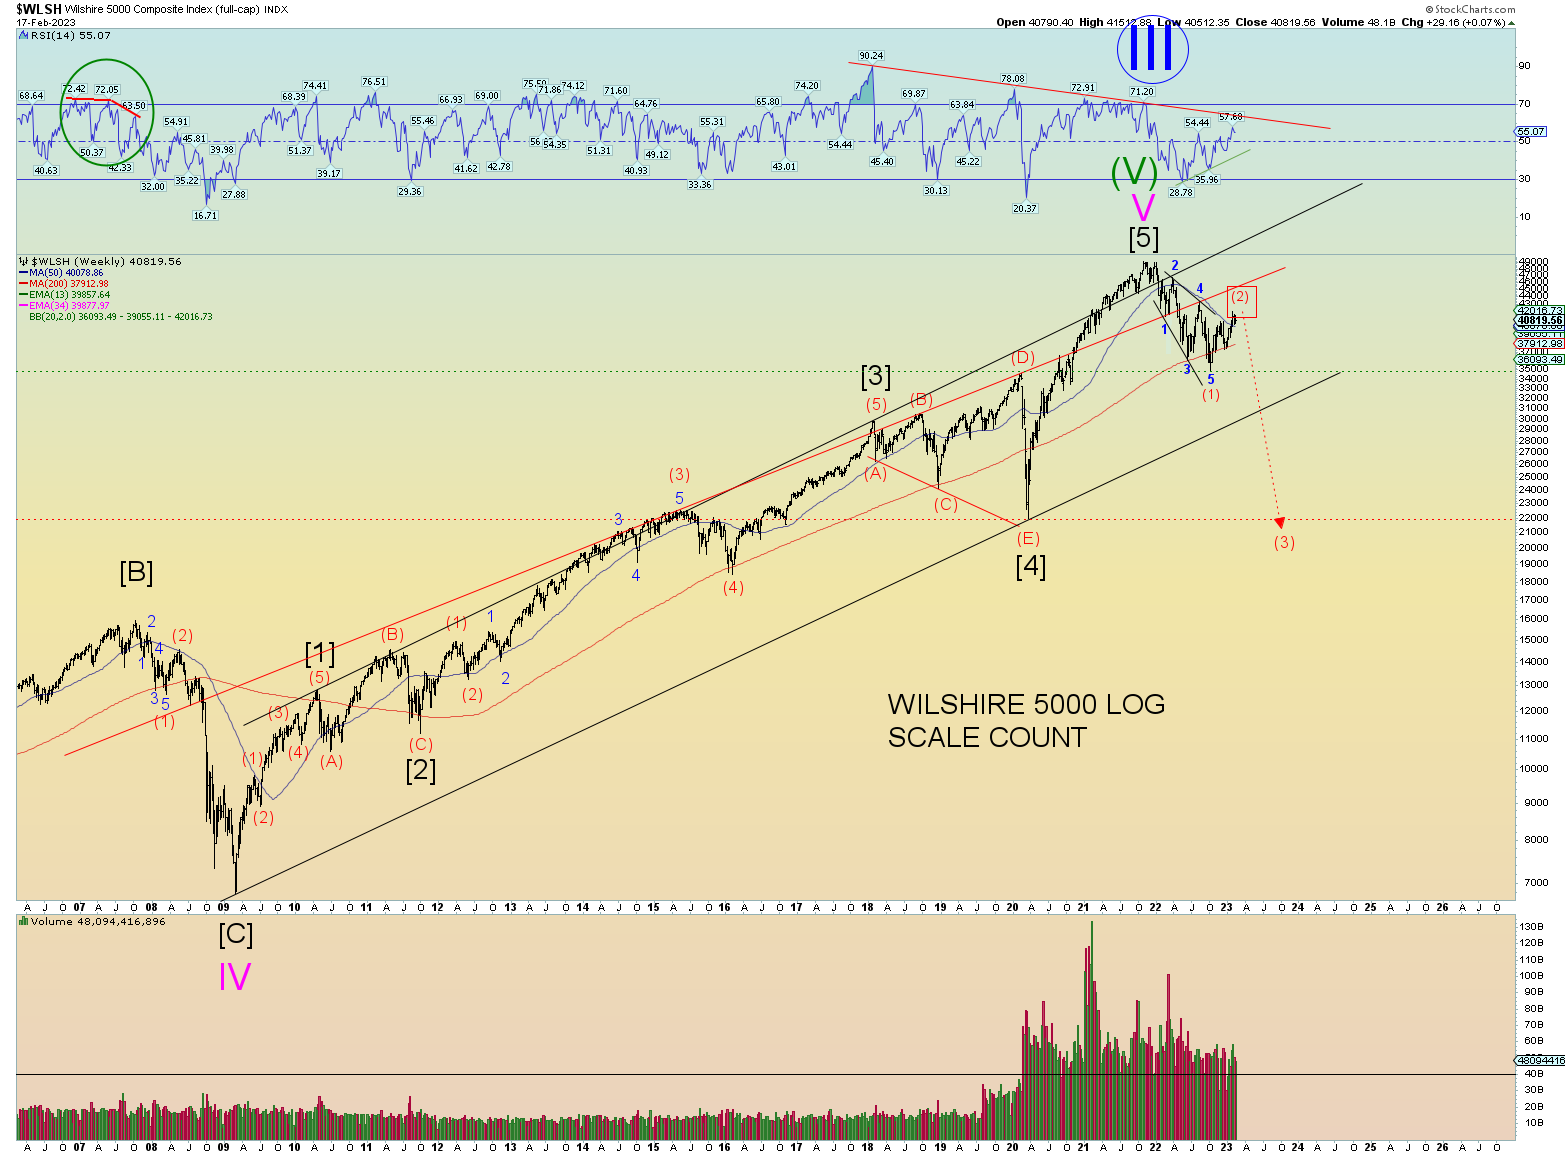
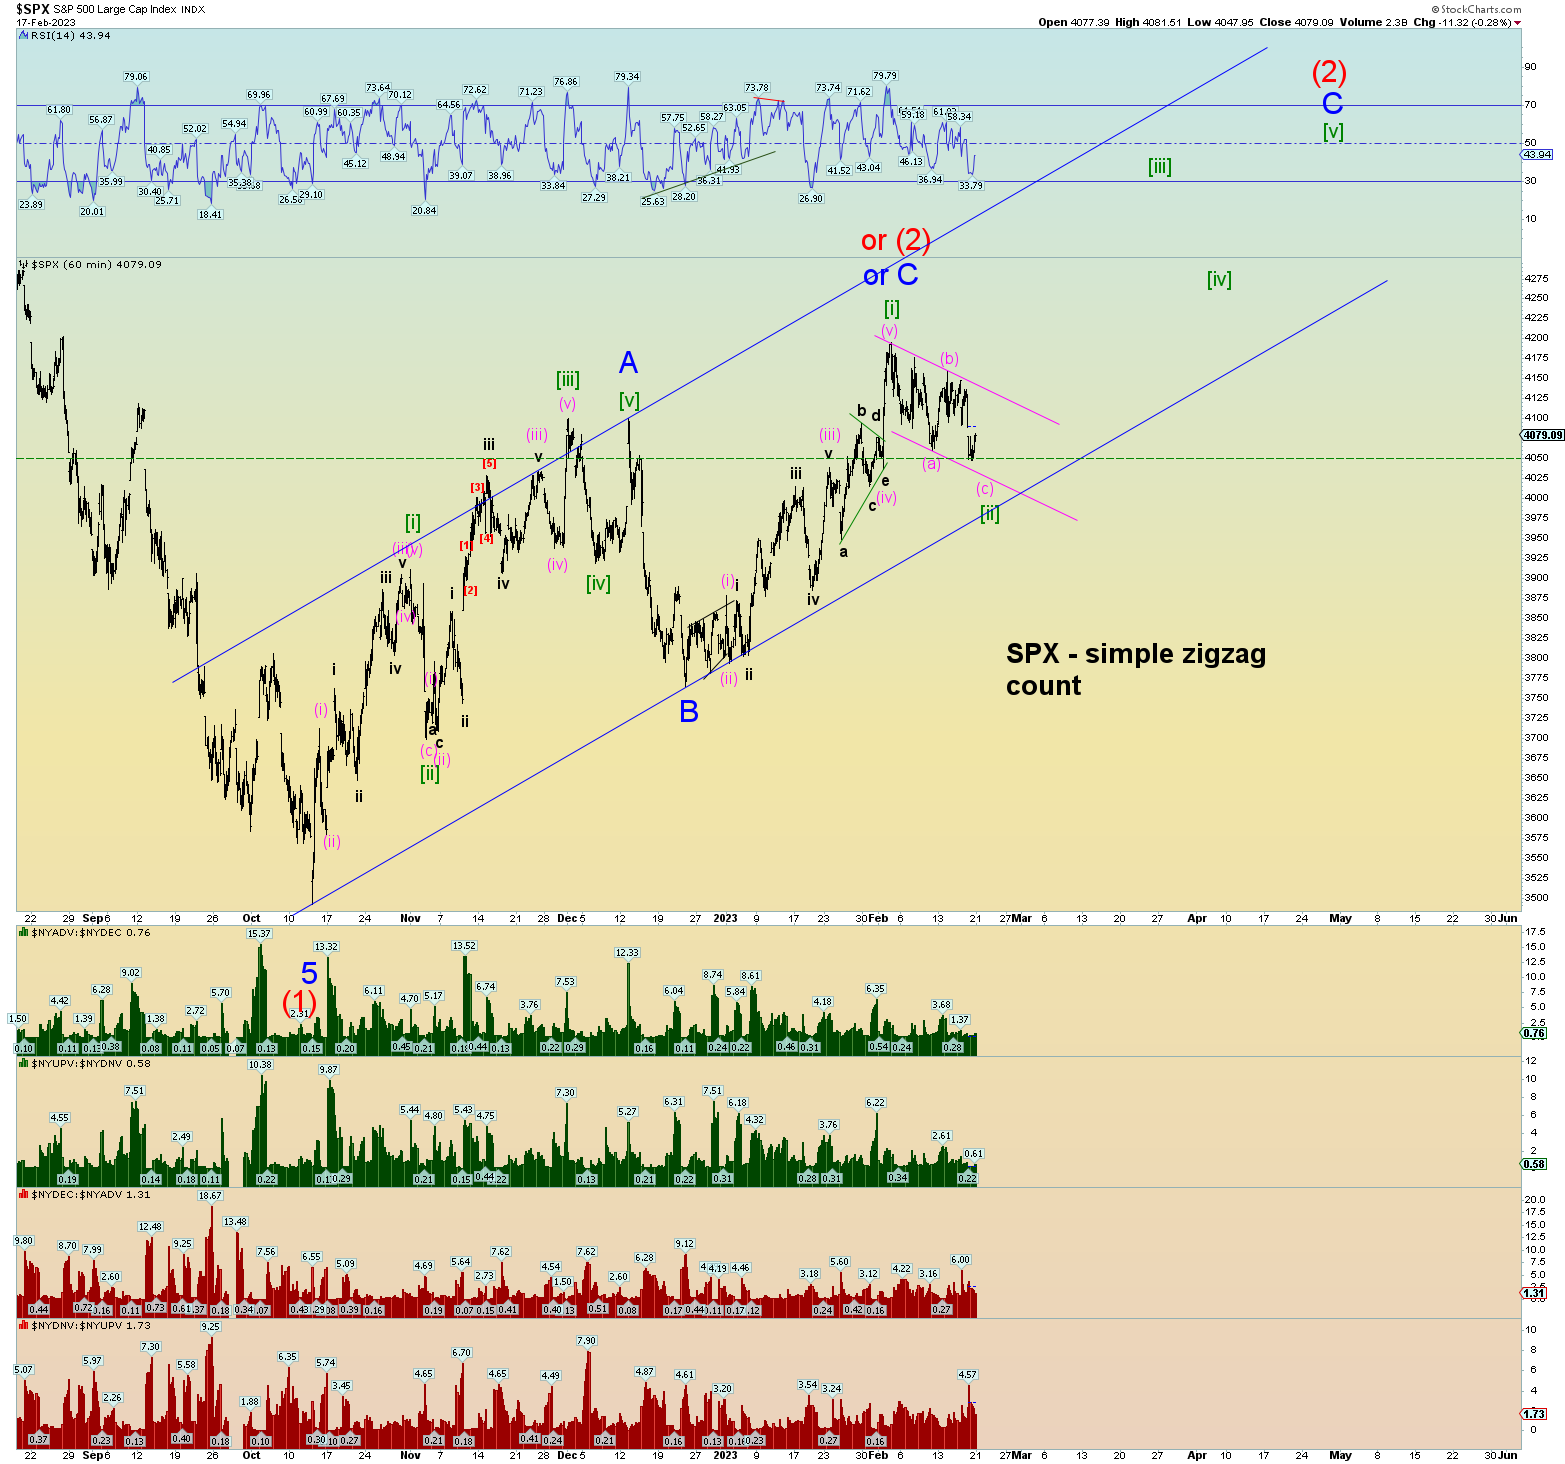
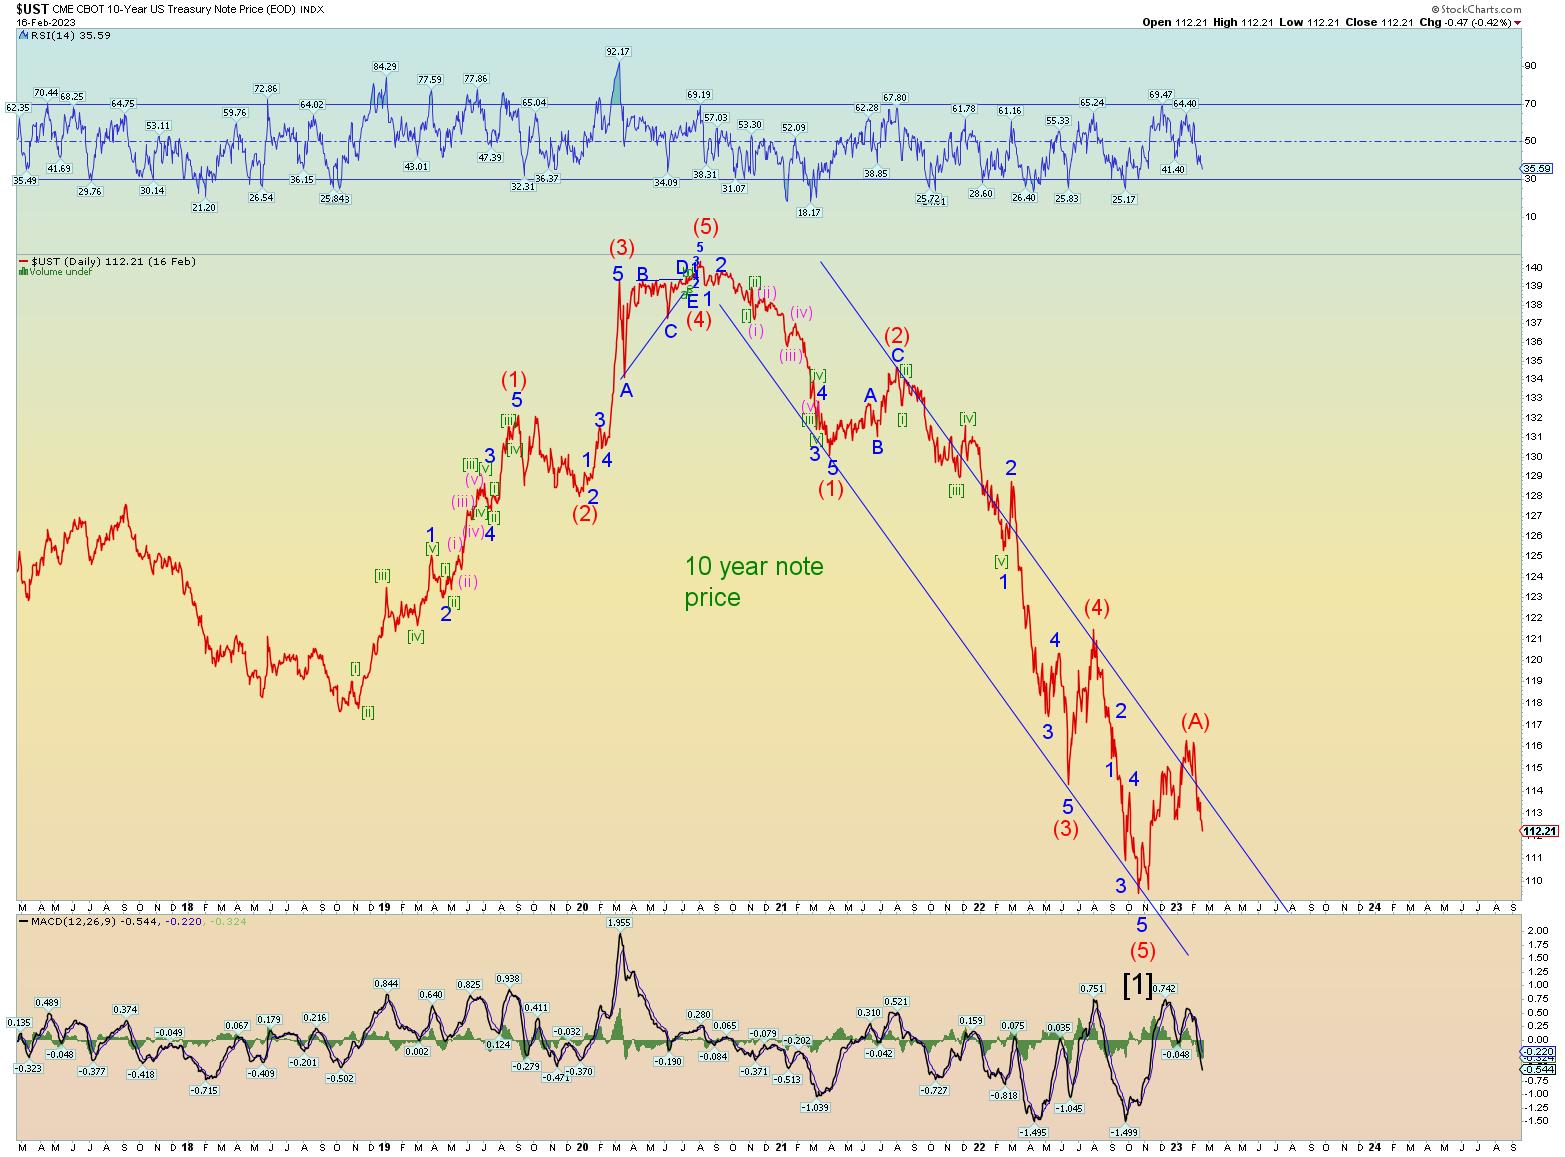
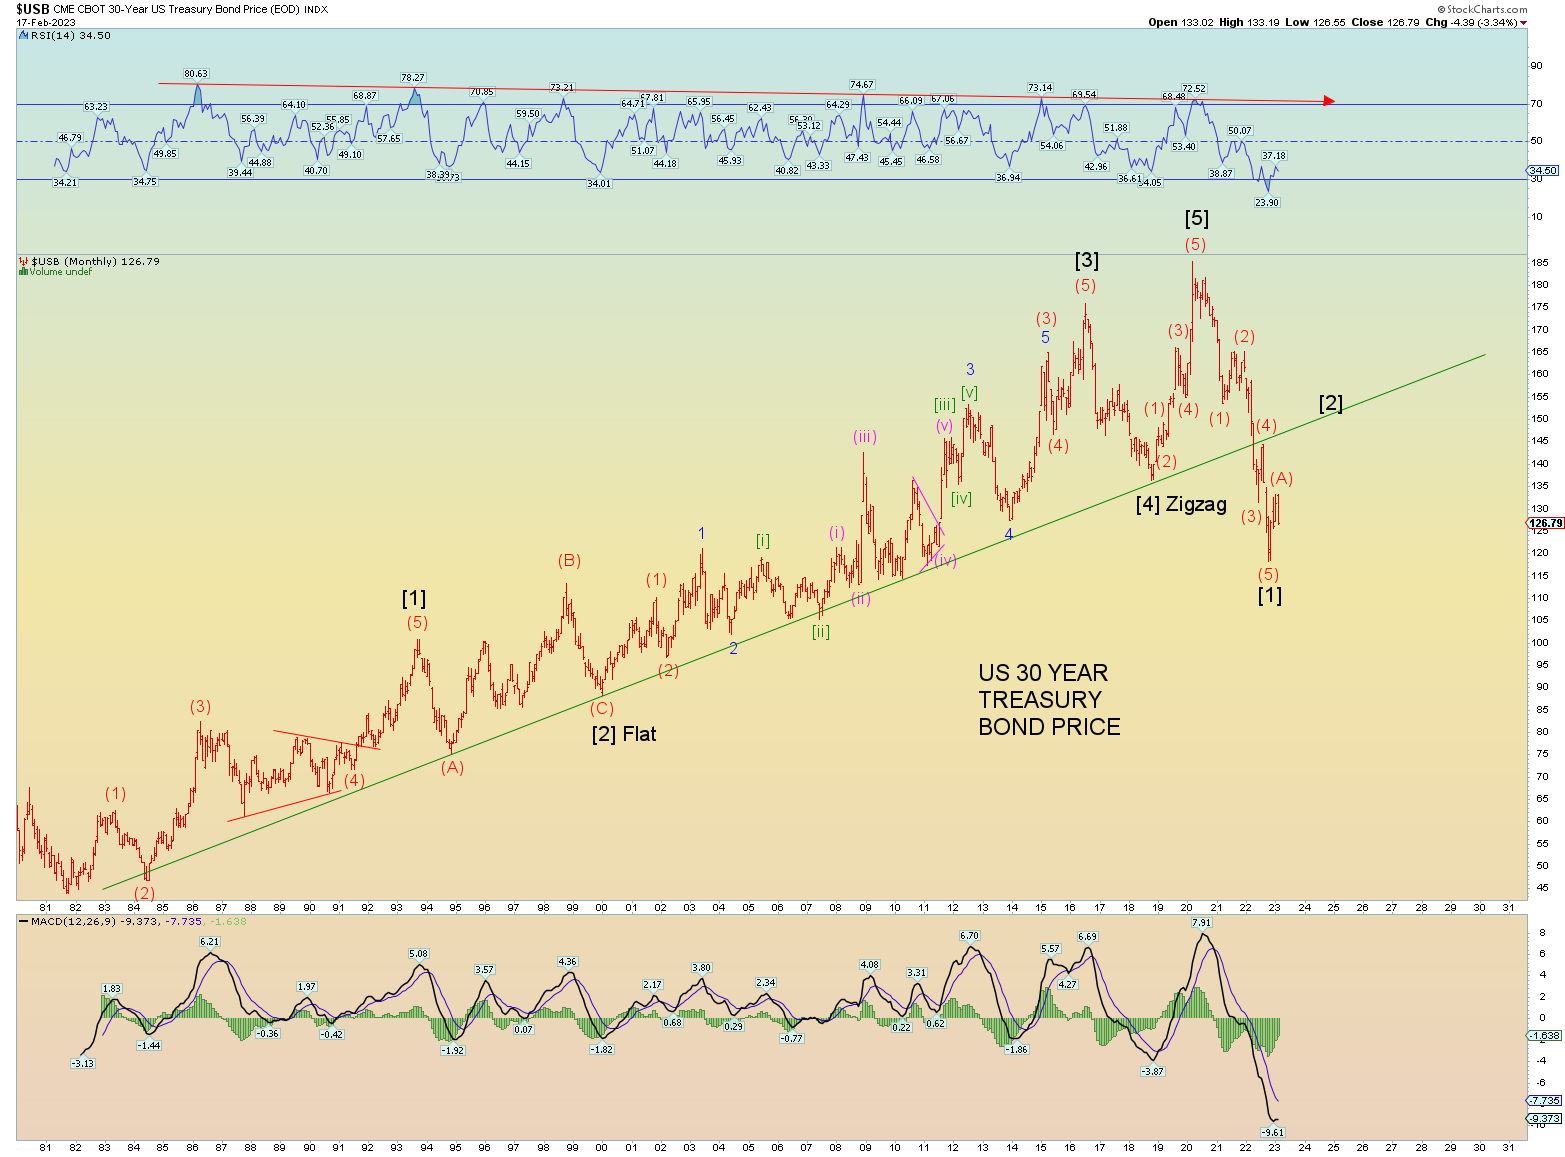
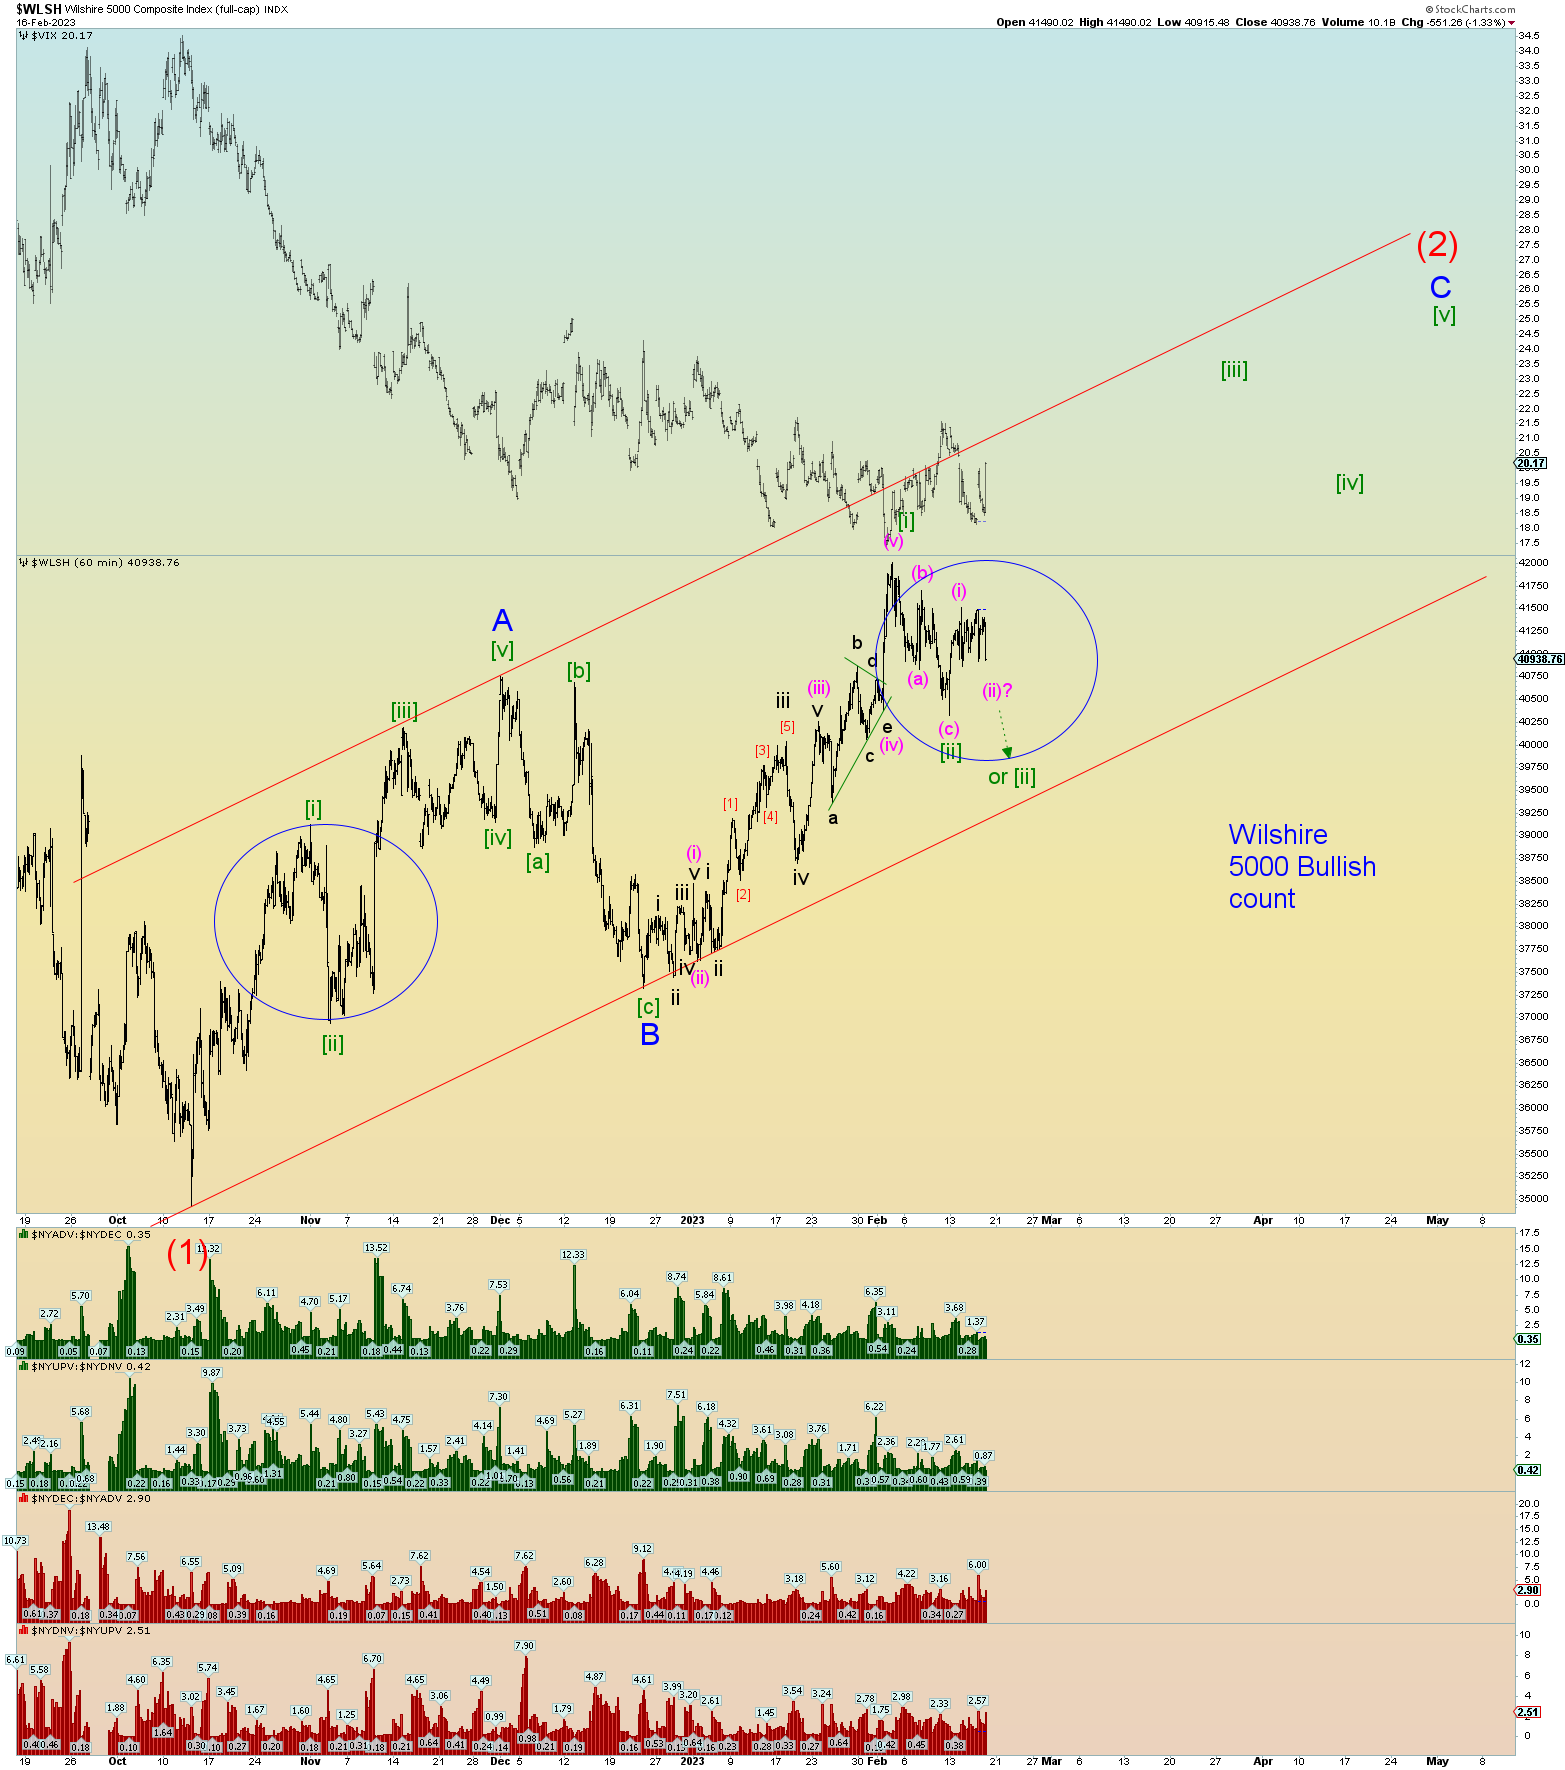
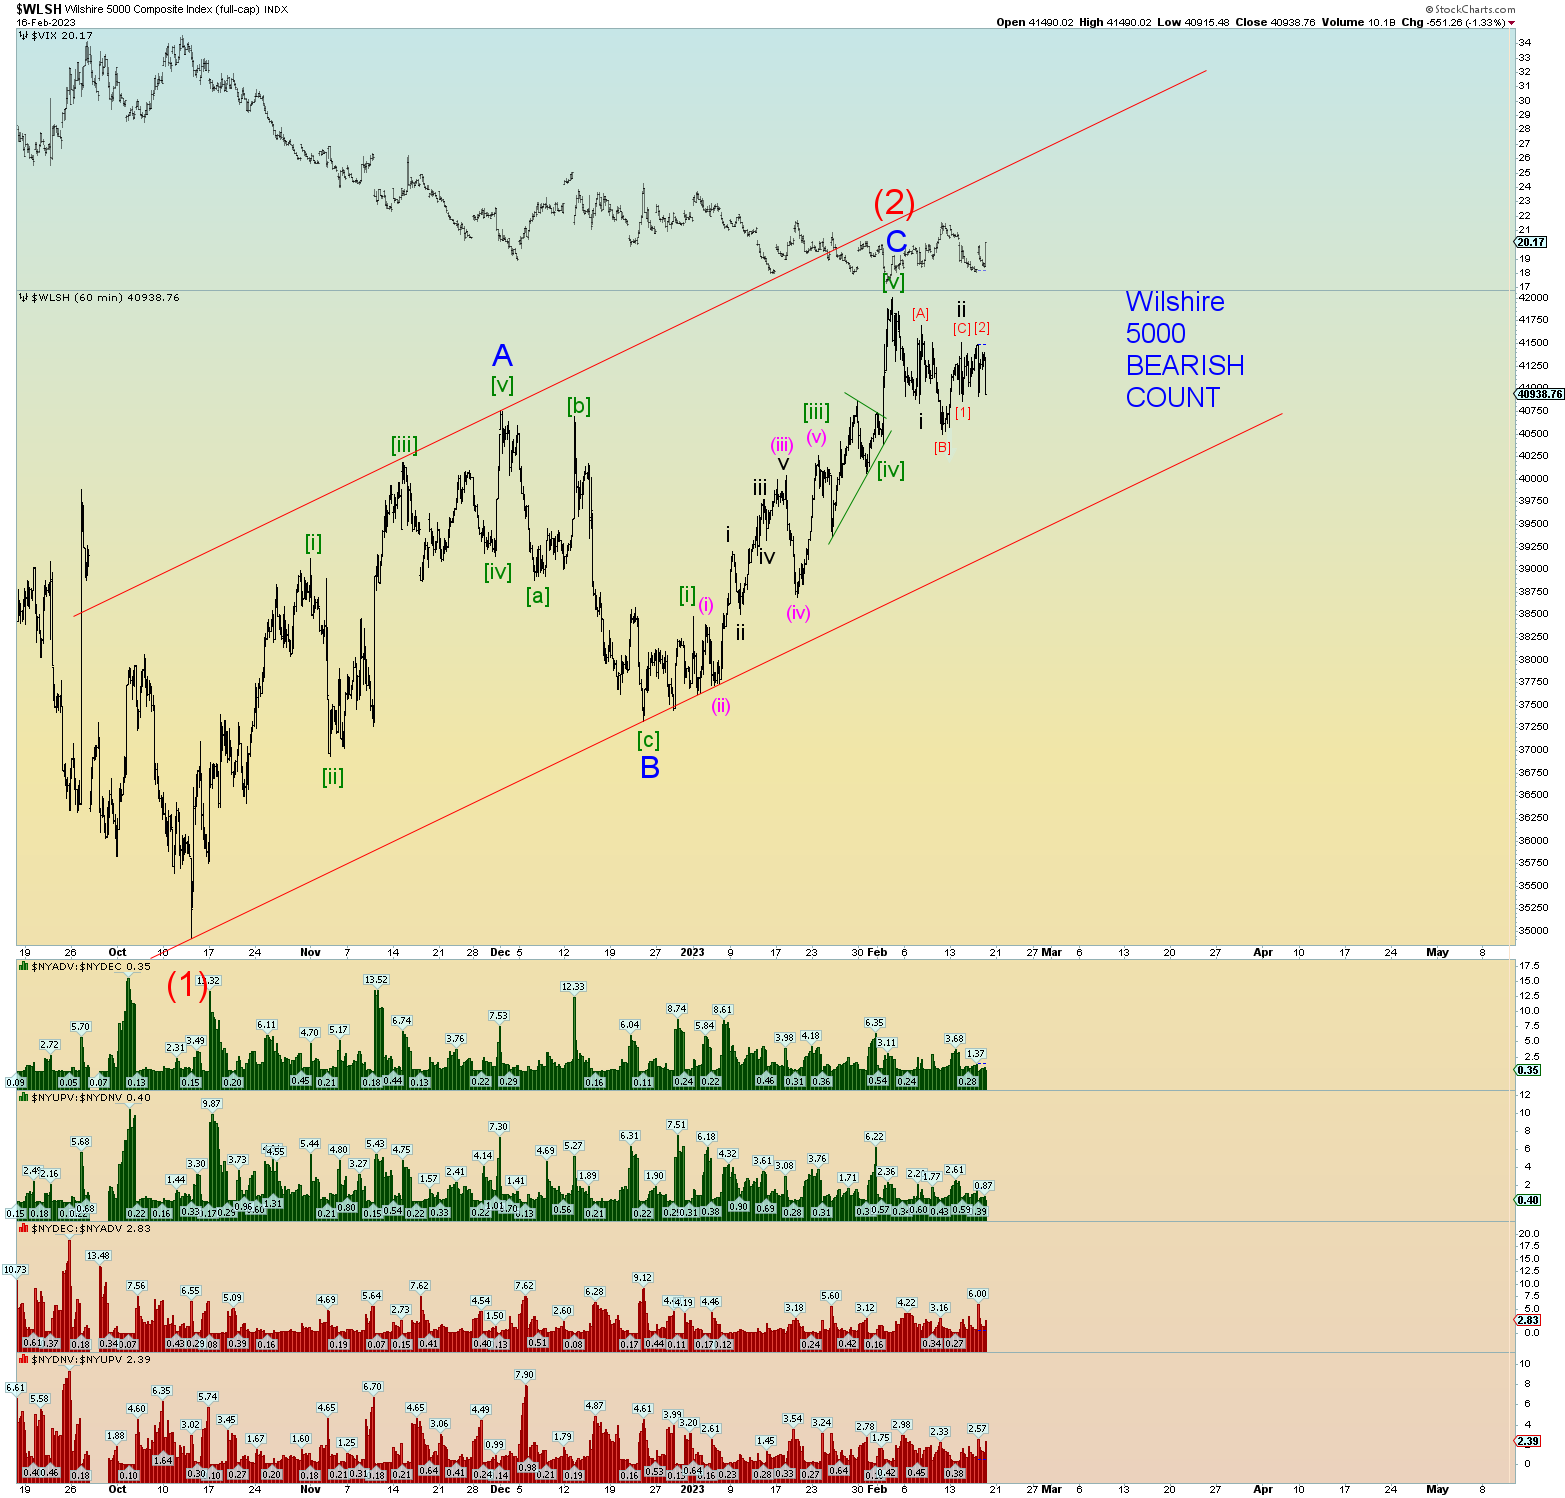
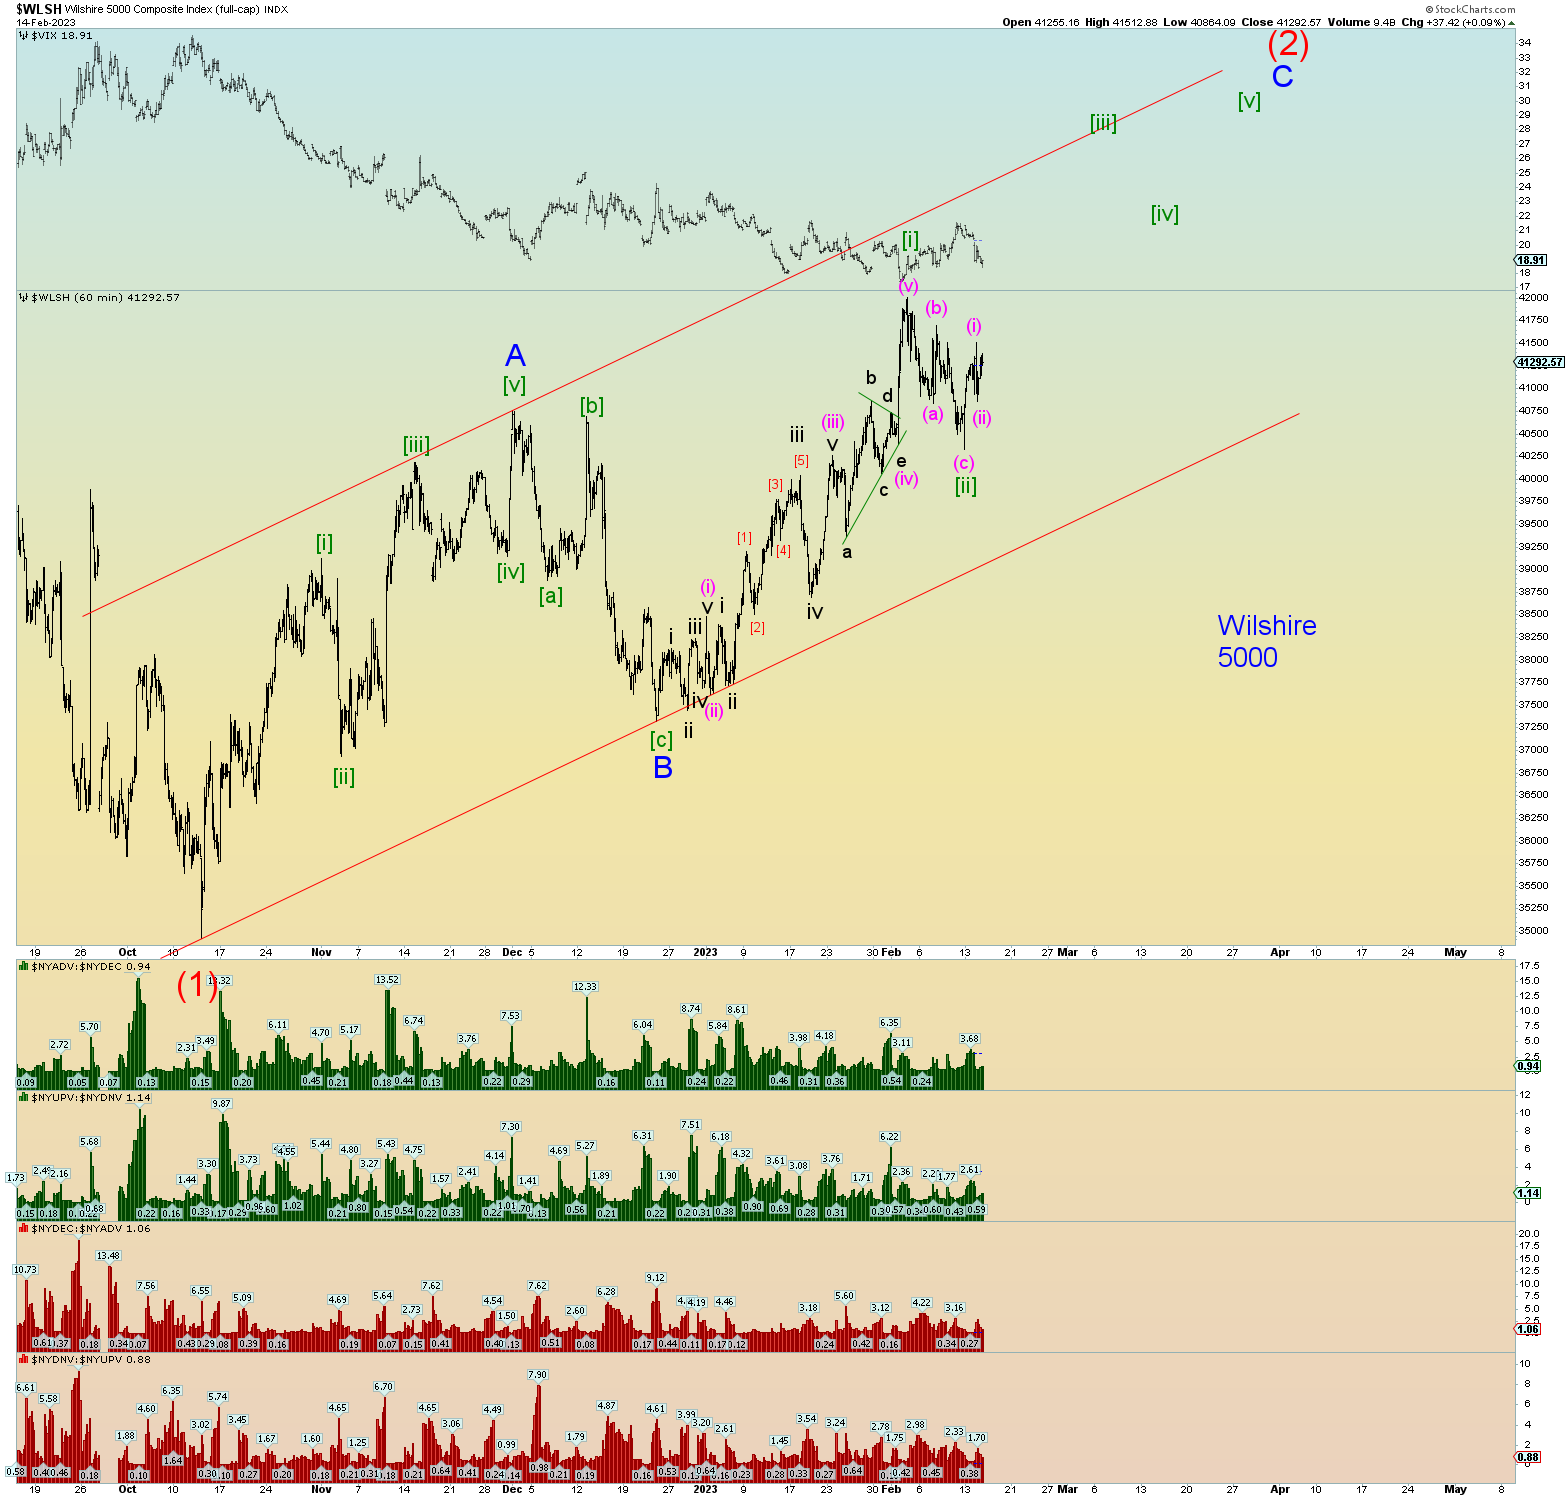
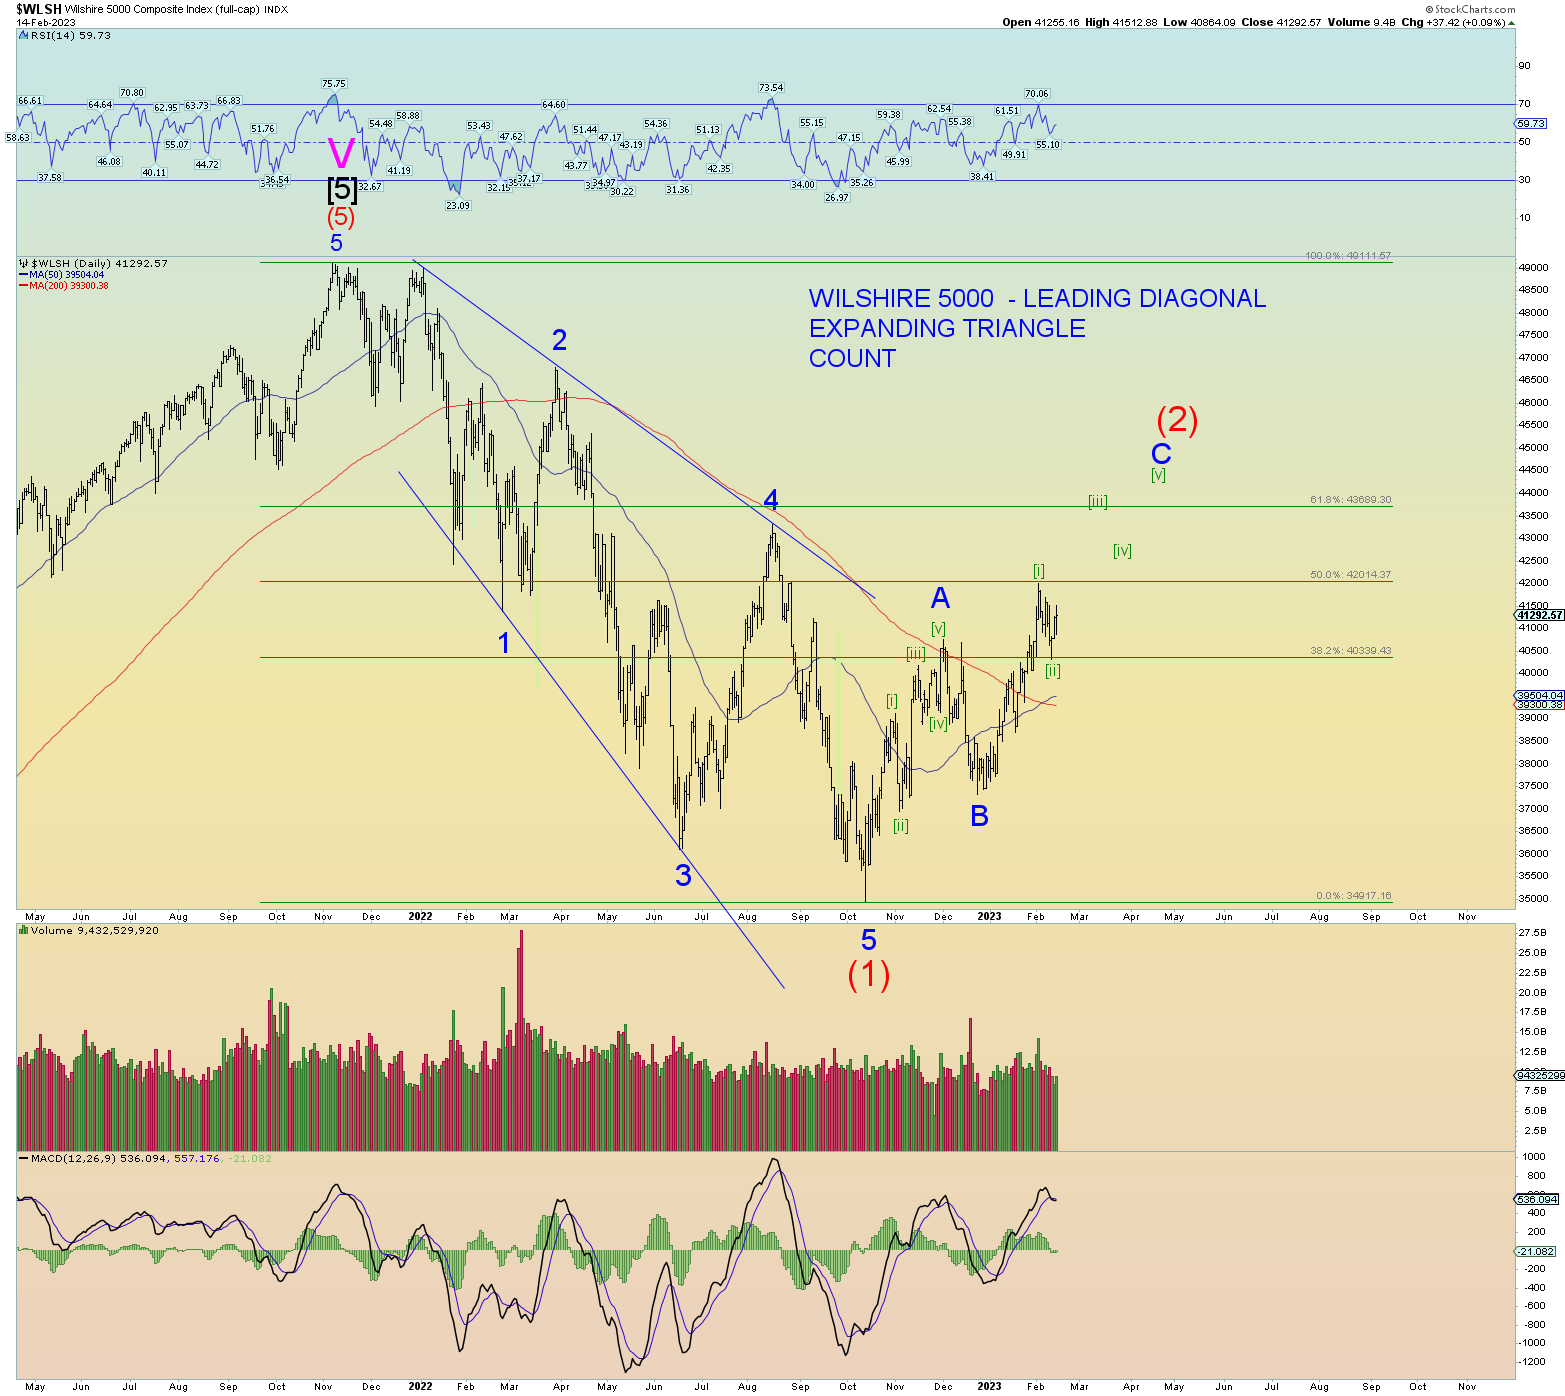
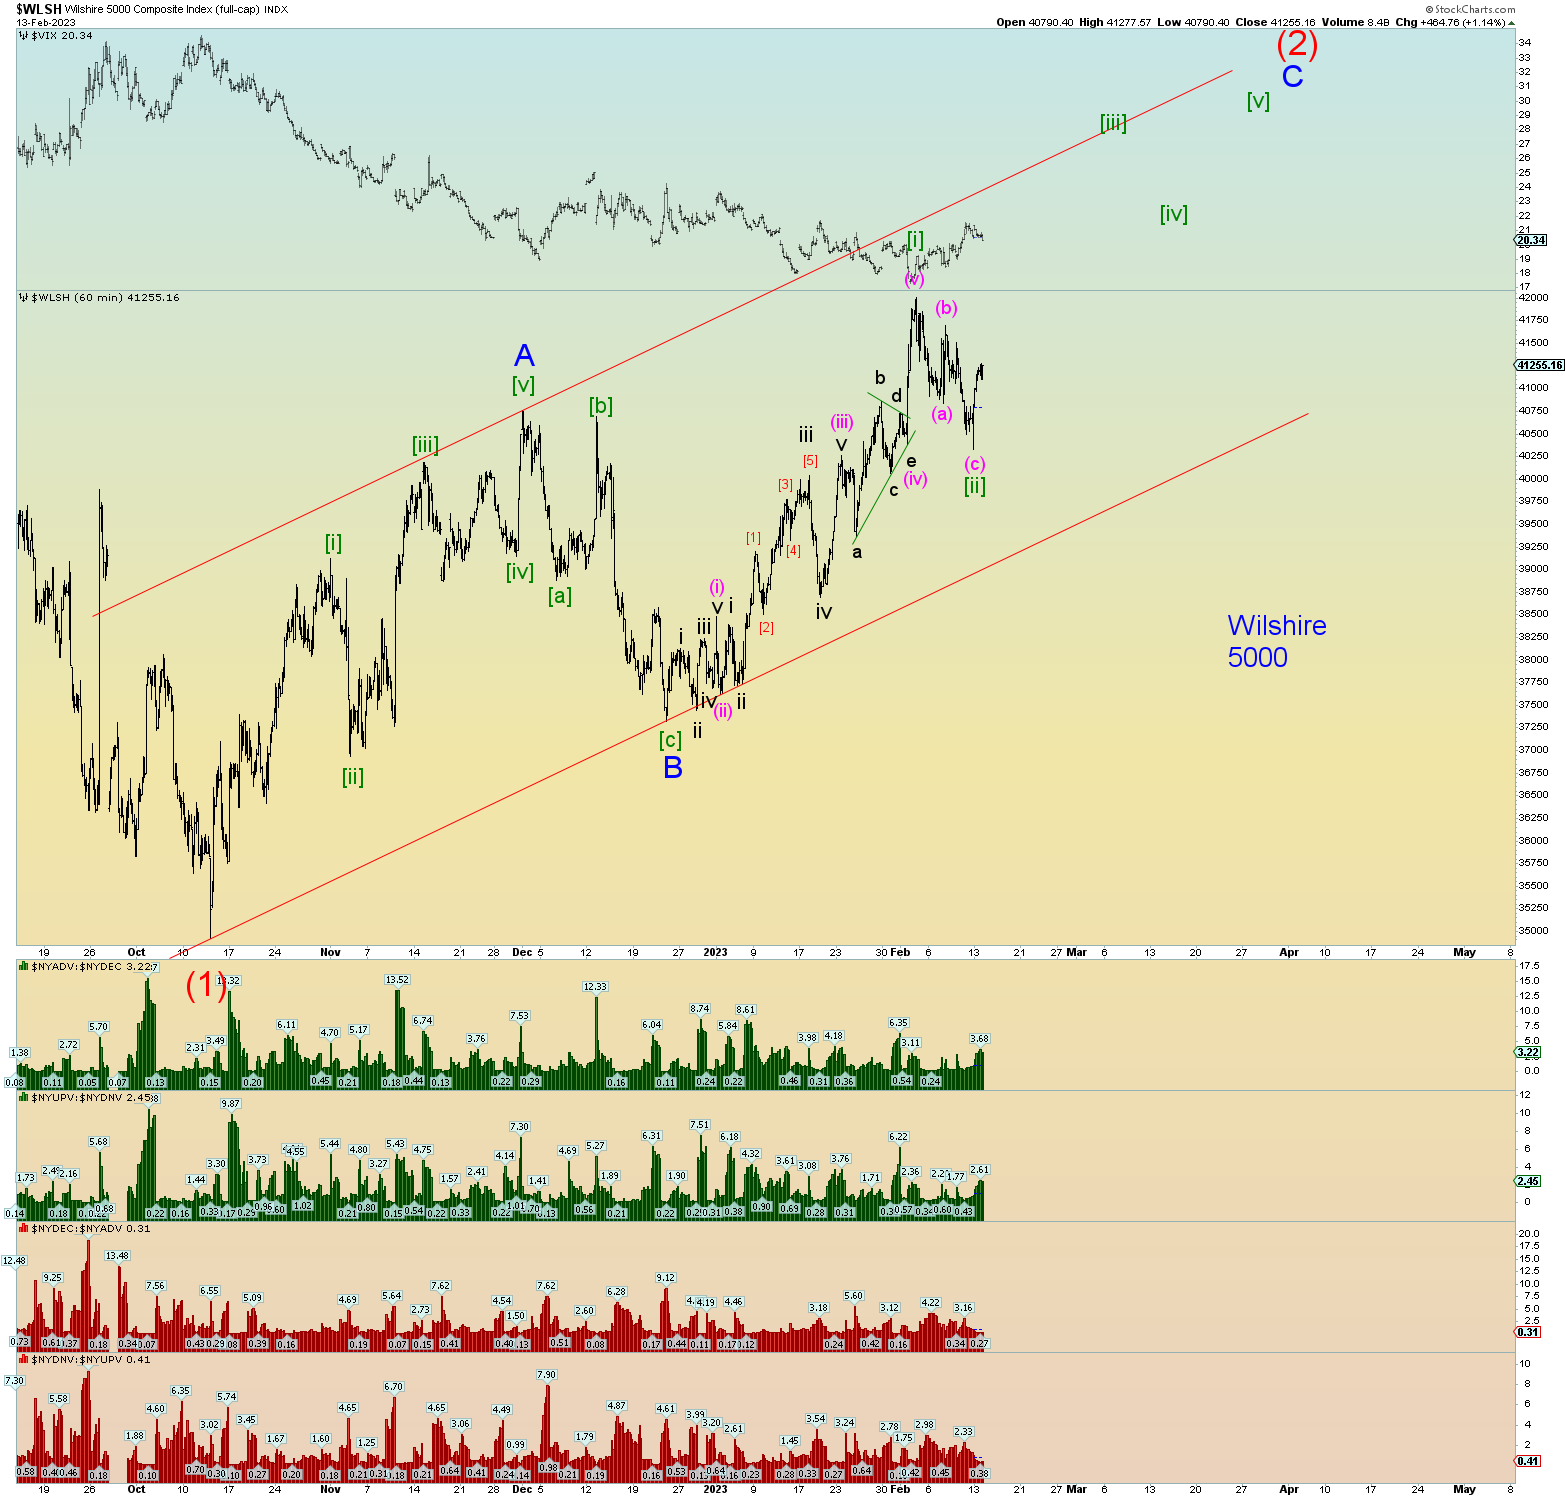
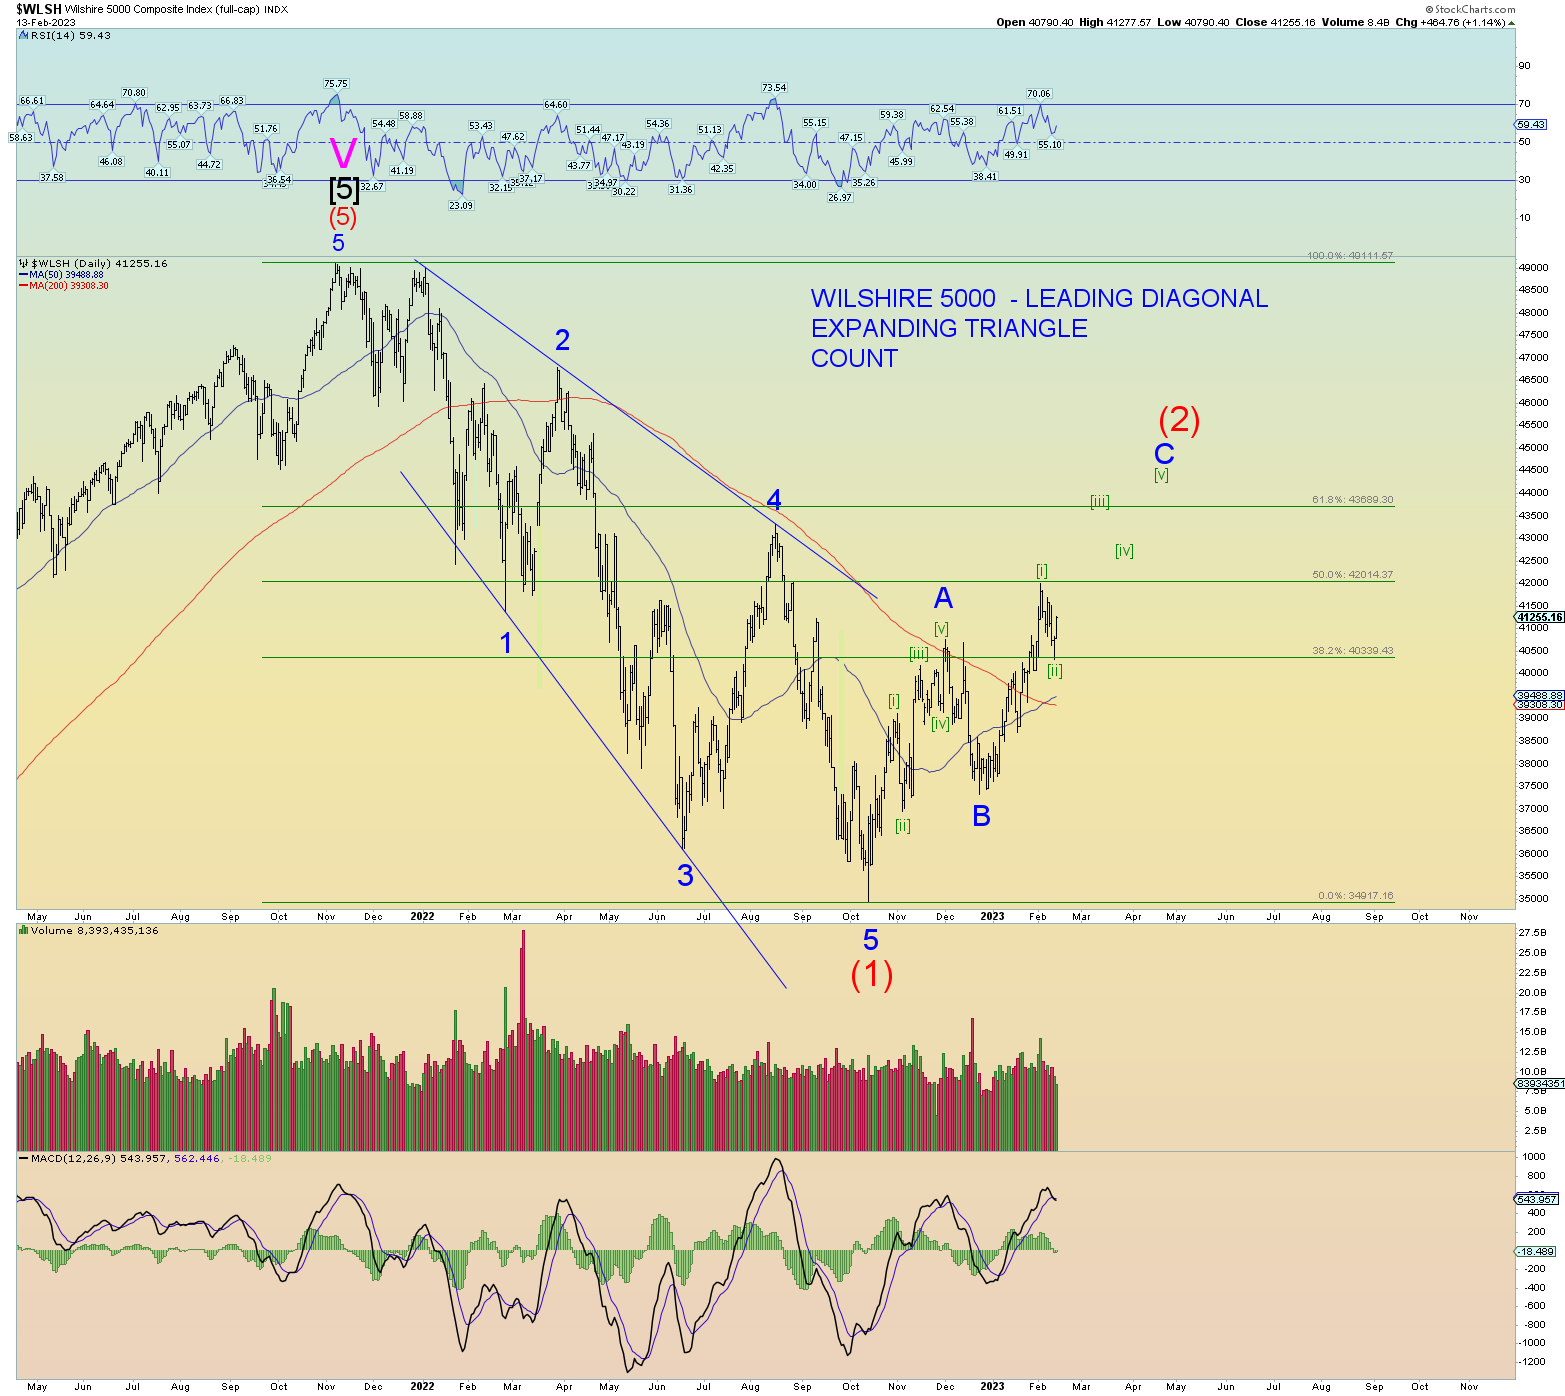
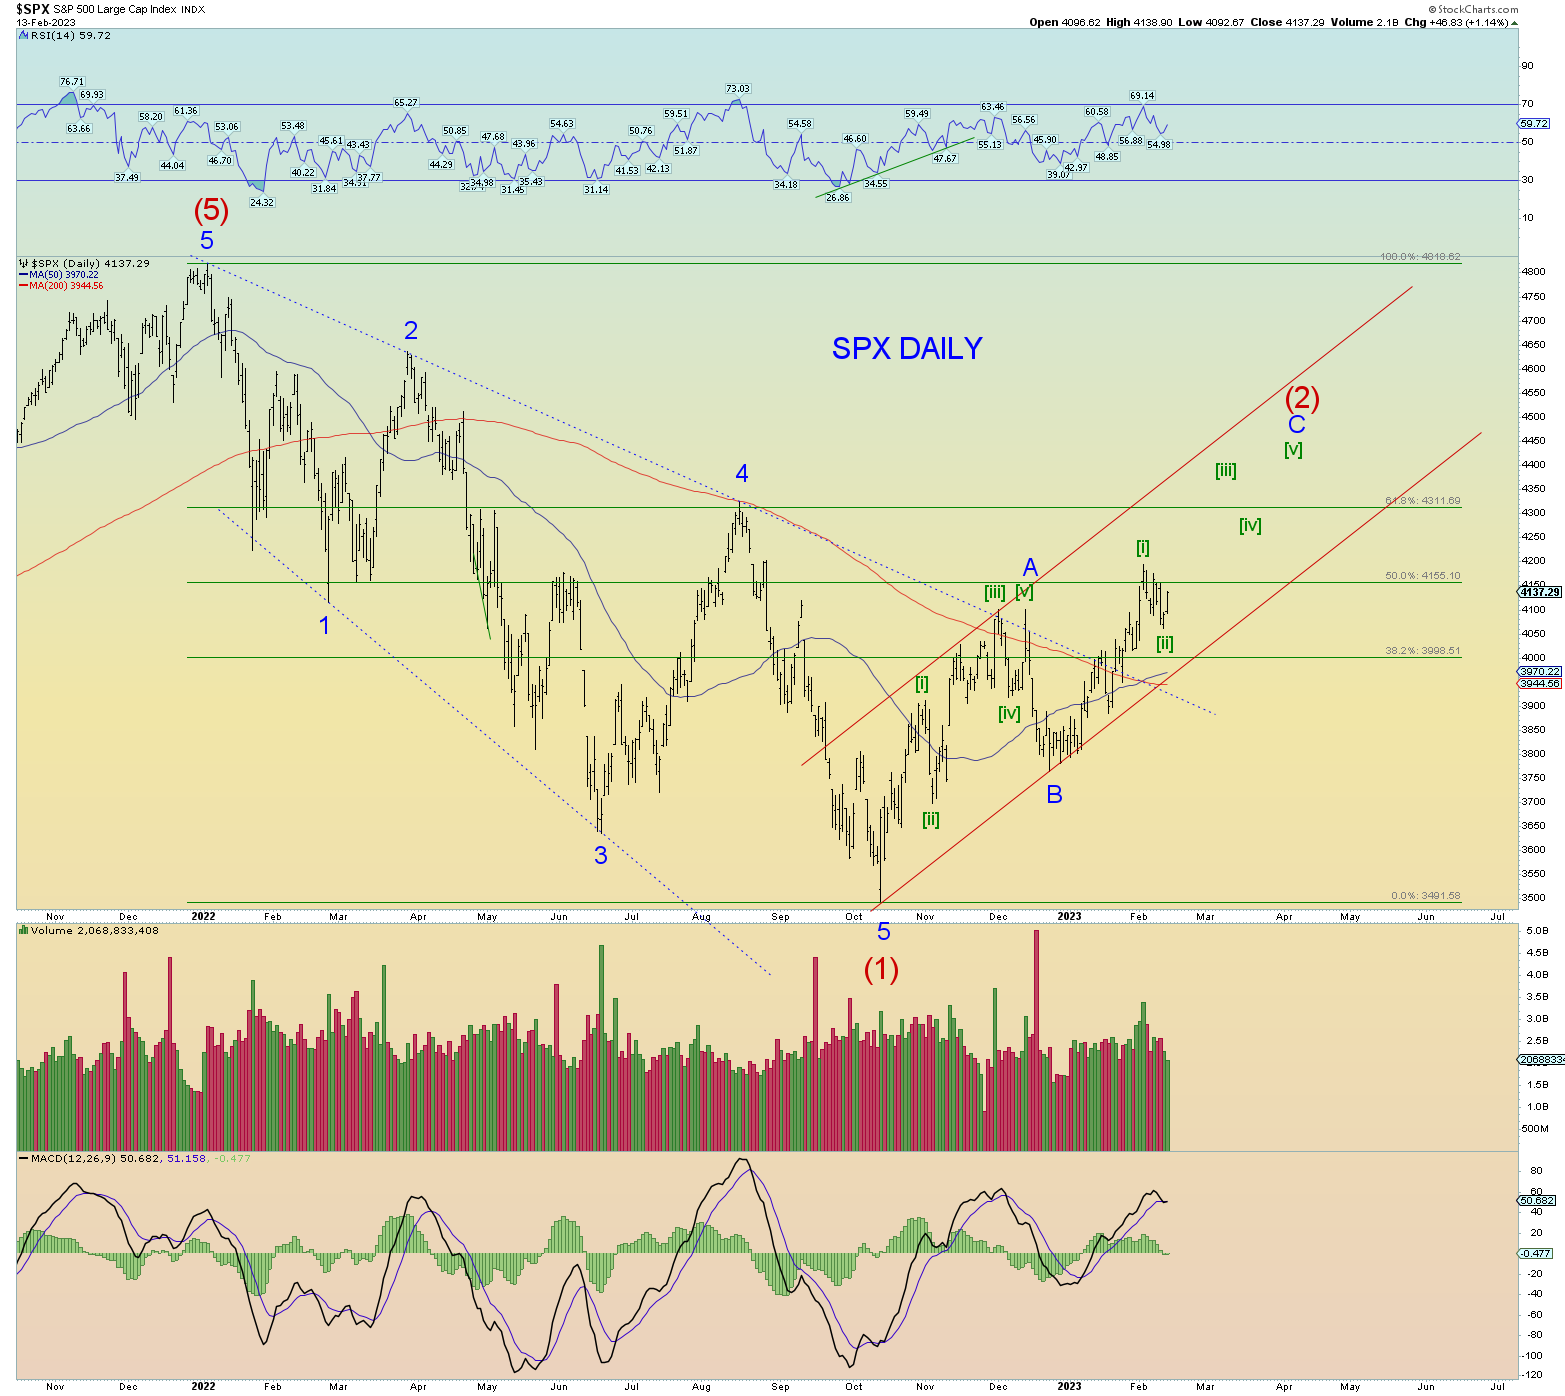
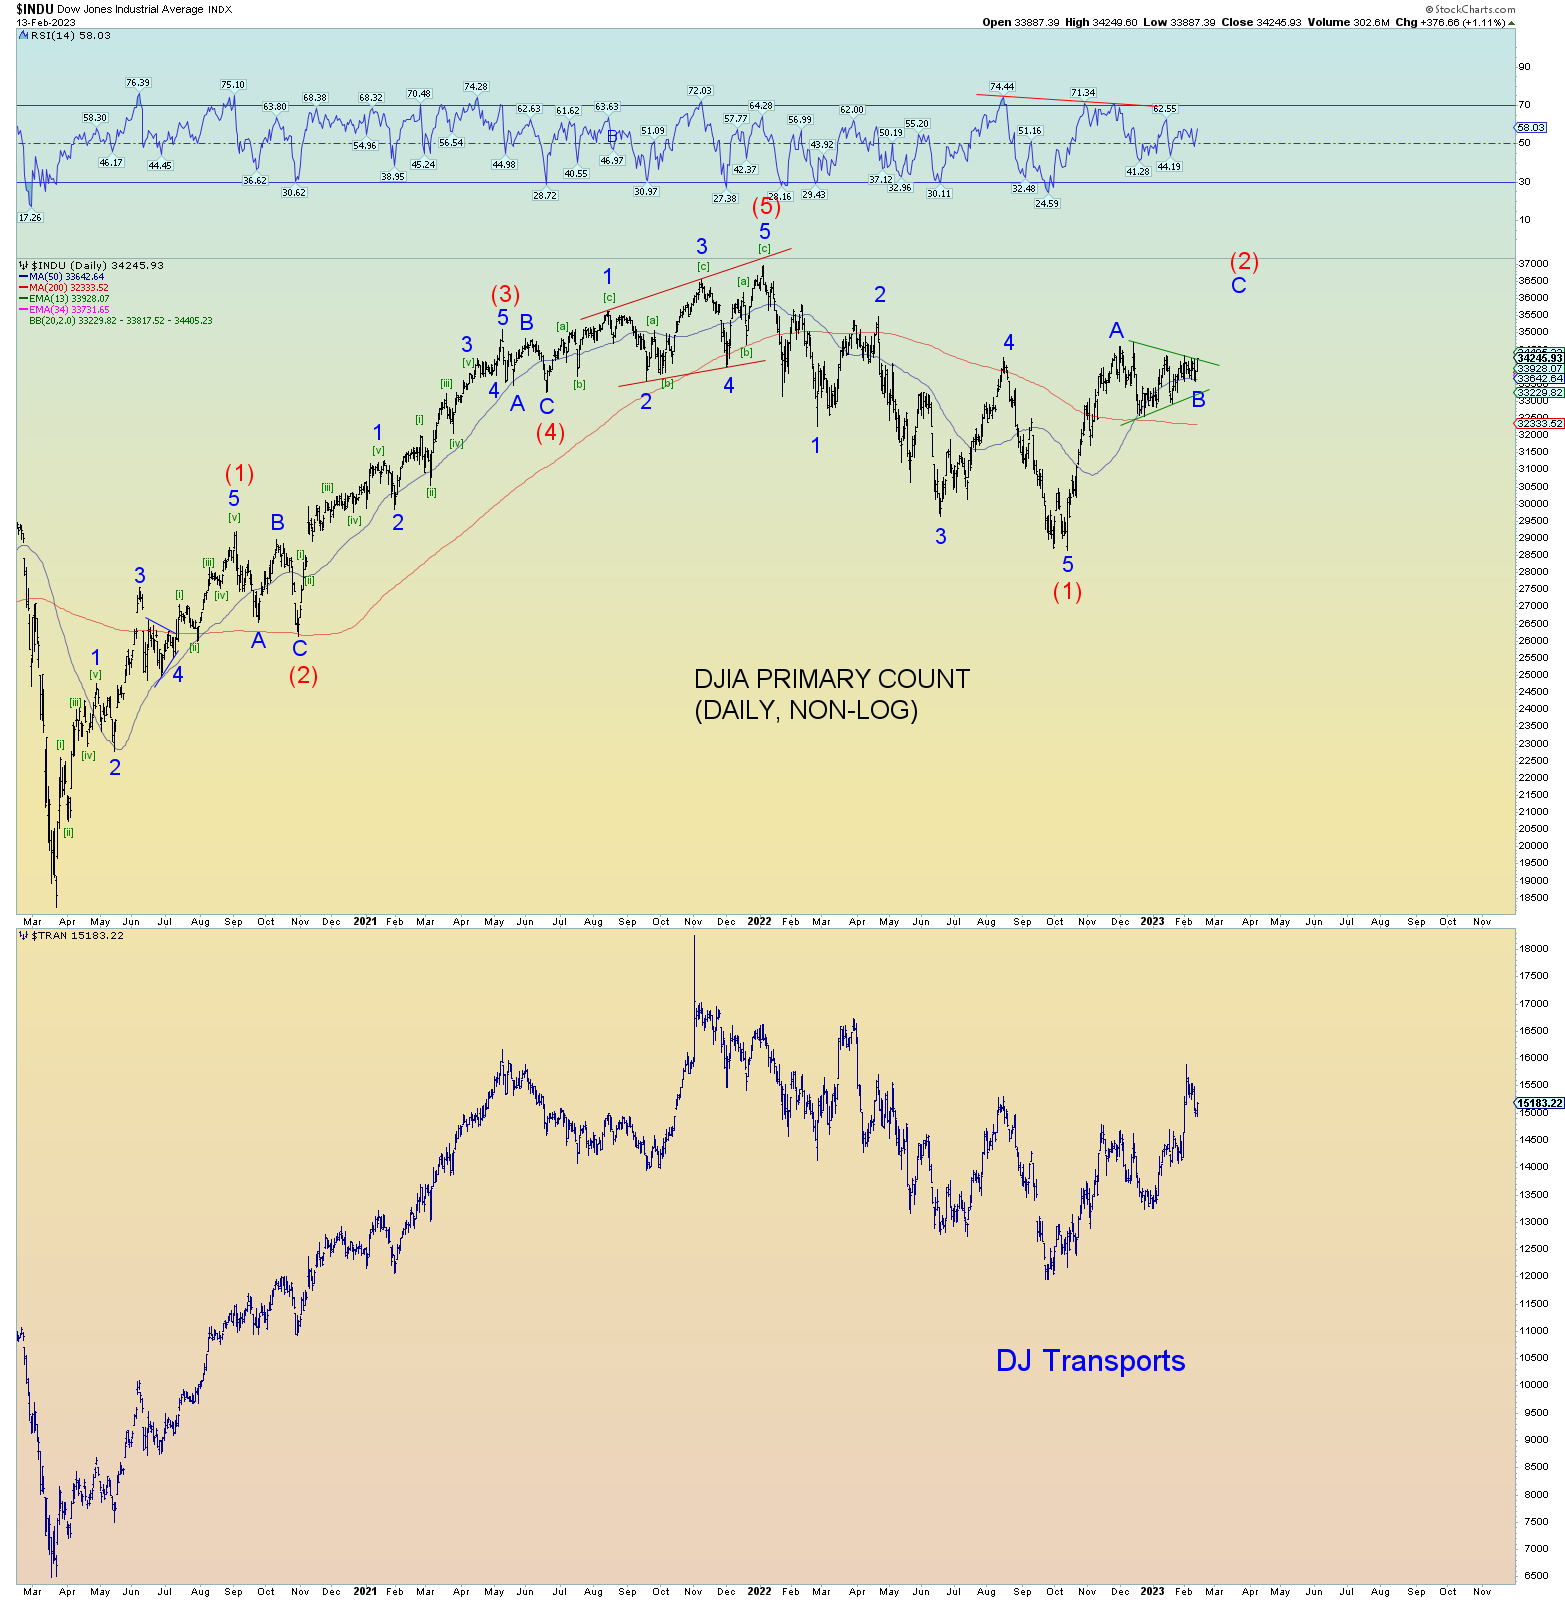
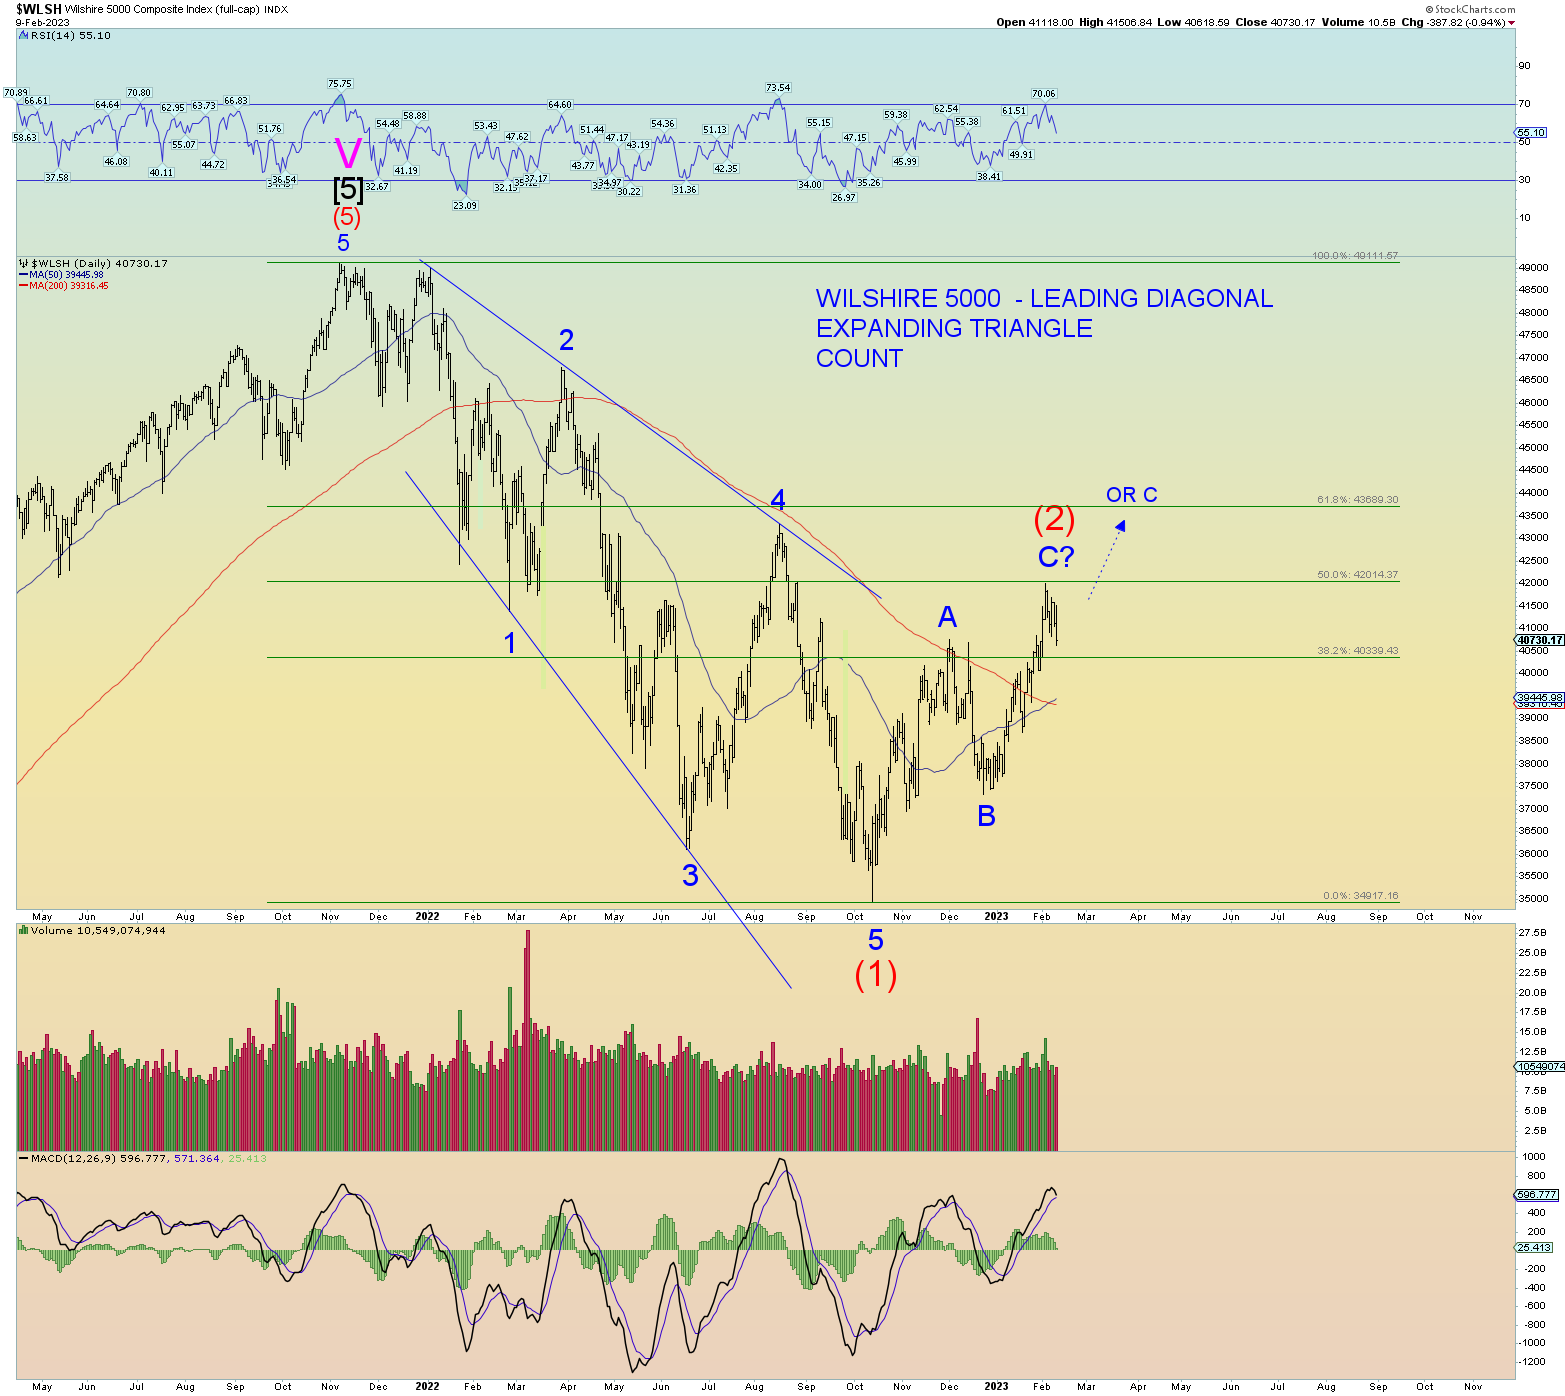
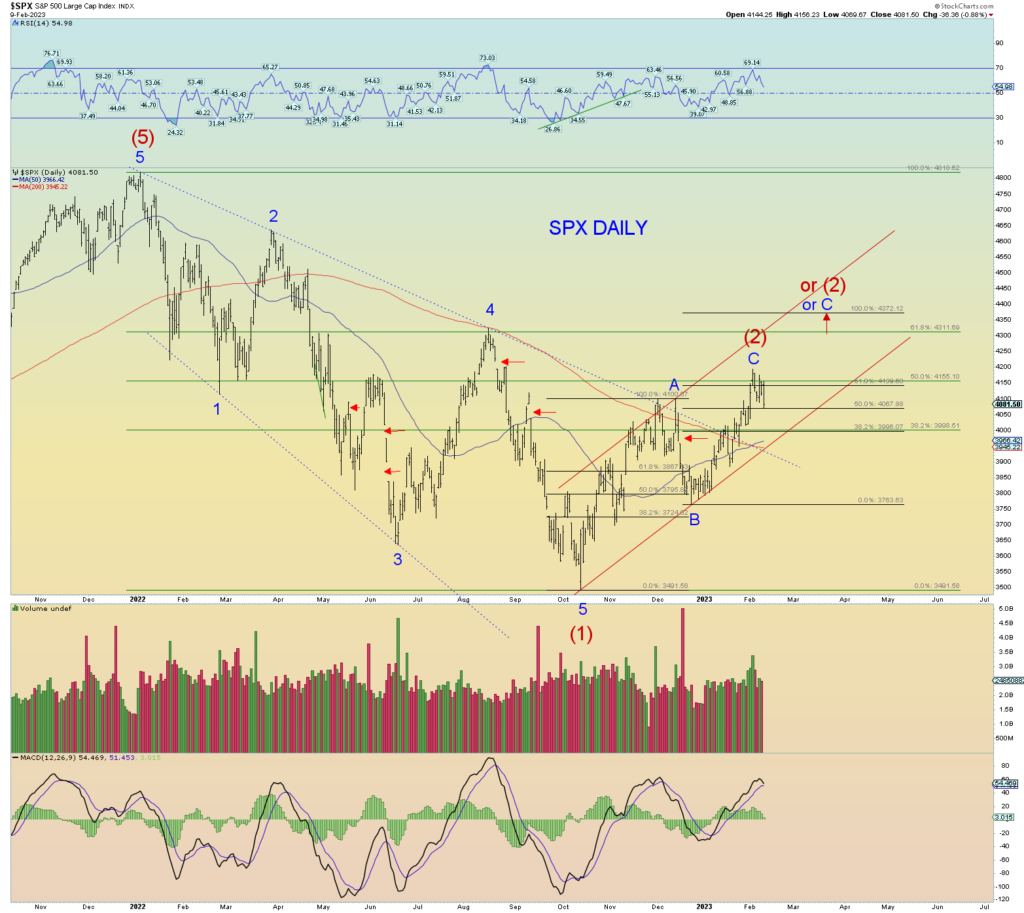
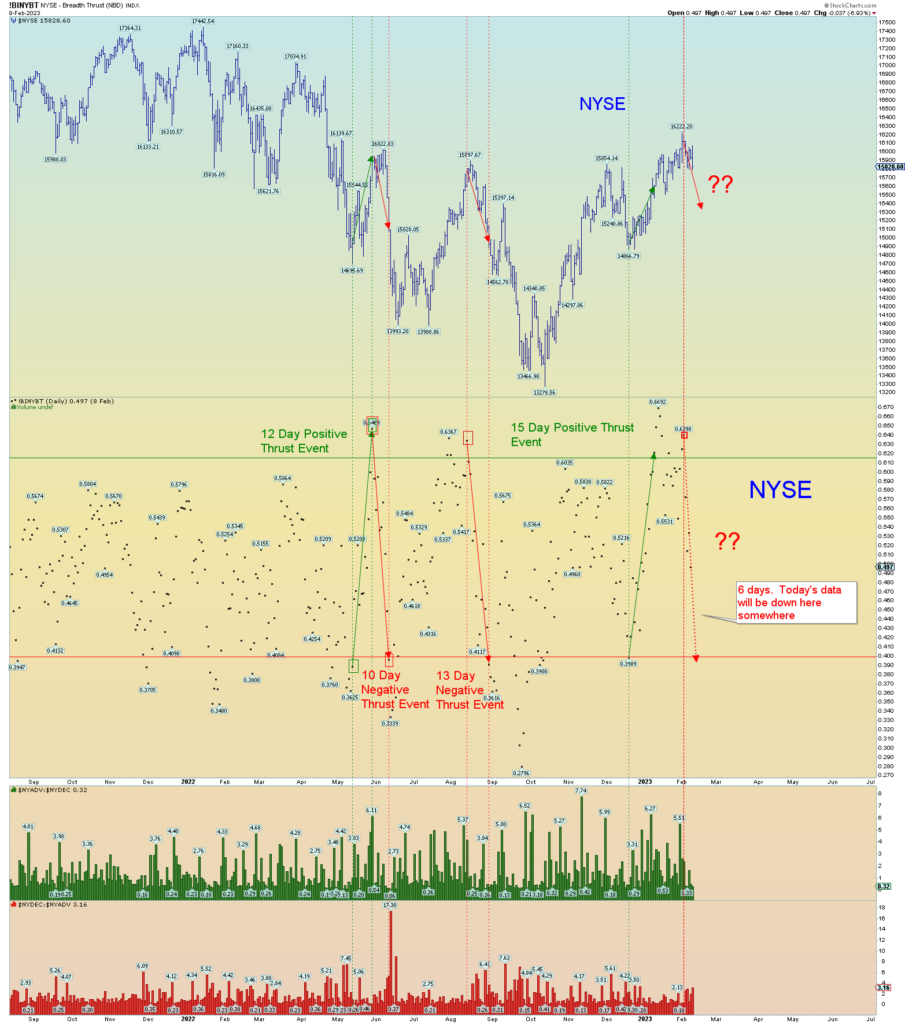
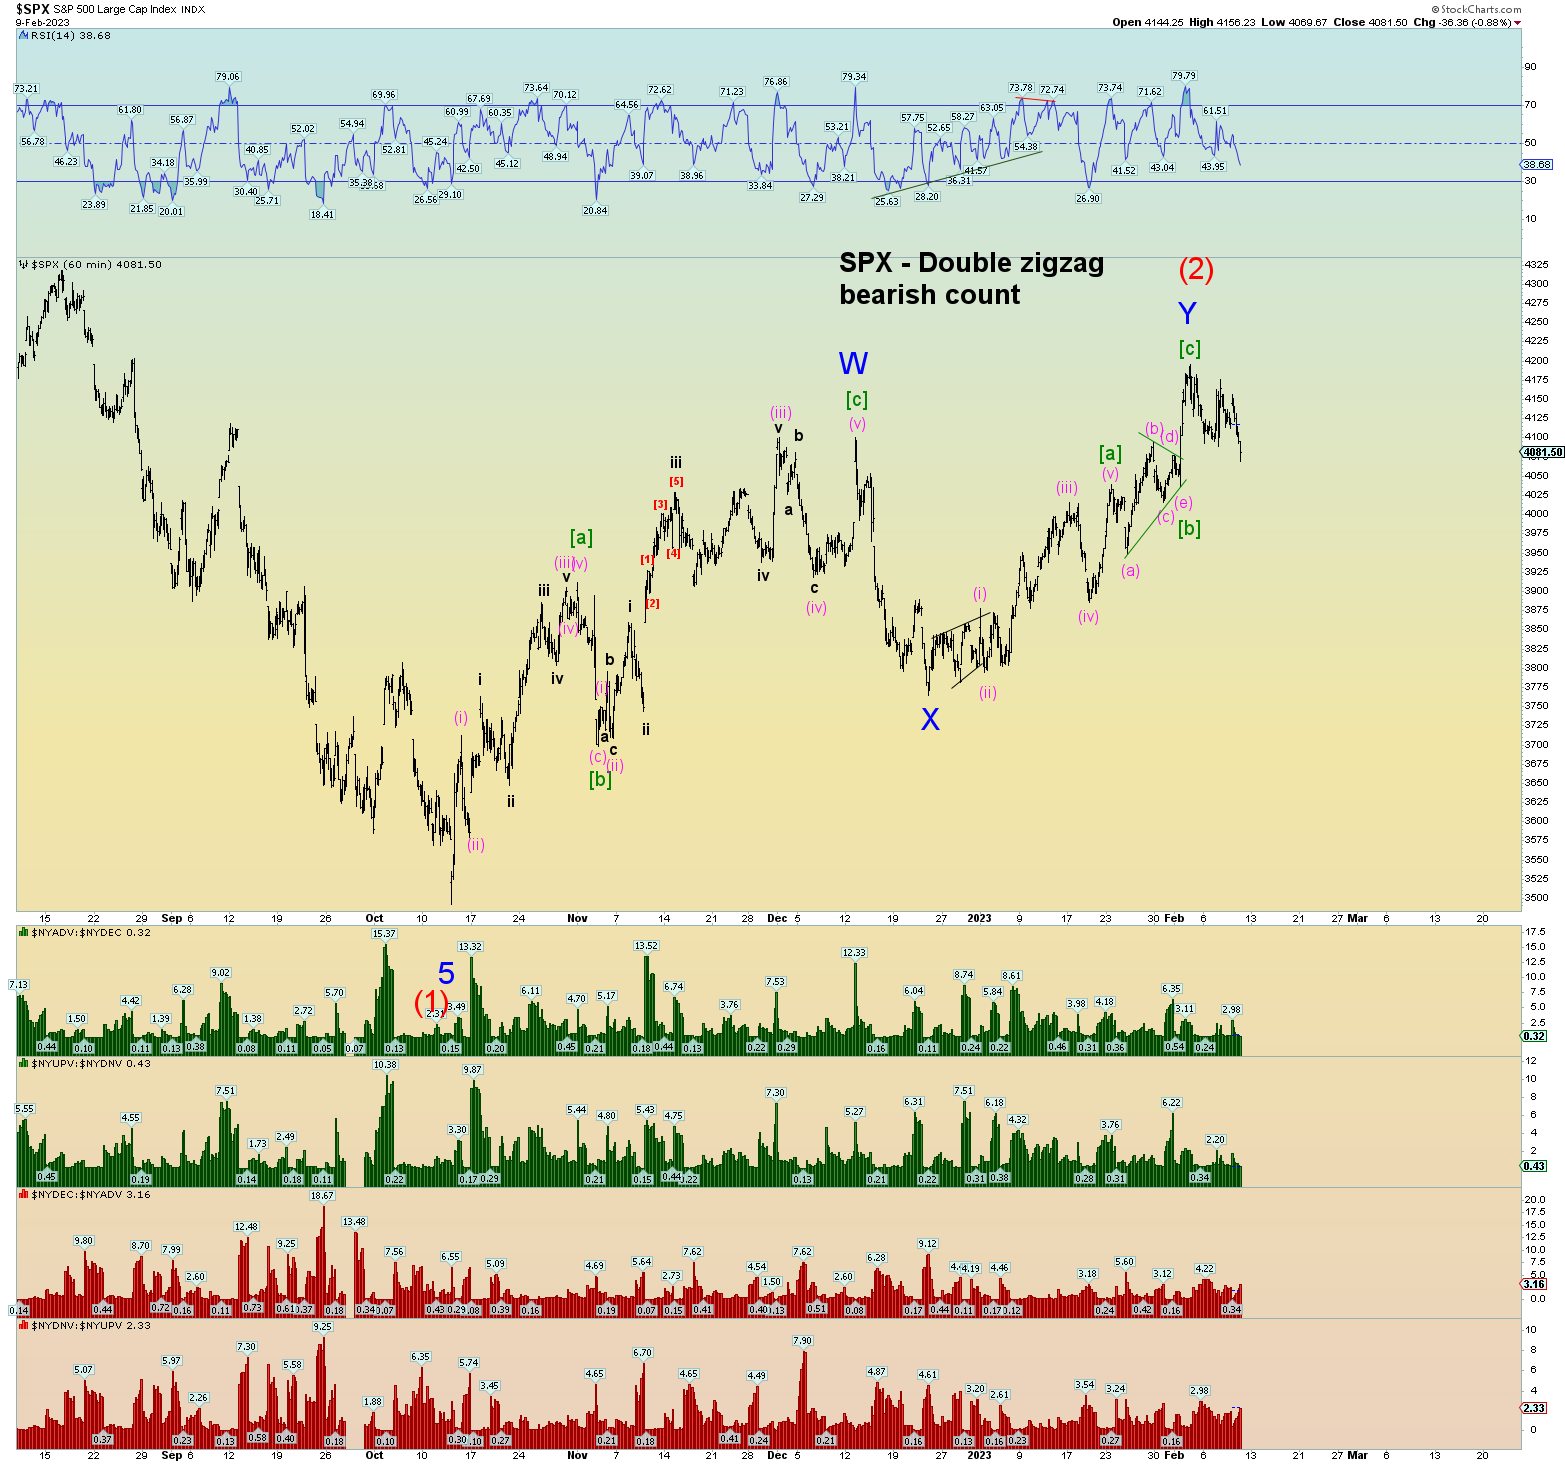
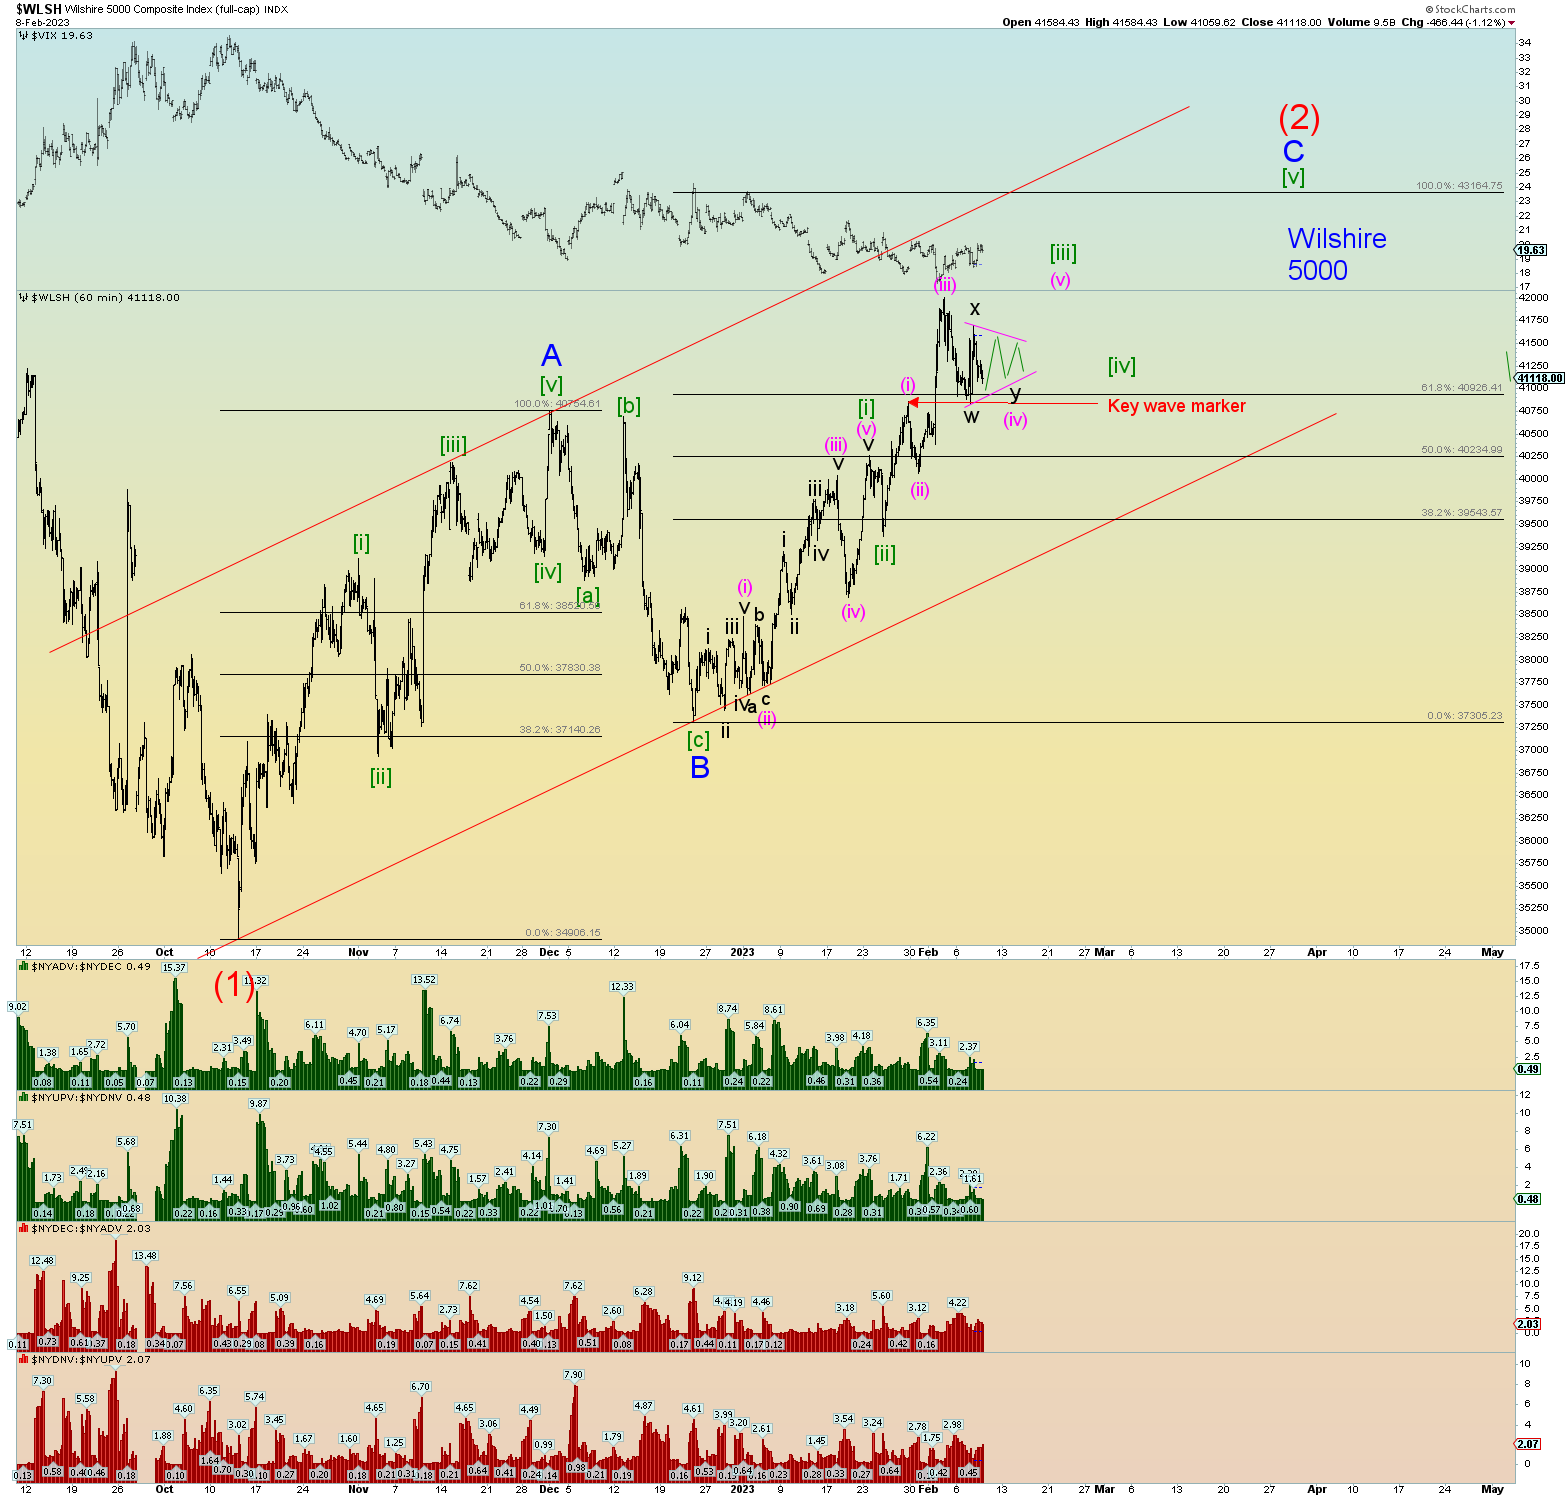
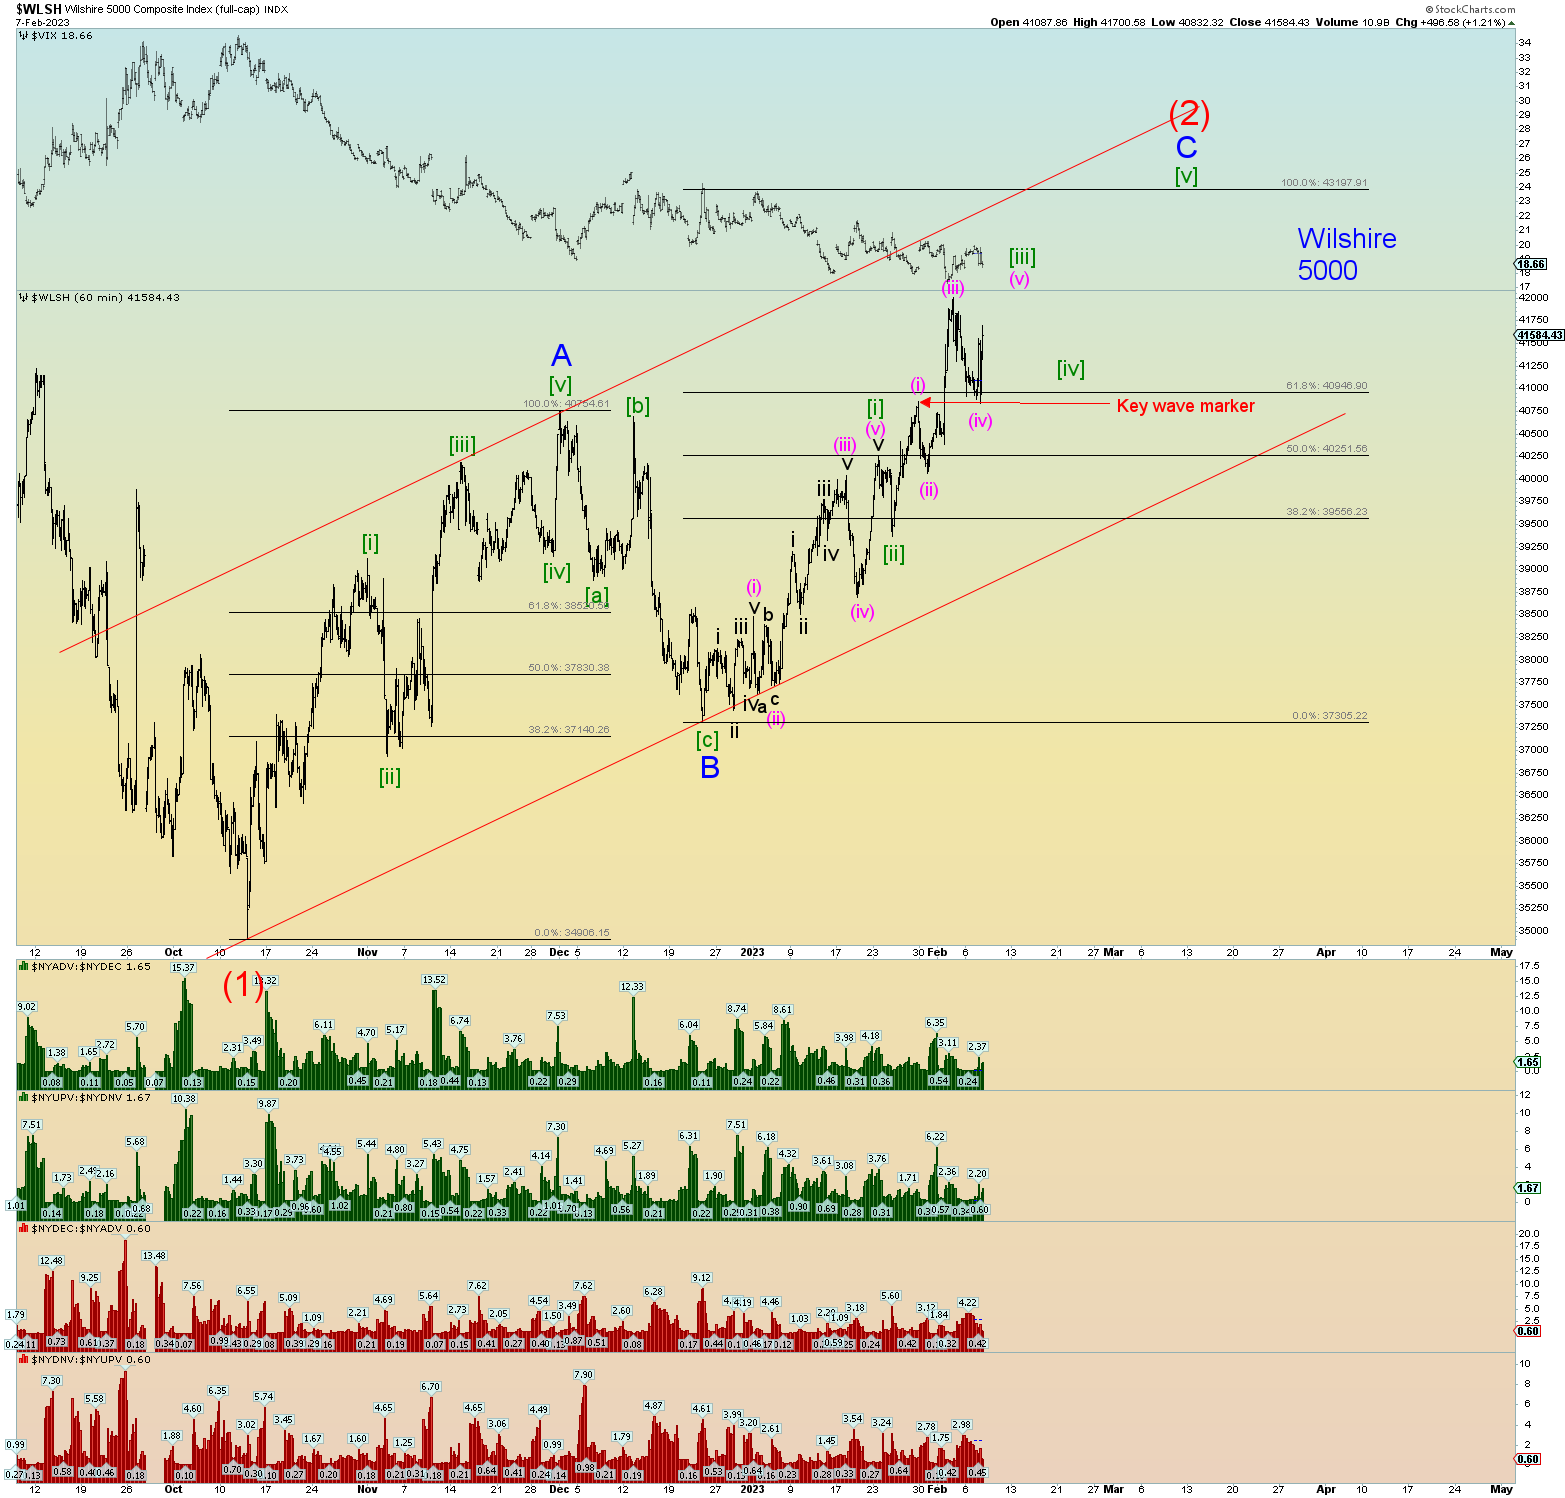
The count: Looking for some kind of 5 wave structure down to confirm the downtrend. Not really there yet.