Elliott Wave Update ~ 22 Dec 2022

Bah, I had a chart prepared but got caught up in other things.

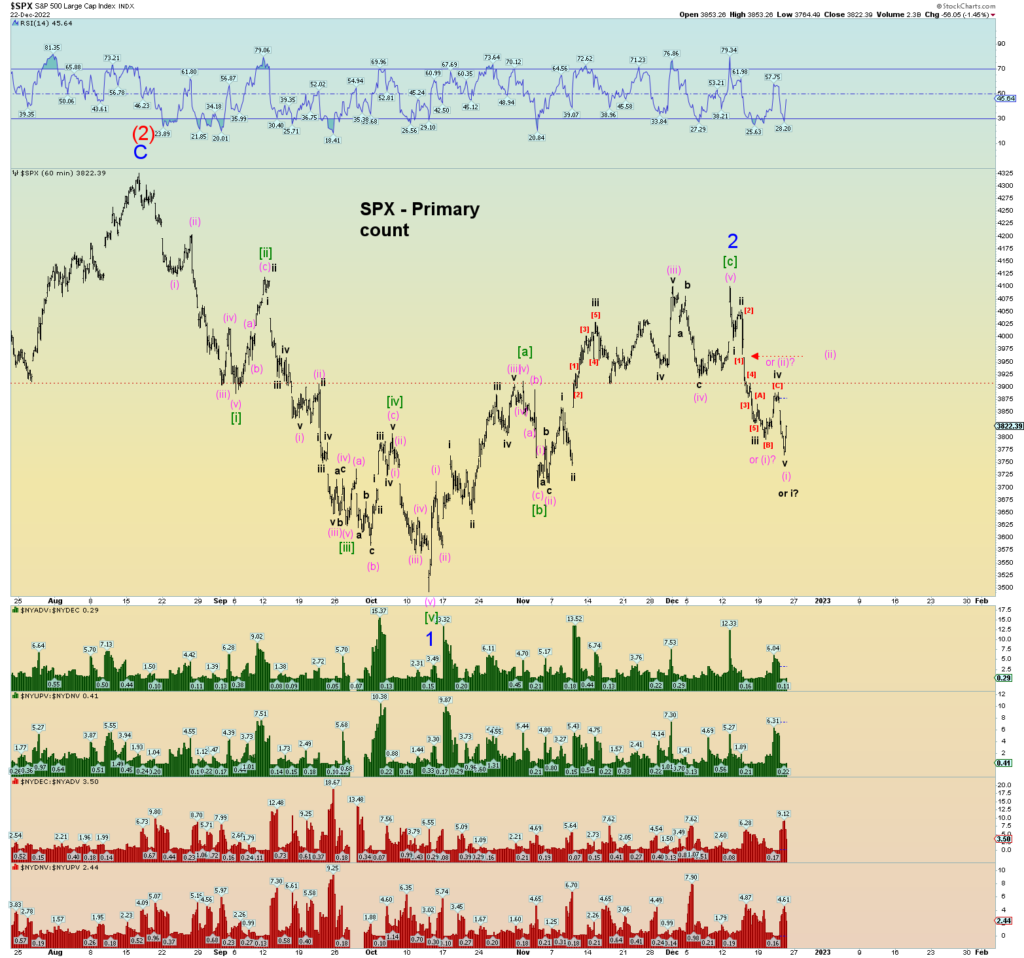
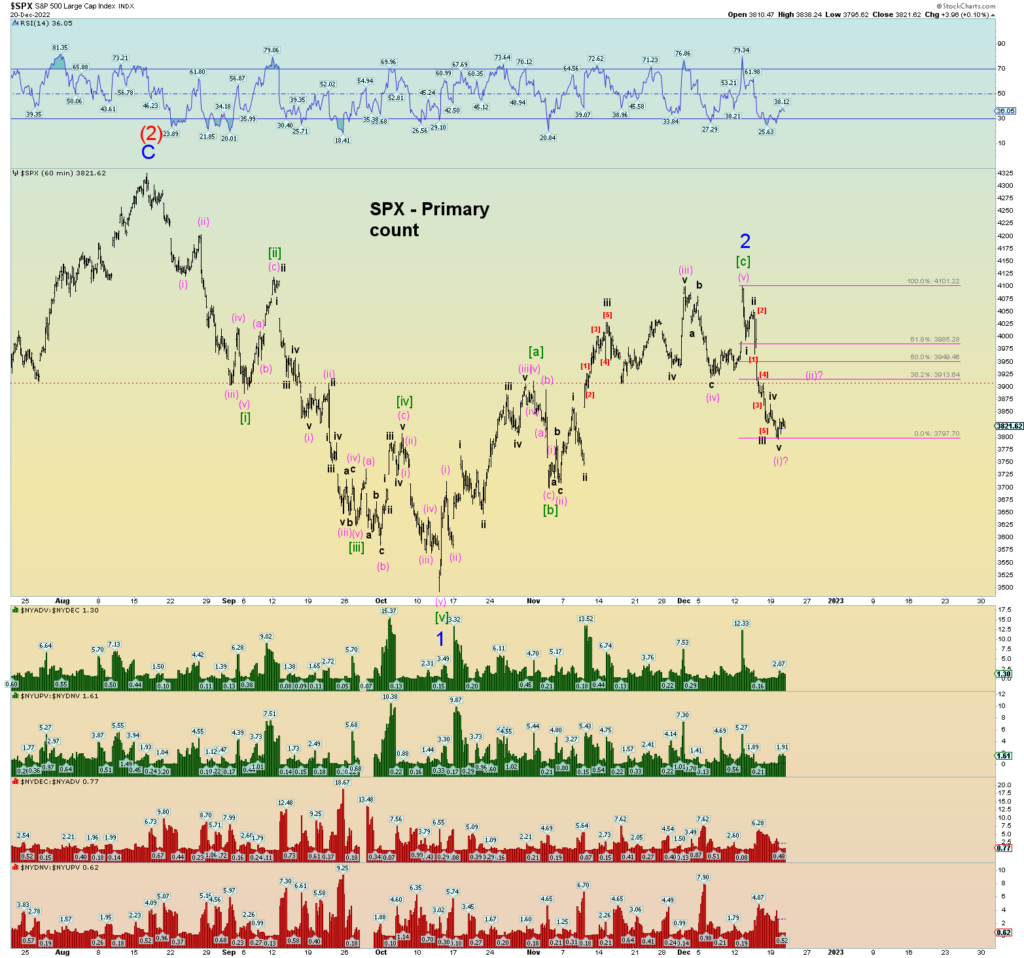
This seems about correct. Don’t get lost in the squiggles too much. If Minor 2 of (3) has topped as the larger count suggests, the path for prices is ultimately down down down to complete the overall 3 of (3) pattern.

Elliott Wave Update ~ 19 Dec 2022

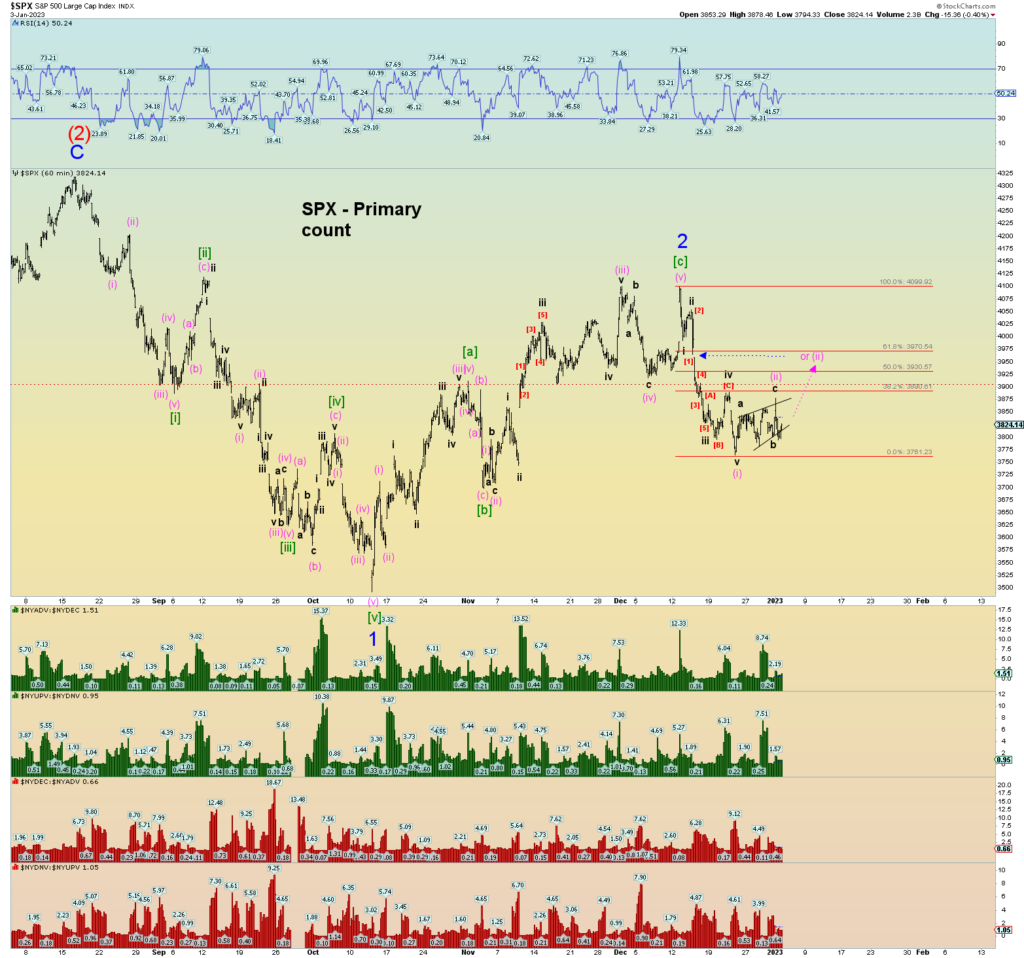
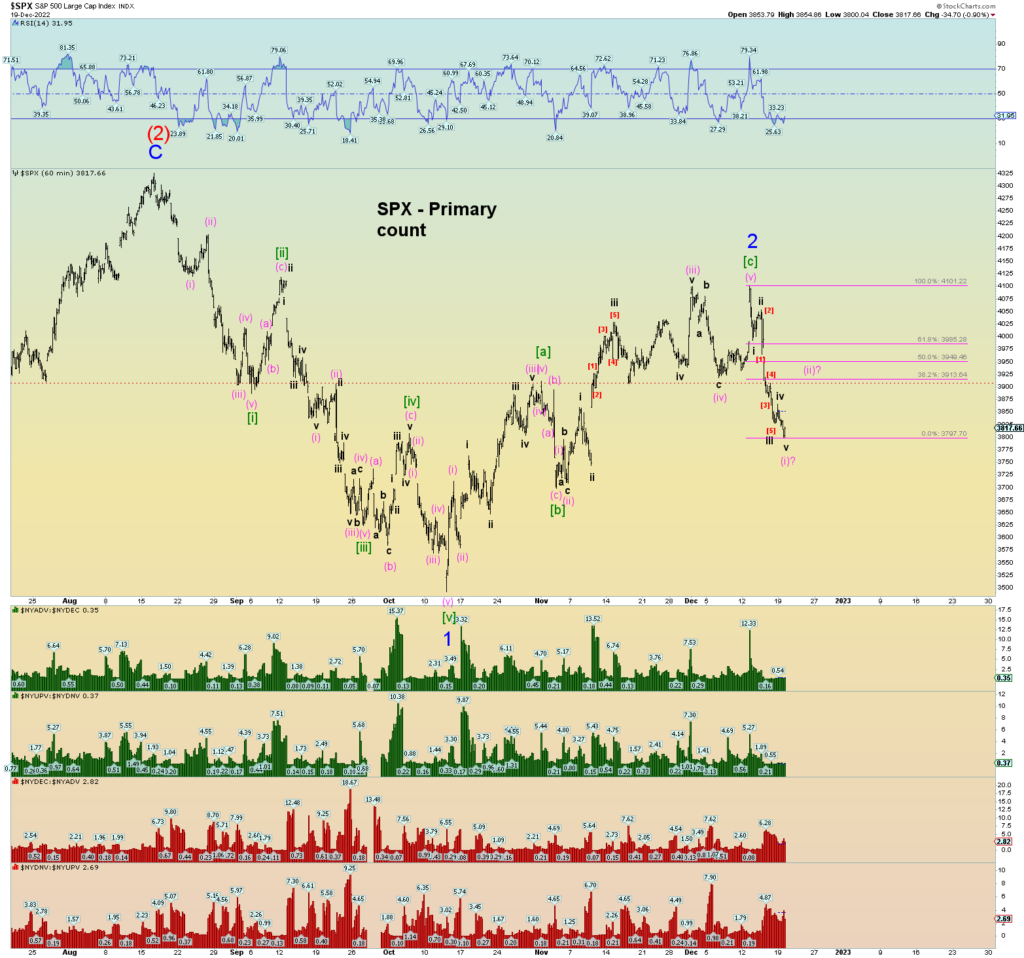
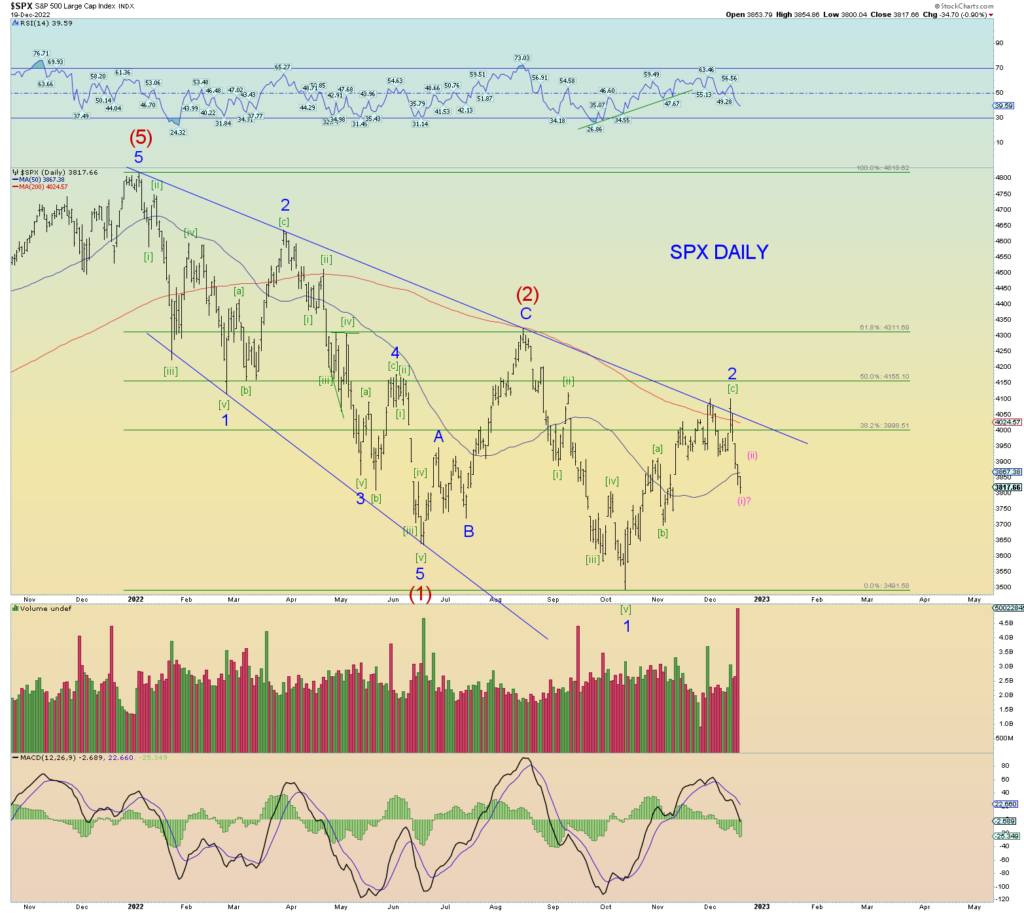
A 300-point SPX drop from Minor 2 peak. Perhaps we have reached wave (i) of [i] of 3 of (3) low.

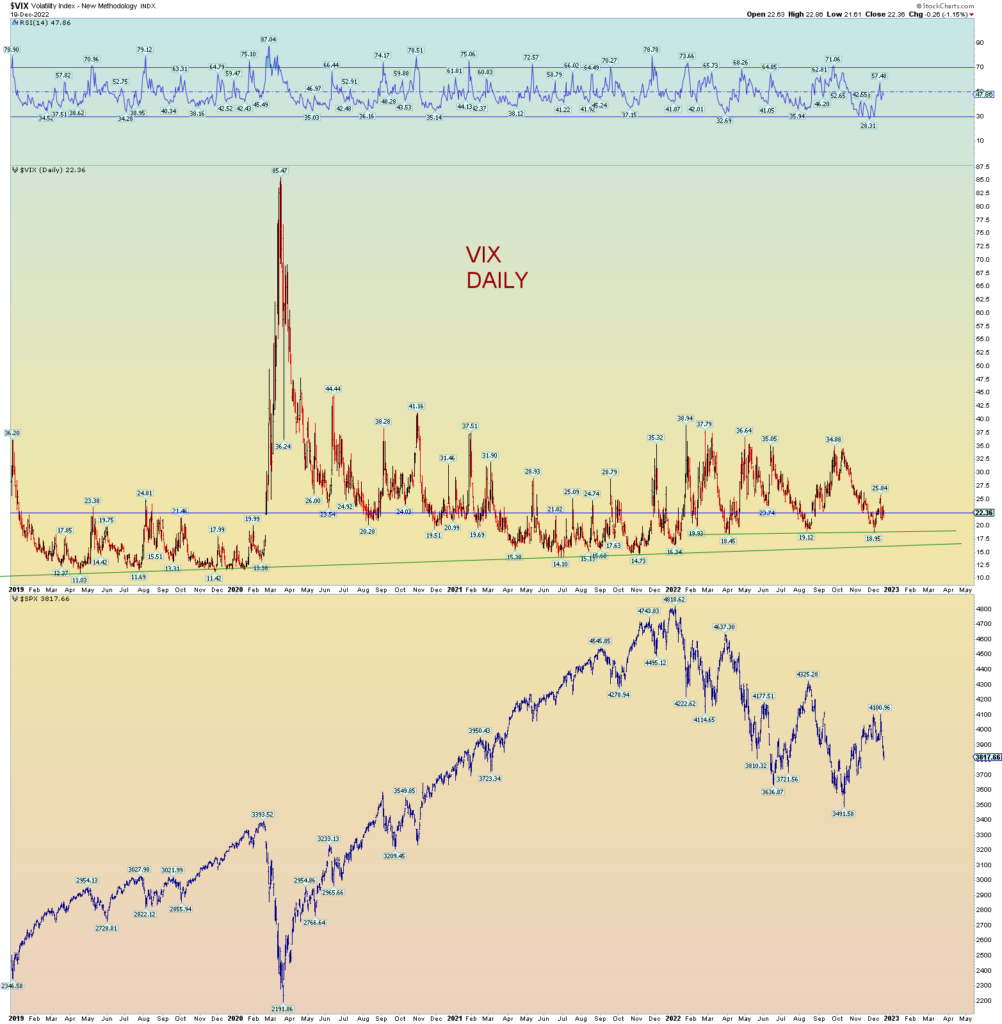
Market is at a meager sub 23 VIX. Not much fear in the market at all despite the 1000-point SPX drop from absolute peak earlier this year.

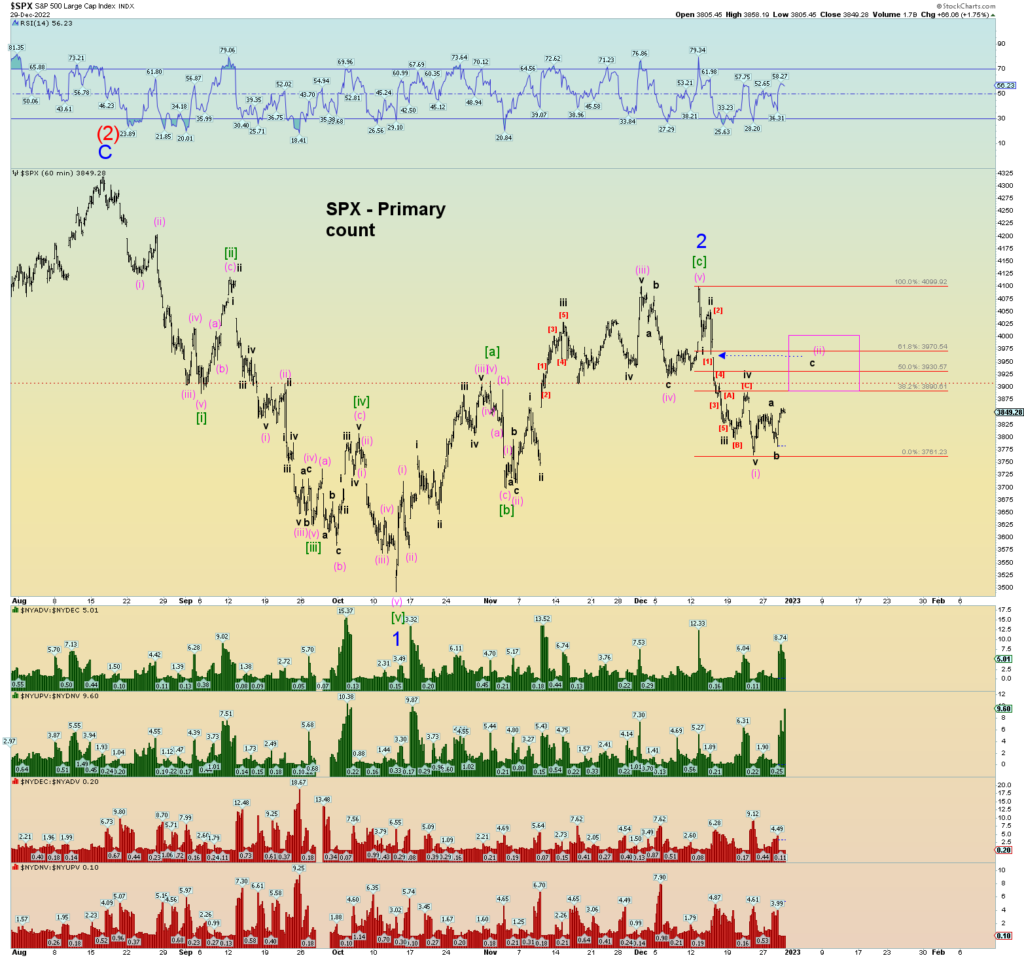
Elliott Wave Update ~ 15 Dec 2022

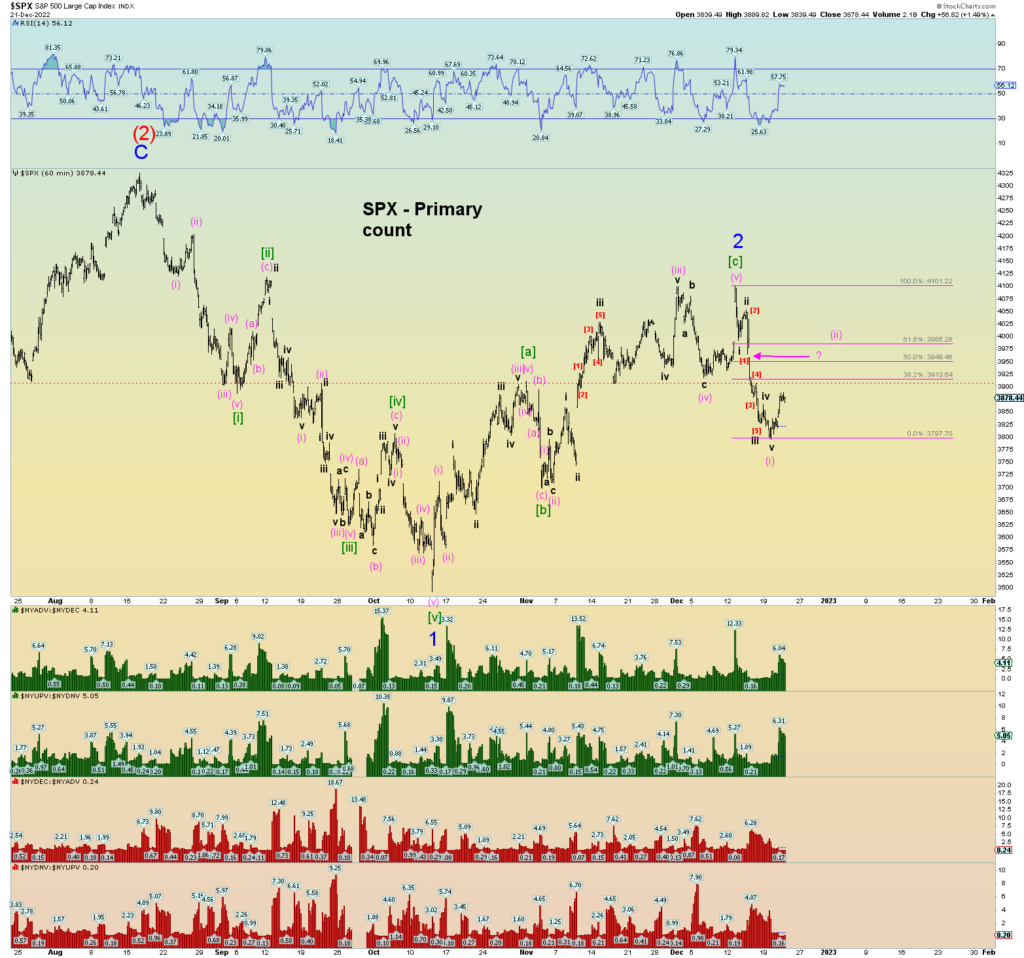
At the end of yesterday’s post:

“…not quite ready to throw the towel in on the most bearish count of Minor 2 of (3) high, but prices need to turn down soon for it to be a reality.

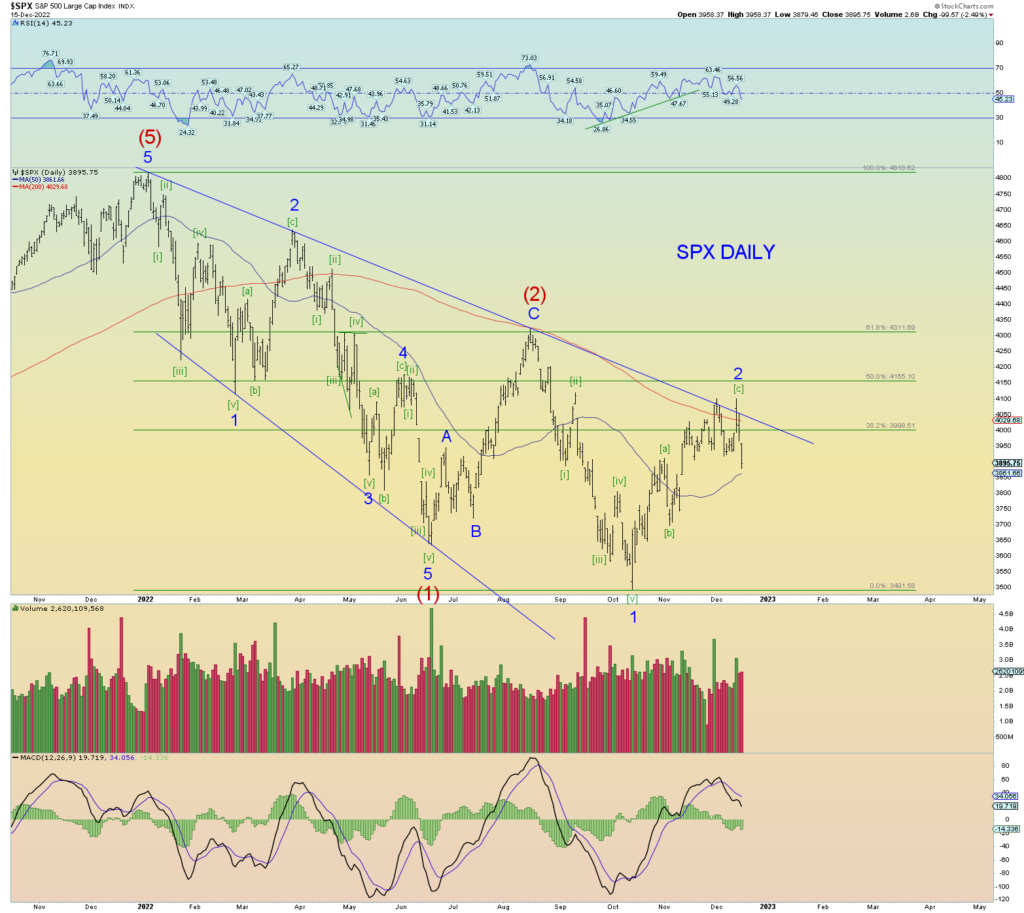
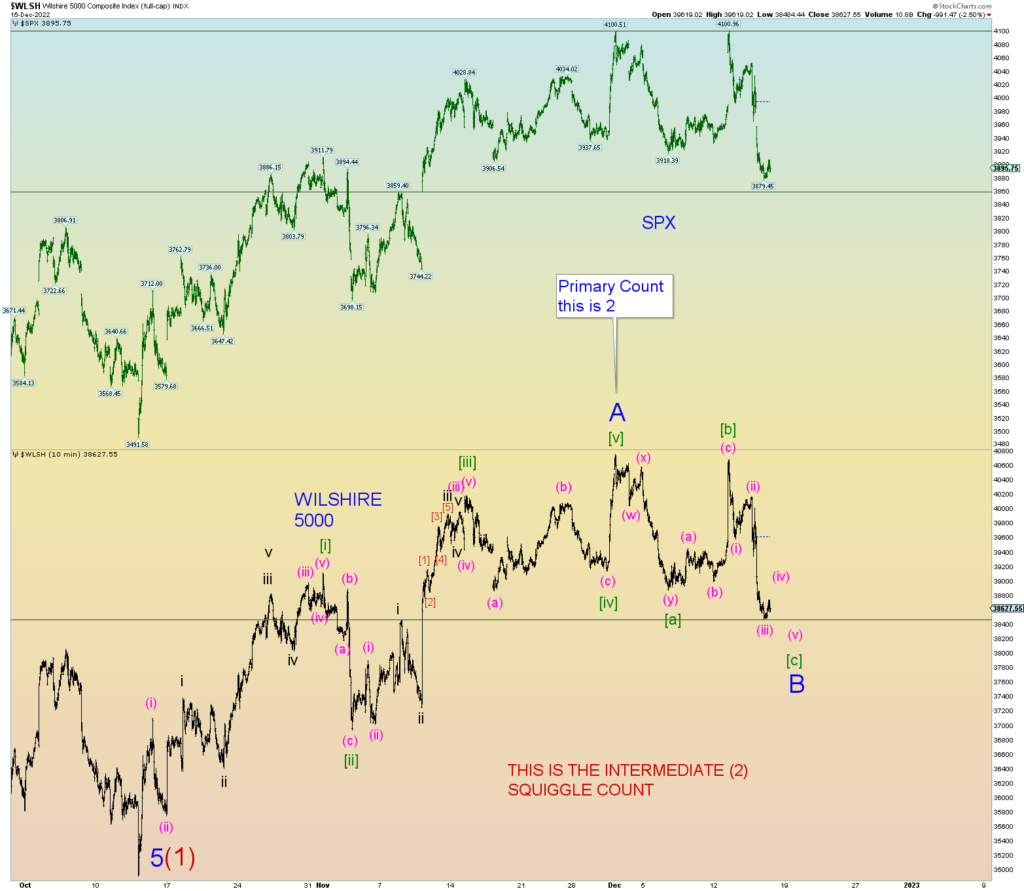
Well, we asked, and the market seems to have obliged. For now, at least. SPX 3900 was closed under which is more bearish than not. This would be considered the “kickoff” to Minor 3 of (3) down.

And finally, if this downdraft today turned out to be yet another whipsaw head fake, the bullish count alt. Whereby we would get a Christmas rally in low volume environment. The open chart gap on the SPX is still intact.

Elliott Wave Update ~ 14 Dec 2022

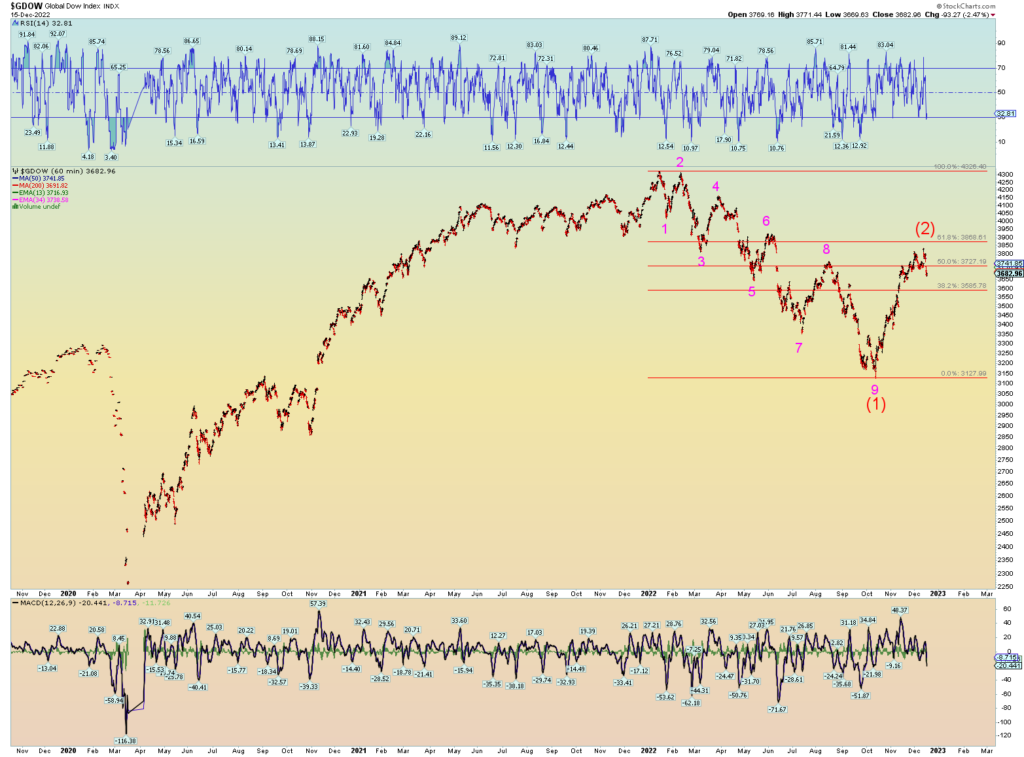
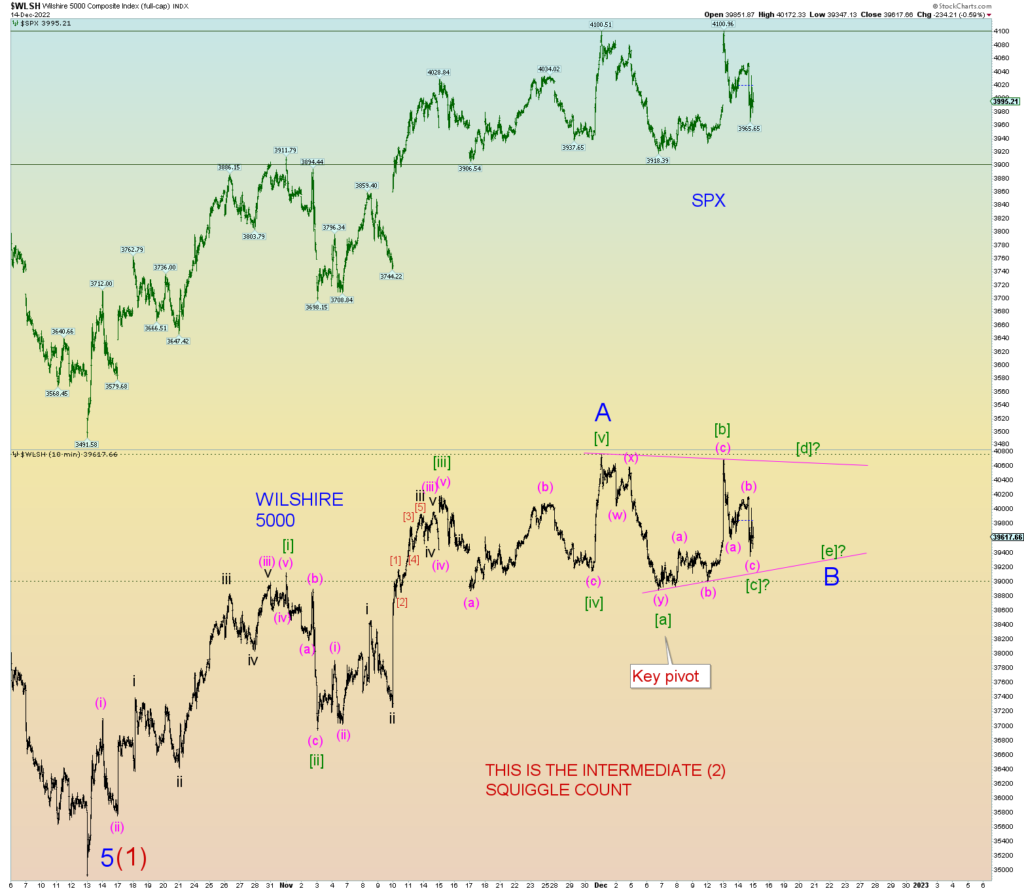
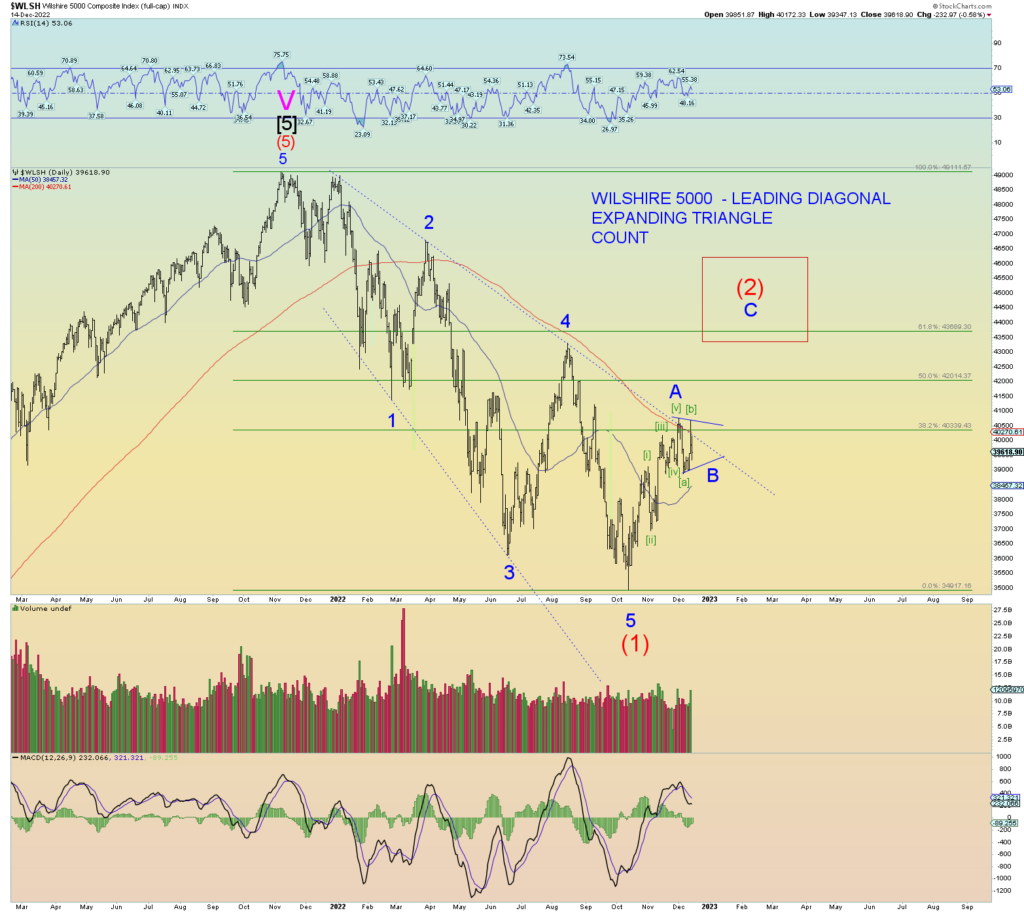
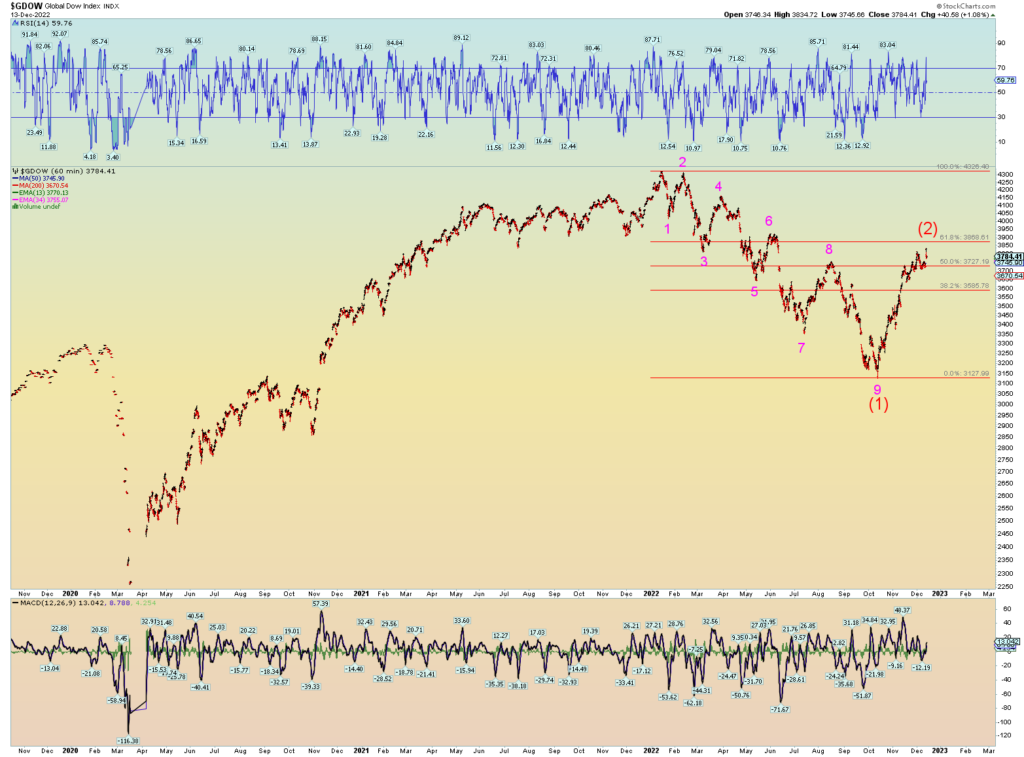
Rather than show all the same Minor 2 of (3) primary count charts again, today let’s take a different approach and work out the bullish count of an Intermediate wave (2) on the SPX and Wilshire. We have already determined that the DOW Industrials is wave (2) just by sheer size and amount of retrace. We can also consider the Global DOW in wave (2). See last night’s charts.

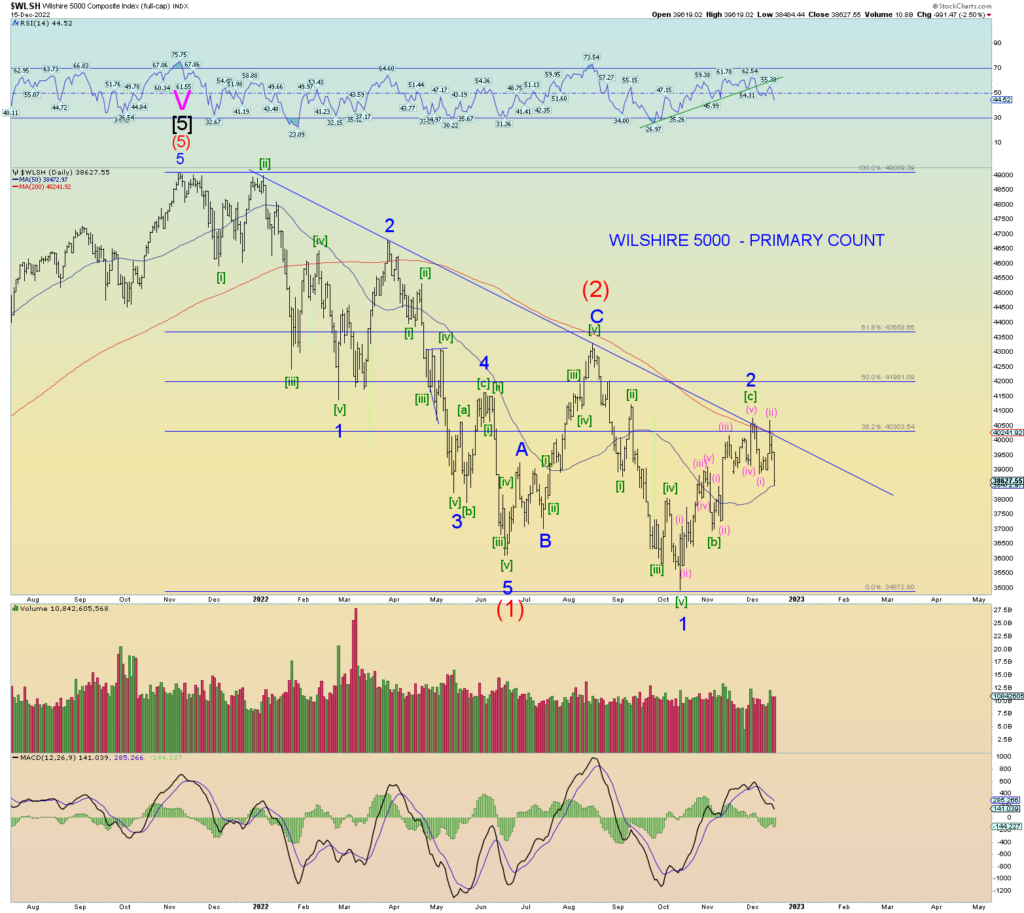
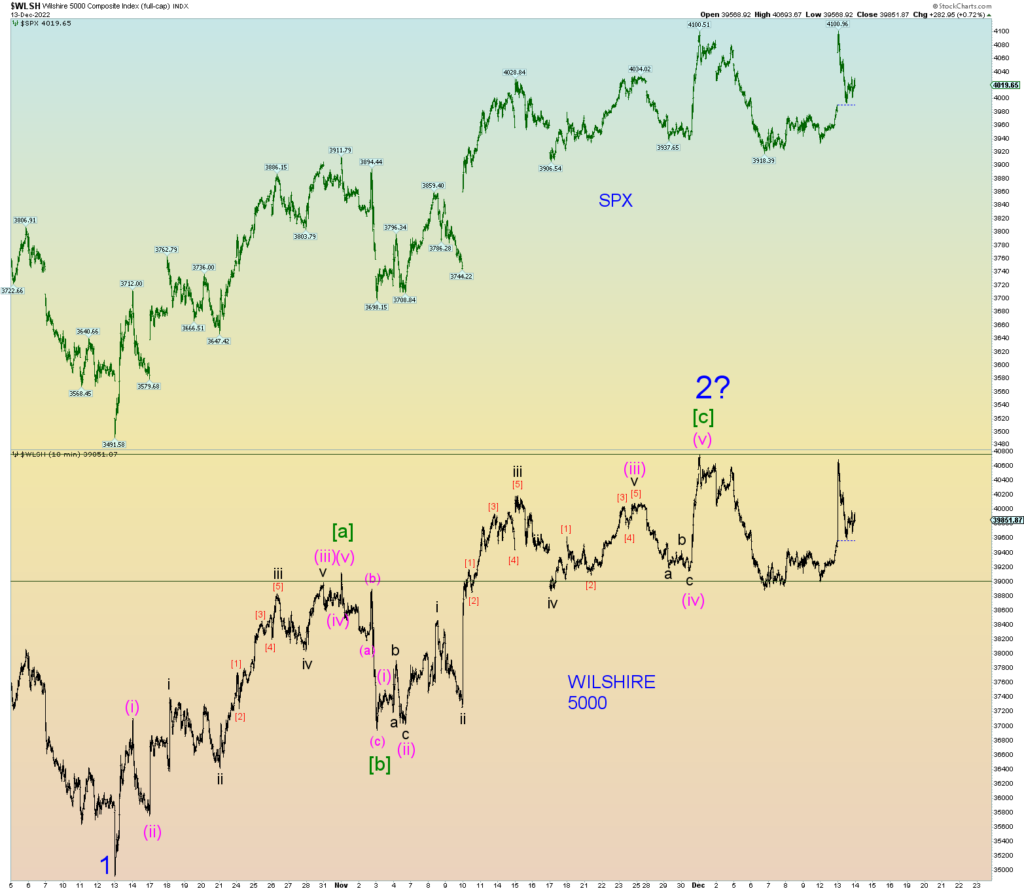
Today’s price action, although seemingly bearish, doesn’t yet count very bearish in actual wave counts. Yesterday’s opening spike to a 4100 SPX peak (and also on the Wilshire) does not count as an impulse up. It actually looks like a “three” wave count. Therefore, we might assume another poke, at the very least above 4100 high is coming.

Ever since prices burst forth higher on the opening of November 10th, thereby creating a 110-point massive open chart gap on the SPX, prices have held between support of 3900 and resistance of 4100. So, in one sense, price action has been constructive and “chewing” through selling in an effort to consolidate in this range and eventually breakout higher.

If that breakout higher were to come, then Intermediate (2) is the count indeed for the SPX and Wilshire. The market is going into a very low volume holiday period which probably favors the bulls more so than the bears.

The market cannot afford to lose much ground here from a bullish case. Any price that falls below SPX 3900 is in quick danger of filling the massive open chart gap. Think of it this way: Where do you think all the “stops” reside in the market? A break under 3900 may in fact create a selling cascade situation and a powerful downdraft would occur trapping any and all remaining bulls and causing an outright selling panic. And this is exactly how a wave 3 of (3) down is supposed to behave.

So, I am not quite ready to throw the towel in on the most bearish count of Minor 2 of (3) high, but prices need to turn down soon for it to be a reality.

Elliott Wave Update ~ 13 Dec 2022

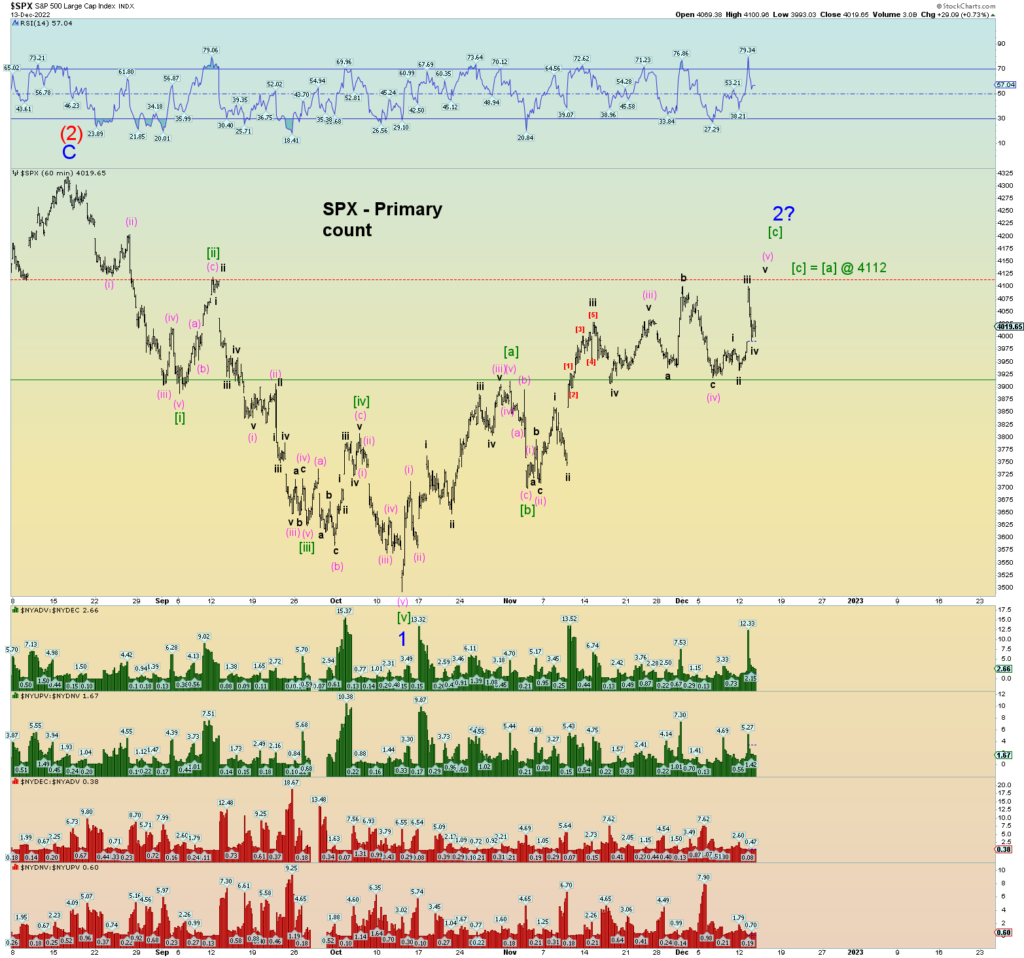
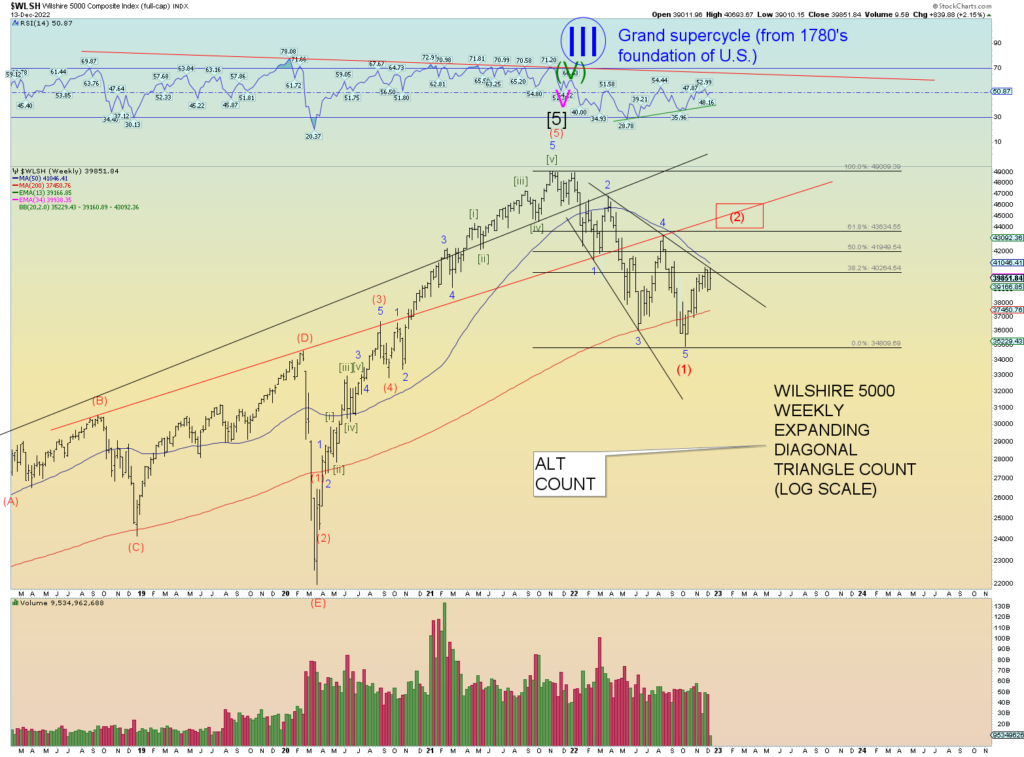
SPX made a technical new Minor 2 of (3) high today but the Wilshire 5000 did not.

Perhaps it’s just a matter of where [c] is not going to finish until it equals wave [a] at 4112 SPX or so. The primary count allows for another marginal push.

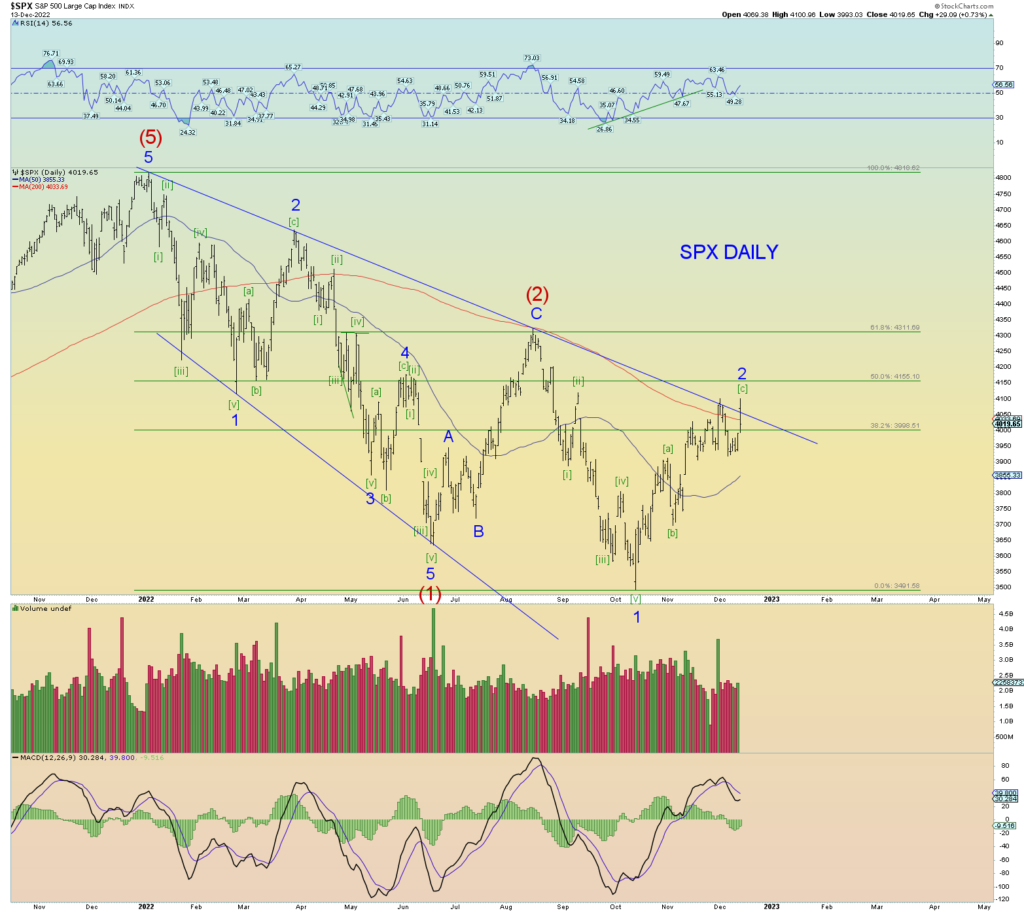
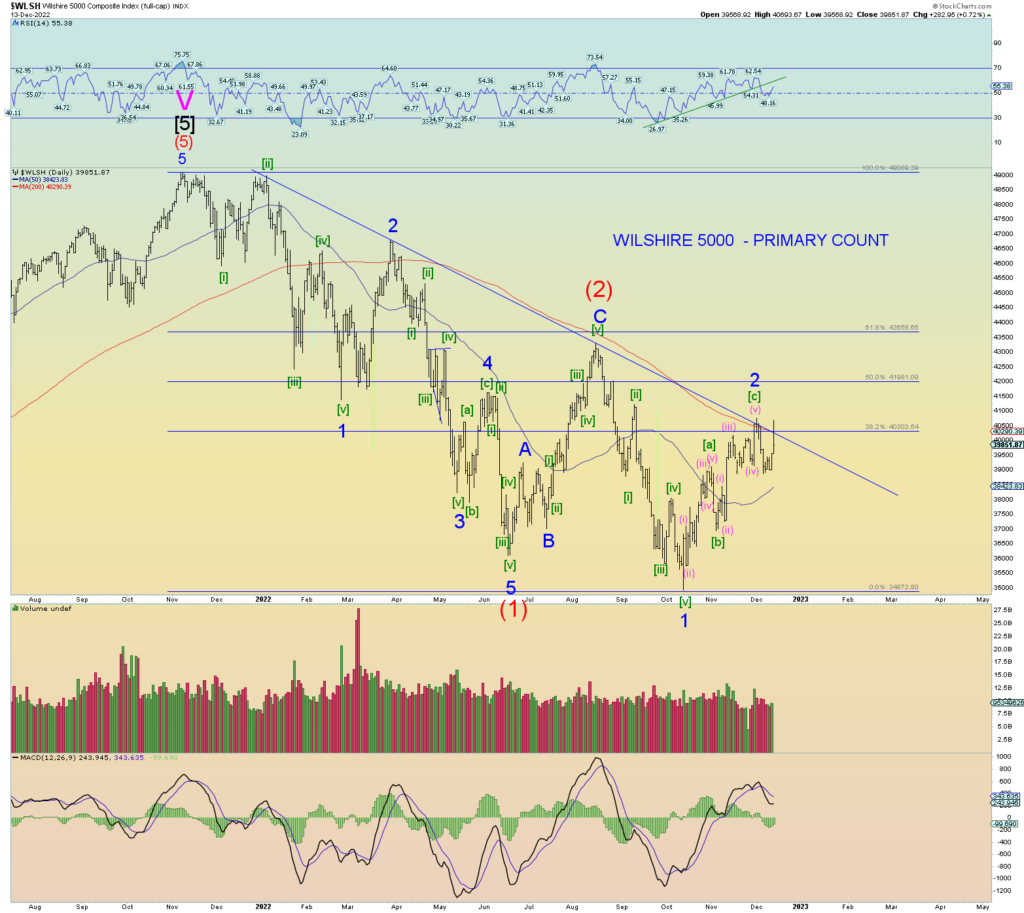
Prices trying to break above the downtrend line(s) on the SPX and Wilshire.

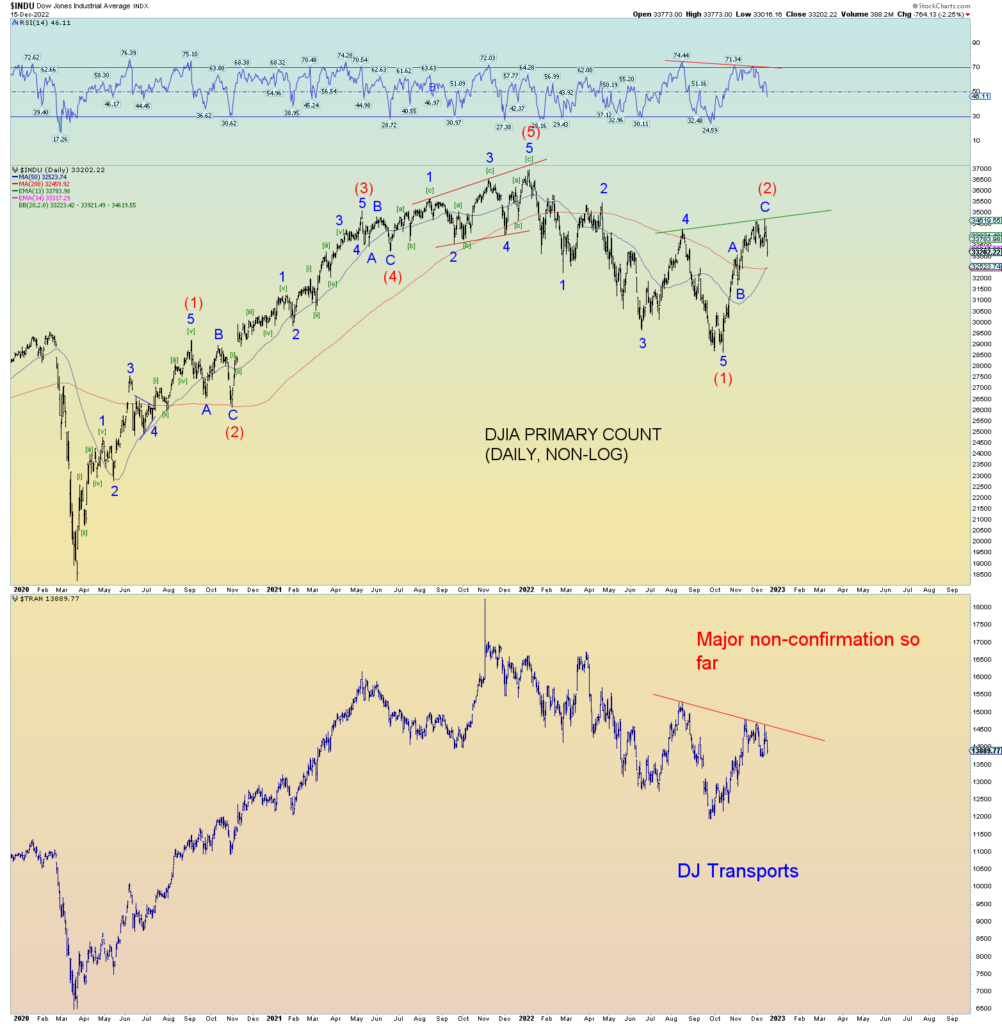
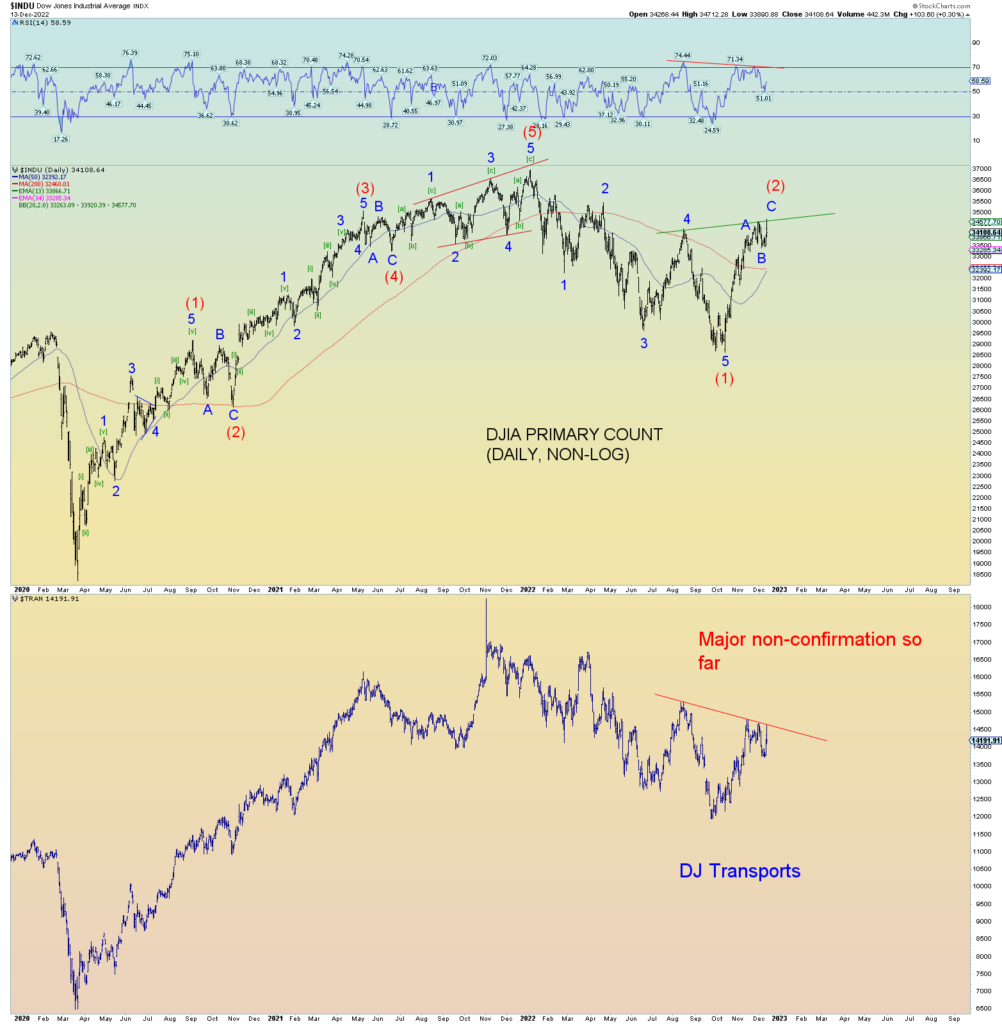
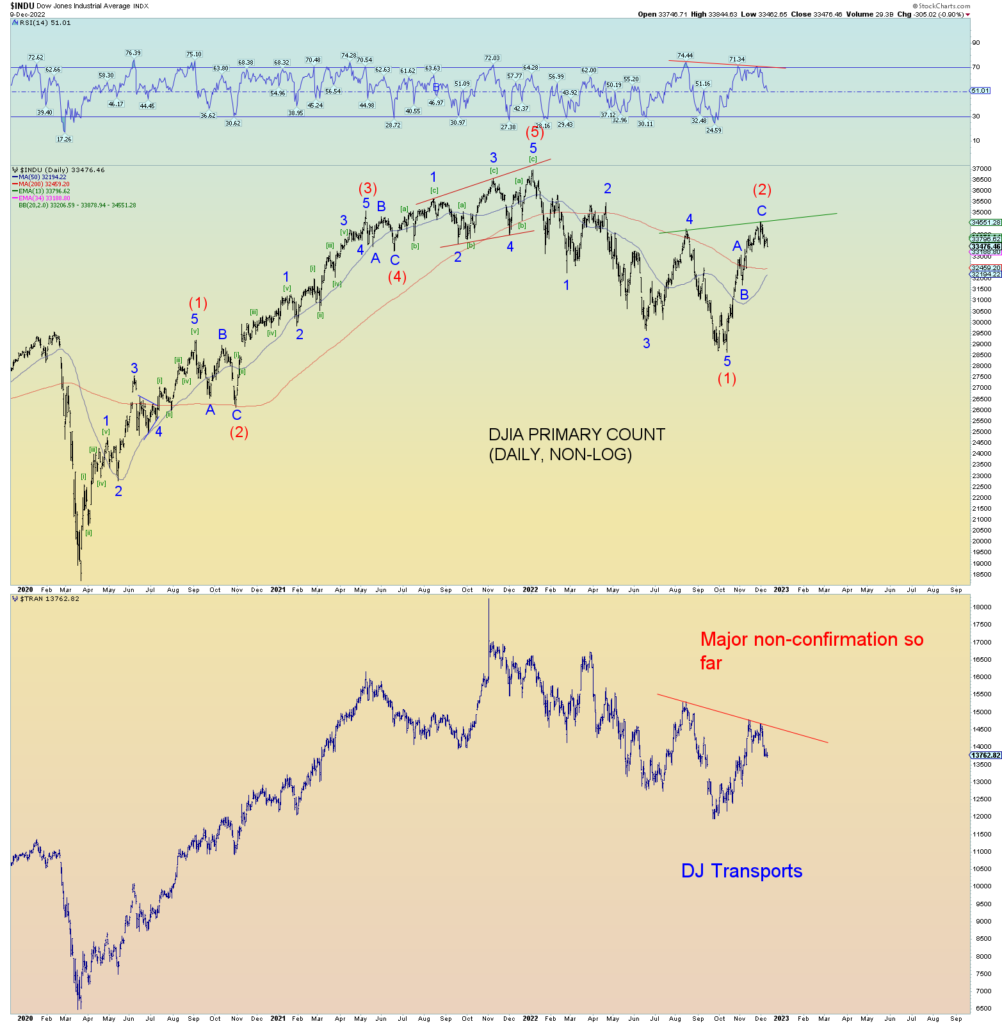
DOW theory divergence still in place.

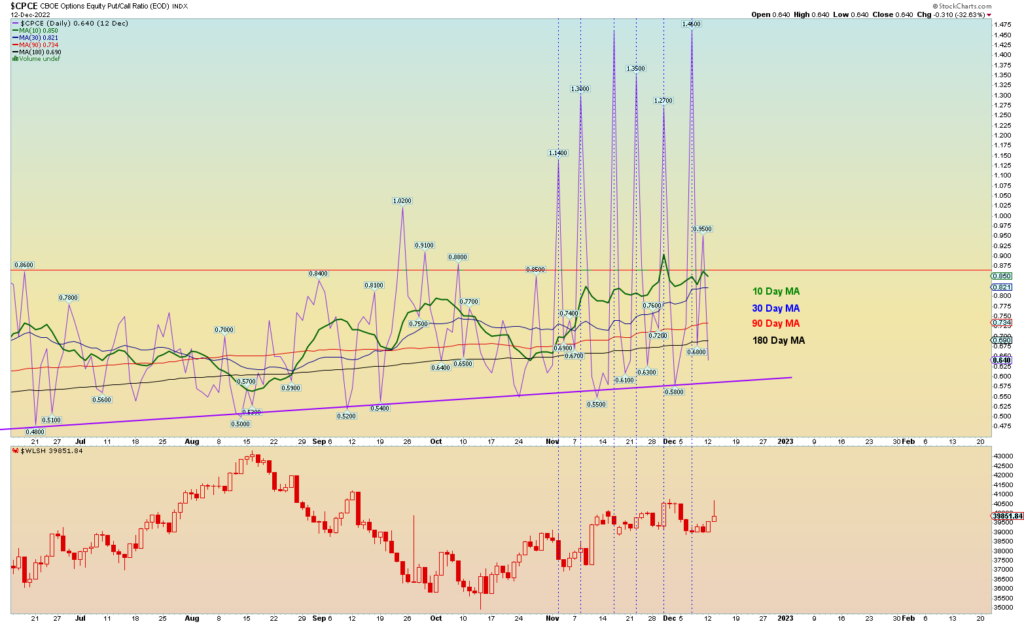
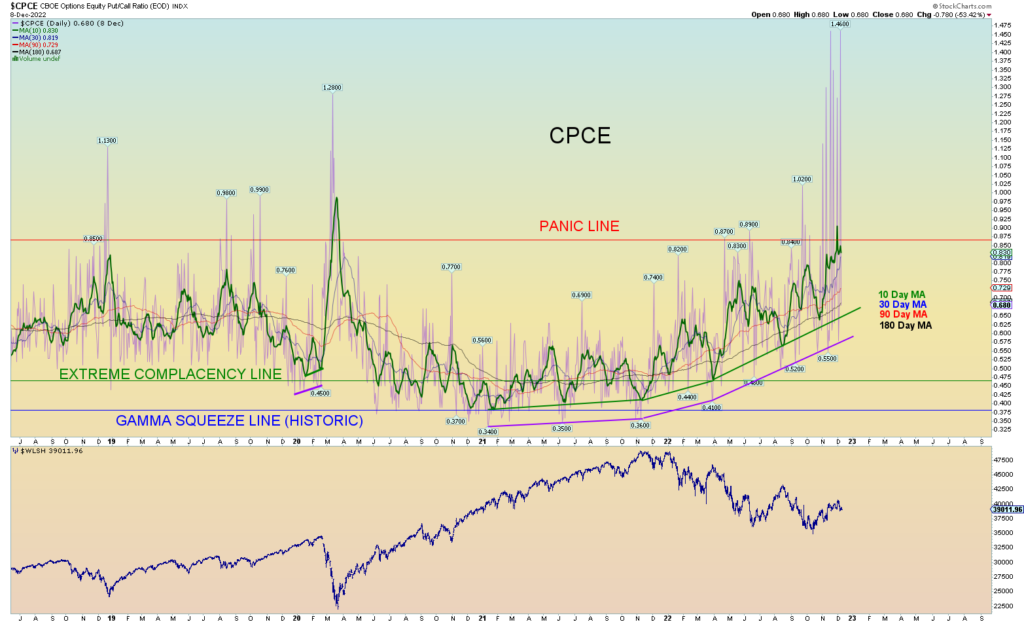
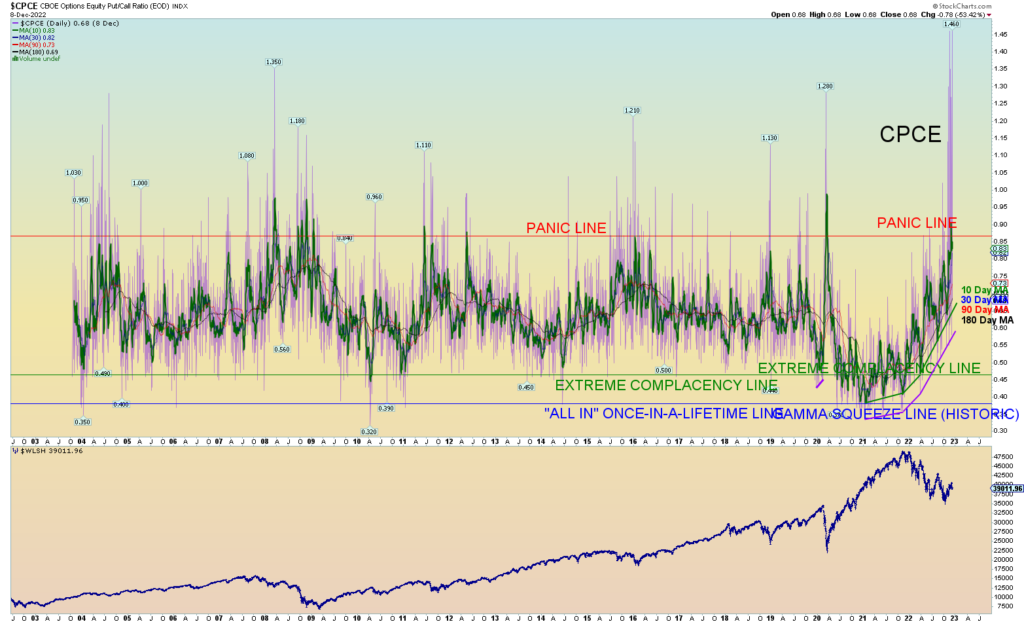
CPCE madness as of late. It looks like the results of a bunch of malfunctioning computer algorithms.

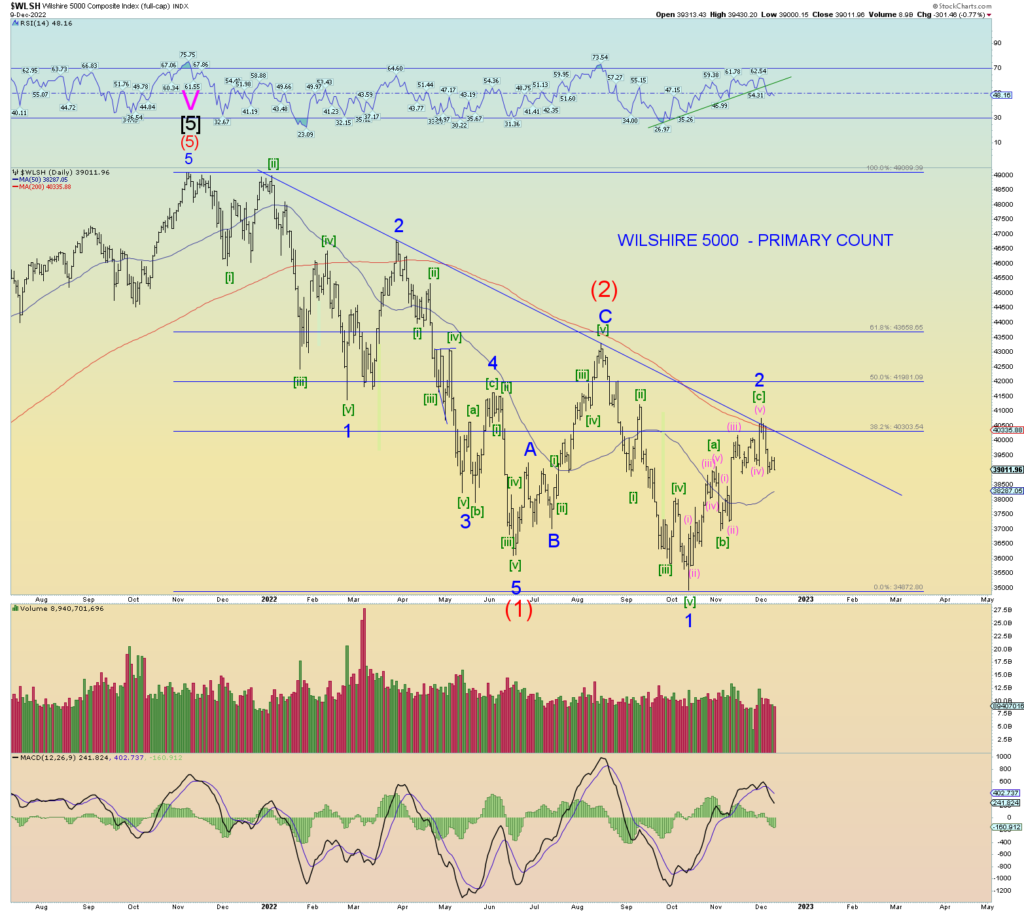
The top long-term alternate is that the October low in the Wilshire was Intermediate (1) low and that the market is in the middle of an Intermediate (2) retrace. If so, expect at least a 61.8% Fibonacci total price retrace and prices to go above “4” of (1).

Timewise we are looking for first quarter 2023. People get mad when I show this alt as if I am changing the primary count (I am not) but what can we say about the DJIA? It has rallied 21.5% off its October lows and today’s peak was a mere 6.15% from its absolute peak of early January. Even the Global DOW has rallied almost 61.8%.

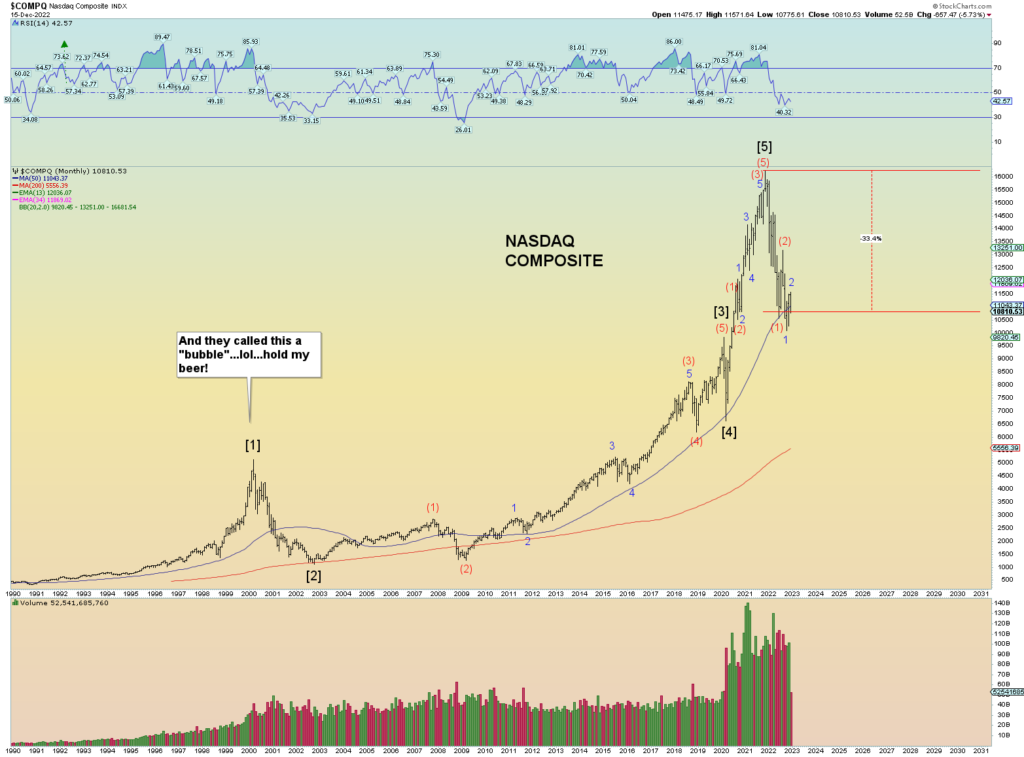
But it’s a completely fractured market as the NASDAQ Composite is still a full 30% beneath its absolute all-time peak.

Overall, the CPCE as of late reflects the sentiment swinging from one extreme to another. Do people go all in short or all in long? Schizoid market. The primary count suggests it will fall apart in wave 3 of (3) down. The rallies on the DJIA and Global DOW seem very extended, and the wave count is more than satisfactory on the Wilshire 5000.

Elliott Wave Update ~ 9 Dec 2022

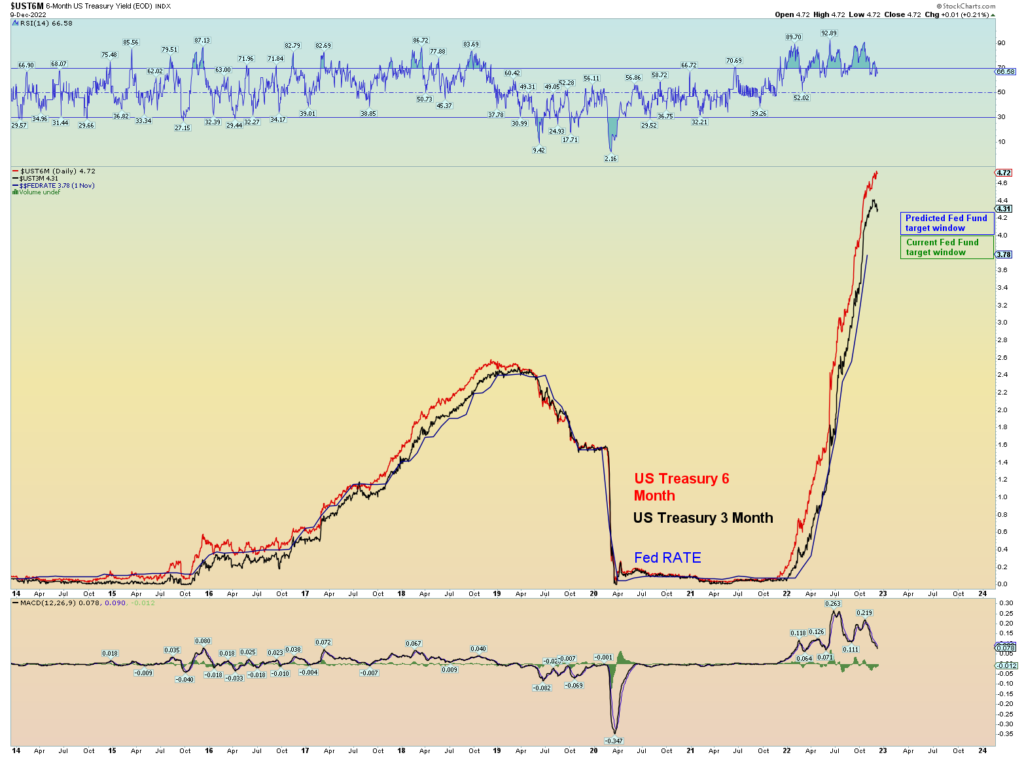
The 3/6-month Treasury bill rates are indicating that next week’s rate hike will only be 1/4 point. The Fed has been very consistent to keep its top range beneath the yield of the 3-month rate.

Unless the 3-month surges some more, expect a 1/4-point hike setting the top of the Fed Fund rate range at 4.25%, not 4.50% as was expected for many weeks.

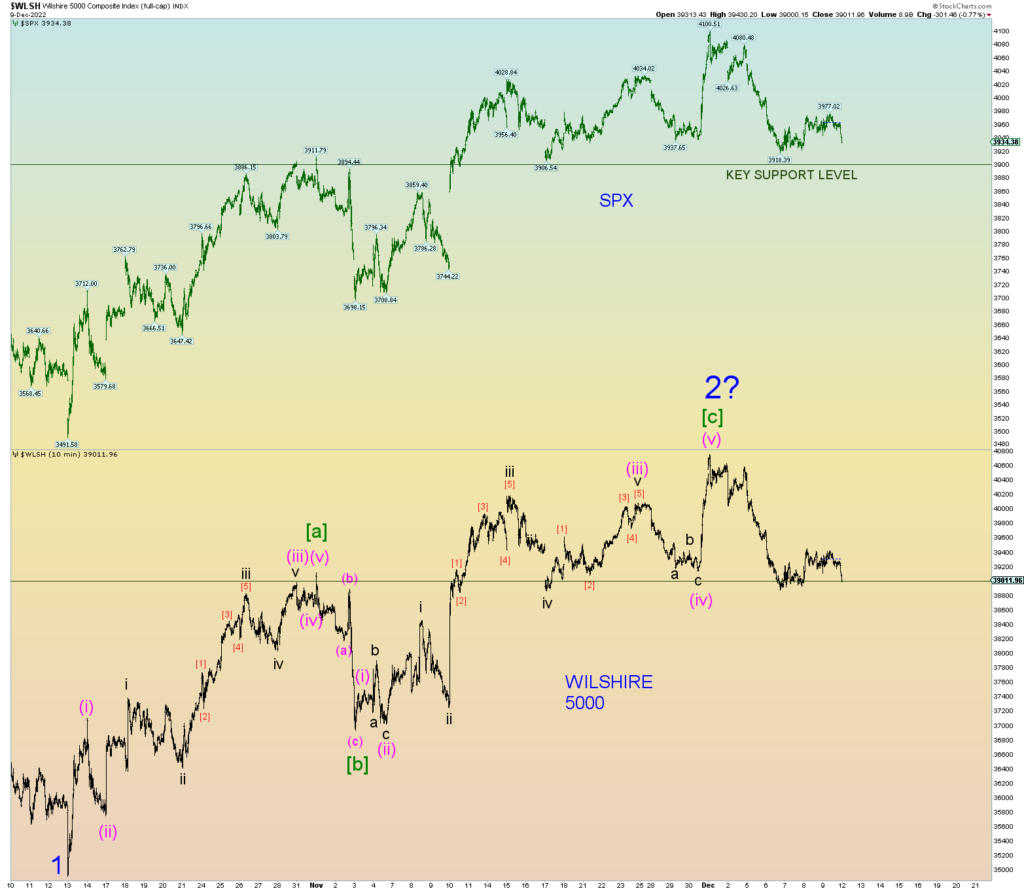
The short-term squiggles seem to indicate the market needs a lower low to confirm a nice 5 wave impulse move lower. At the end of day, the market seems to be indicating that will be accomplished come Monday. We shall see. We have support at 3900 on the SPX and 39,000 on the Wilshire 5000.

3,900 and 39,000. Seems a convenient coincidence.

The pattern on the SPX/Wilshire is almost a textbook [a]-[b]-[c] 5-3-5 zigzag structure and [c] pretty much equals [a] in price. That is why it is called a “corrective” wave 2. We need a solid break of support to help confirm wave 2 is over and wave 3 of (3) down has commenced.

The uptrend RSI has been broken. The market is losing strength and momentum is waning.

DOW Theory is flashing a bearish warning signal.

The wild extreme swings in the CPCE (the purple lines are the daily) reminds me of a seismograph reading of a huge earthquake. In this case, the earthquake – an outright collapse of the stock market in a nasty bearish wave 3 of (3) down – has yet to materialize. But the underlying warning signs are there. I can go back 20 years and not see this behavior.